
記住我


As they age, persons with HIV (PWH) accumulate comorbid conditions at higher rates than persons without HIV (PWoH) [1,2]. Given this, there has been increasing attention to frailty among aging PWH [3–5], and data suggest that frailty occurs at earlier ages in PWH than in control populations [4,6,7]. Although we can anticipate that aging, comorbid conditions, and frailty will combine to cause excess healthcare utilization of PWH beyond that of aging PWoH, few studies quantify the expected excess utilization. Meeting the needs of PWH as they age requires that we understand how aging and comorbid conditions will impact two burdensome and expensive forms of utilization – hospital and nursing home days [8].
Some studies find that hospitalization rates increased with age [9,10], others do not [11]. None of these studies used total hospital days as an outcome, which better reflect morbidity and cost, and only one used an HIV-negative control group [12]. Few articles examine nursing home use for PWH. Nursing home use is important both because nursing home days are expensive, and because nursing home residents lose their independence and their connection with critical community supports. Four recent studies have examined nursing home utilization for PWH, raising concerns about the quality of care they receive [13–16]. There are no studies that we are aware of that examine the relationship between aging, comorbid conditions and nursing home days, and only one, that uses HIV-negative comparators [14].
We, therefore, studied Medicaid recipients from 14 states between 2001 and 2012, focusing on the extra hospital and nursing home days per month (DPM) for PWH compared with PWoH. We had two main questions. First, are there differences in the pattern of excess hospital and nursing home DPM for PWH compared with PWoH with increasing age? Assuming that hospital DPM is an indicator of acute illness and that nursing home DPM is an indicator of functional dependence and frailty, then differences that we find in these patterns would suggest that acute illness processes and functional dependence are determined by different factors in PWH than in PWoH. Second, how do hospital DPM and nursing home DPM differ among persons with different chronic conditions? Knowledge of variations in the impact of chronic conditions may help prioritize clinical care.
MethodsThis study was approved by the Brown University institutional review board. Because the study used secondary data, waiver of informed consent was granted.
Data sourcesOur primary data source was the Medicaid Analytic eXtract (MAX) Files for 2001–2012 from 14 states (California, Florida, Georgia, Illinois, Louisiana, Massachusetts, Maryland, North Carolina, New Jersey, New York, Ohio, Pennsylvania, Texas, Virginia). These states account for 75% of HIV cases in the United States [17]. We used the Minimum Data Set (MDS) to identify nursing home use.
Study sampleOur analytic sample included Medicaid recipients aged 20–64 with HIV in the 14 states from 2003–2012. The analytic sample starts in 2003 instead of 2001, and age 20 instead of age 18, because we allow a 24-month look-back period to determine comorbid conditions. We classified individuals as having HIV as previously described [18]. Medicaid recipients in the United States often have enrollment gaps over time, because they lose eligibility (e.g. if their income rises sufficiently that they are no longer eligible, or if a woman delivers a child and 60 days after the delivery loses her pregnancy-related eligibility). To leverage these longitudinal data, we used the person-month as our unit of our analysis. Months when an individual was enrolled in Medicaid managed care in Ohio and Pennsylvania were excluded because of incomplete claims. We excluded months of dual enrolled in Medicaid and Medicare because inpatient stays for duals are in Medicare claims. Individuals were followed to the final Medicaid enrolled month or to 31 December 2012. Because of enrollment discontinuity, an individual may have multiple follow-up episodes. In such cases, the follow-up episodes started after 24 months of Medicaid enrollment. The sample included 270 074 unique PWH, representing 14.3 million person-months. A flow chat describing the construction of the study sample is shown in Appendix, Figure 1, https://links.lww.com/QAD/D136. For each PWH, we identified three PWoH who had same start of follow-up year, age, gender, and five-digit residential zip code. This control group had 851 198 unique persons representing 35.4 million person-months.
OutcomesOur main outcomes were hospital days per month or DPM (from inpatient claims) and nursing home DPM (from the MDS).
Explanatory variablesOur main independent variable was age (measured in years), derived from the date of birth in the personal summary file rounded to years at each person-month. Gender (male or female) was also determined using the personal summary file.
Comorbid condition group selection was based on a literature review that examined the prevalence and clinical impact of different conditions. By construction, an individual could gain or lose a diagnosis during different spans of observation, depending on whether they met criteria during the prior 24 months. Using a previously described approach [19], we included individual comorbidities categorized into six broad condition categories: cardiovascular disease, diabetes, liver disease, mental health conditions, pulmonary disease, and renal disease (Table 1).
Table 1 - Study population descriptive statistics for Medicaid enrollees with vs. without HIV. HIV− HIV+ Ratio Person months of observation 35 394 298 14 281 338 Female (%) 55.80 56.20 1.01 Age, mean 43.8 43.9 1.00 MCO enrolment (%) 52.60 39.70 0.75 Race/ethnicity White, non-Hispanic (%) 35.90 18.60 0.52 Black, non-Hispanic (%) 27.20 48.60 1.79 Hispanic (%) 22.00 23.00 1.05 Other (%) 14.90 9.70 0.65 Cardiovascular disease (%) 39.40 43.10 1.09 Hypertension (%) 28.80 31.70 1.10 Hyperlipidemia (%) 21.80 19.00 0.87 Coronary disease and myocardial infraction (%) 6.20 7.00 1.13 Congestive heart failure (%) 2.90 4.30 1.48 Stroke (%) 2.90 4.30 1.48 Peripheral vascular disease (%) 2.40 3.10 1.29 Diabetes (insulin and noninsulin dependent) (%) 15.00 15.10 1.01 Liver disease (%) 3.80 20.90 5.50 Hepatitis B (%) 0.60 5.60 9.33 Hepatitis C (%) 2.70 15.70 5.81 Decompensated liver disease (%) 0.60 1.70 2.83 End-stage liver disease (%) 1.00 2.90 2.90 Pulmonary disease (%) 16.30 26.90 1.65 Alveolitis (%) 0.00 0.00 0.01 Asthma (%) 9.40 17.20 1.83 Bronchiectasis (%) 0.10 0.20 2.00 COPD (%) 8.90 13.90 1.56 Fibrotic lung disease (%) 0.30 0.70 2.33 Pulmonary hypertension (%) 0.40 0.70 1.75 Pneumoconiosis (%) 0.00 0.00 0.01 Mental health condition (%) 22.40 35.60 1.59 Bipolar disorder (%) 5.40 10.50 1.94 Major depression (%) 7.20 13.30 1.85 Other depression (%) 10.30 18.80 1.83 Other psychiatric disorder (%) 3.10 7.20 2.32 PTSD (%) 1.00 1.70 1.70 Schizophrenia (%) 4.90 7.10 1.45 Schizoaffective disorder (%) 3.30 5.80 1.76 Renal insufficiency (%) 2.60 6.00 2.31 Cancer (%) 2.90 4.10 1.41 Substance use Alcohol (%) 17.10 37.40 2.19 Other drug (%) 18.70 47.00 2.51 Tobacco (%) 18.40 33.40 1.82 Utilization outcomes Hospital days per person per month (mean) 0.114 0.322 2.82 Nursing home days per person per month (mean) 0.259 0.57 2.20MCO is managed care organization; COPD is chronic obstructive pulmonary disease; PTSD is posttraumatic stress disorder; difference in statistics for all characteristics between HIV− and HIV+ enrollees are statistically significant at 1% level of significance.
Covariates also included any cancer and three substance use disorders (alcohol, tobacco, and drug use). Because it is not possible to identify start and end dates of substance use disorders using claims data, we defined these variables as any history of the disorder. We also examined several characteristics that did not vary by month, including sex and race/ethnicity. Finally, we included managed care organization enrollment, which varied by month.
Statistical methodsWe used summary statistics to describe key characteristics of PWH and the matched PWoH aggregated across all months of observation. We then created plots to show how hospital and nursing home DPM varied by age, and how these two outcomes varied with the presence of each of six clinical condition groups. Because pregnancy makes low-income women eligible for coverage, Medicaid coverage varies by gender, so we show results separately for male and female individuals (Appendix, Figure 2, https://links.lww.com/QAD/D136).
As our objective was to assess how HIV status affected healthcare use by age, we fit linear regression models of our outcomes (inpatient and nursing home DPM) onto age categories (44 indicators for individual years of age 21 through 64, with age 20 as the reference category), HIV+ indicator, and multiplicative interactions of age categories and the HIV+ indicator. Other variables in these regressions were indicators for comorbid condition groups, race/ethnicity, MCO enrollment status, year fixed effects, and matched pair fixed effects. Binary indicators for each year of age allow nonlinear effects of age. Pair fixed effects account for all observable and unobservable time-invariant pair characteristics including neighborhood and state policy effects. We estimated the models separately for male and female Medicaid recipients. We graphed the estimated interaction term coefficients of age and HIV status, along with their corresponding 95% confidence intervals. We used a two-way plot with age on x-axis and estimated effects on the y-axis. As a sensitivity analysis, we repeated the process described above, but used dichotomous outcomes of ‘any hospital days’ or ‘any nursing home days’ and logistic rather than linear regression.
To estimate the additional effects of each of the six chronic condition groups on PWH relative to PWoH on the outcomes, we estimated the regressions including an HIV indicator and indicators for each chronic condition group, and multiplicative interactions of HIV dummy and indicators of chronic condition groups, along with age and the same variables described above. We plotted the interaction coefficients representing the added effects of comorbidities on PWH relative to PWoH.
We used a linear (ordinary least square) model instead of a nonlinear model (such as Poisson) for several reasons. First, in this study, we followed persons over months (mean, 42 months) when enrolled in Medicaid. The units for each of the outcomes are days per person per month, which do not have the same properties as typical count variables; there is serial correlation within a month and between/across months. Second, given this data structure, the appropriate model needs to include pair fixed effects. Estimating Poisson models with 270 074 fixed effects would require exceptional computational power. Third, we present our results in terms of additional care use per person per month associated with comorbidities, which can be obtained directly from linear regression. However, we recognize that our outcomes do not have normal distribution, and this rationalizes our sensitivity analyses using dichotomous outcome applying fixed effects linear probability models. All analyses were conducted in Stata Version 17 (StataCorp, Texas, USA).
Results Sample characteristicsAmong PWH, 54% were female individuals, 49% were non-Hispanic Black, and 23% were Hispanic (Table 1). We observed more than one follow-up episode in 33 511 (11.7%) individuals. Matched PWoH had a smaller percentage of Black recipients and higher rates of MCO enrollment, compared with PWH. The matched PWoH had a similar prevalence of cardiovascular disease and diabetes and a lower prevalence of liver disease, mental health conditions, pulmonary disease, and renal disease.
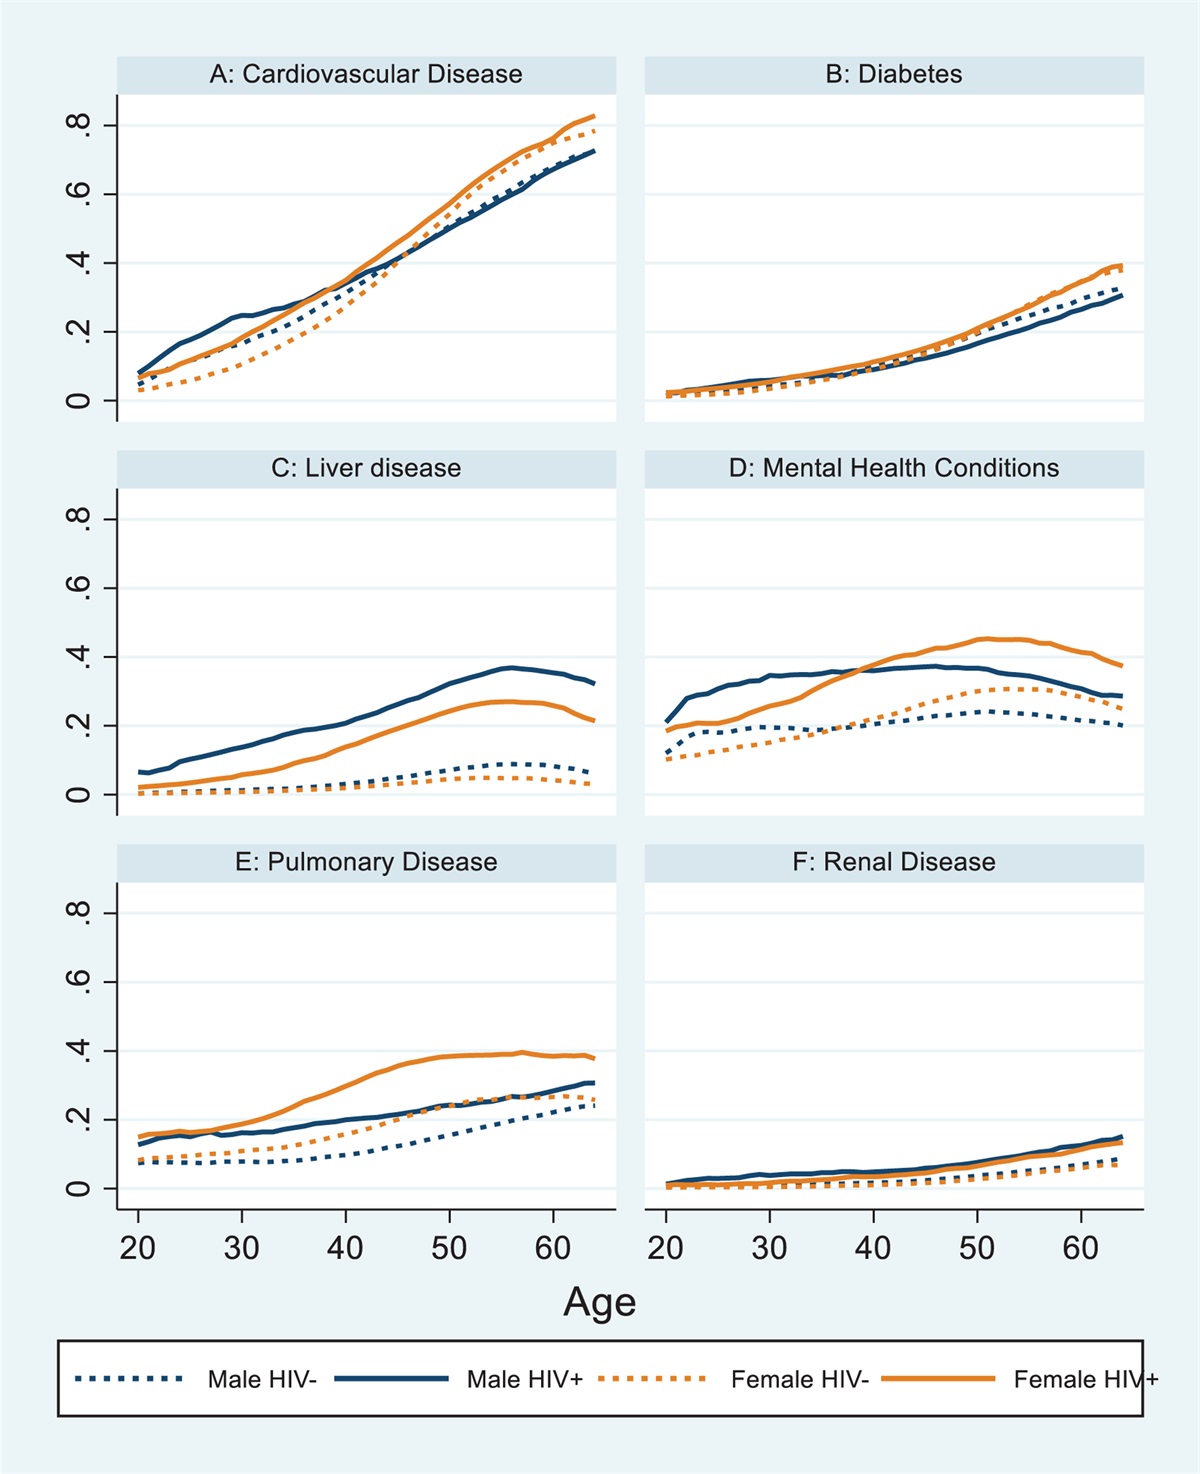
Unadjusted prevalence of comorbid conditionsFor cardiovascular disease, diabetes, and renal disease, prevalence steadily increased with age for each of the four groups (male, PWH and PWoH; female, PWH and PWoH, Fig. 1). For pulmonary disease, there was a steady increase by age for both groups of men, but for both groups of women with pulmonary disease, prevalence flattened at about 60 years of age. For liver disease and mental health conditions, there was a prevalence peak at about 55 years of age, and then a slight decrease in all groups. Ratios of PWH to PWoH by age group, gender, and condition are shown in Appendix, Table 1, https://links.lww.com/QAD/D136.
 Fig. 1:
 Unadjusted proportion of individuals with each chronic condition group by HIV status and gender.
Unadjusted hospital and nursing home days per monthFigure 2 shows hospital and nursing home DPM for PWH and PWoH, by age and gender. Both types of healthcare use increased with age in all of the four groups. Utilization was higher for PWH than for PWoH for both male and female individuals at all ages. Ratios of PWH to PWoH by age group, gender, and condition are shown in Appendix, Table 2, https://links.lww.com/QAD/D136.
 Fig. 2:
 Unadjusted average utilization by age based on HIV status and gender.
Adjusted, net effects of HIV on hospital and nursing home days per monthFigure 3, panel a, shows that the number of extra or incremental hospital days for PWH, compared with persons without HIV, is flat from age 30 to age 60 for both men (0.07 extra days) and women (0.03 extra days). The curve for male individuals is generally above the curve for female individuals.
 Fig. 3:
 Relationship between aging and utilization for persons with HIV relative to persons without HIV.
Figure 3, panel b, shows that the curve for extra or incremental nursing home DPM for female individuals with HIV rises steadily from age 30 (0 extra days) to age 55 (0.35 extra days), falls slightly from age 55 to 60 years, and then is flat from age 60 to age 65 years. For men, the curve rises steadily from age 30 (0 extra days) to age 60 (0.4 extra days), and then falls slightly from age 60 to age 65 years. The curves for male and female individuals overlap until age 55 years, and the curve for men is higher than the curve for female individuals thereafter. For PWH, at age 55, this represents an 81% increase in the nursing home DPM for male individuals, and a 110% increase for female individuals, compared PWoH (Appendix, Figures 3 and 4, https://links.lww.com/QAD/D136). The sensitivity analysis using logistic regression produced similar results and is shown in Appendix Figure 5, https://links.lww.com/QAD/D136.
Adjusted, net effects of HIV on hospital and nursing home days per month by comorbidity groupsMost of the bars in Fig. 4 are above zero, indicating that PWH generally have more hospital and nursing home DPM than PWoH. Not surprisingly given the data in Fig. 3, the number of extra nursing home DPM are generally greater than the number of hospital DPM. For male individuals with HIV, the number of nursing home DPM was about 20% higher for mental health conditions and renal disease, and 25–35% higher for cardiovascular disease and diabetes compared with PWoH. For female individuals, the greatest relative increases in nursing home DPM were seen in PWH with diabetes (25%) and renal disease (30%). The sensitivity analysis using logistic regression produced similar results and is shown in Appendix Figure 6, https://links.lww.com/QAD/D136.
 Fig. 4:
 Adjusted excess utilization of inpatient (panel a) and nursing home (panel b) days per month for persons with HIV relative to persons without HIV. Panel a: inpatient days per person per month.
DiscussionThis study has two main findings. First, we found small excesses in the number of hospital DPM for PWH compared with PWoH. In contrast, excess nursing home DPM for PWH compared with PWoH rose in a linear fashion with age, peaking at 0.35 extra days for women (age 55) and 0.4 extra days for men (age 60). Second, HIV-associated excess nursing home DPM were greatest for persons with cardiovascular disease, diabetes, mental health conditions, and renal disease.
Considerable prior work using the VACS Index has shown that physiologic frailty is associated with increased rates of hospitalization, both in a mostly male Veterans Administration population [3,4], and in the all-female WIHS cohort [20]. We view hospitalization as reflecting acute and acute-on-chronic conditions, and find a small effect of HIV, for both male and female individuals, that does not change with age. This is likely explained by the powerful impact of antiretroviral therapy (ART) on acute illness for PWH [21].
Although some recent studies have focused on PWH in nursing homes [13–16], none have looked at total nursing home days as a measure of utilization or examined how nursing home days change with age. Clearly the factors that determine the relationship between age and hospital days differ from those determining nursing home days. The need for nursing home care, whether postacute or long-term custodial care, is related on the one hand to functional status, and on the other hand to the availability and amount of home supports and financial resources. PWH with Medicaid may on average have less support than PWoH. We cannot eliminate this possibility, but, for reasons explained below, we think that excess frailty among PWH is a more likely explanation of our findings.
Frailty occurs when aging and chronic conditions, along with polypharmacy and adverse social factors often seen with aging, combine to produce increased vulnerability to stresses [22]. There are different ways to conceptualize and measure frailty [23] but increased vulnerability to stresses is at the core of every measurement. Frailty occurs at earlier ages in PWH than in PWoH [4,6,7], but measures of frailty have been less frequently applied to understanding healthcare utilization [3,20,24]. The fact that nursing home days have a strong relationship to chronological age in our data support the concept that aging with HIV is associated with accentuated frailty. Though there have been attempts to measure frailty using Medicare claims data [25], frailty may be better assessed using a clinical and laboratory measures.[3] For HIV clinicians, these data suggest that careful attention to frailty in PWH as they age is warranted, both to reduce potentially unnecessary nursing home days, and to reduce accompanying healthcare costs.
Our analyses of hospital days and nursing home days for the six chronic condition groups that we examined broadly mirror the finding described above, but with a few, interesting exceptions. For cardiovascular disease, diabetes, and mental health conditions, nursing home DPM are clearly greater than hospital DPM. For renal disease, there are few if any differences, and for pulmonary disease, there are more hospital than nursing home days. This pattern of utilization has several implications. First, it suggests that, among these Medicaid recipients, excess risk of specific conditions may be driving excess nursing home DPM rather than differences in social or home supports. For example, there is no reason to believe that after adjustment for other factors, people with cardiovascular disease or diabetes would have less social support than those with pulmonary disease.
Second, this pattern of utilization suggests that there is some combination of biological, clinical and perhaps social factors at play, perhaps related to frailty, that differ by chronic condition group. Because claims data cannot be used to explore the kinds of biological, clinical and social factors, these data should stimulate efforts to understand these effects using other data sources. The application of principles of geroscience to HIV provides tremendous opportunities to do this [26].
This study has several limitations. First, we used data from claims, rather than medical records, to identify comorbid conditions. Studies that compare diagnoses in claims with those in medical records generally find acceptable accuracy [27]. To mitigate against the possibility of undercoding of diagnoses, we required 24 months of continuous eligibility prior to each month of study eligibility. Second, we did not have access to clinical or laboratory data such as HIV viral loads, and such data can be helpful in understanding illness severity and treatment effectiveness. Third, these data are now more than 10 years old. It is possible that the recommendations for universal treatment with ART that were made in 2013 [28], or changes in ART such as greater use of integrase strand inhibitor-based regimens, may change these relationships. We did conduct sensitivity analyses using only PWH that adjusted for ART use (data not shown), and our findings related to hospital and nursing home use did not change. Nonetheless, it will be important to repeat these analyses in other US populations, including in more contemporary cohorts and in persons with Medicare. Finally, we do not know if these findings are generalizable to other states, other payers in the United States (e.g. commercial payers or Medicare), or other countries.
Limitations notwithstanding, these analyses are unique for several reasons. First, we examined total hospital and nursing home days, not admission rates, which allows a better understanding of patient impact and cost. Second, we implemented a comprehensive matching strategy that permits us to compare the utilization experiences of PWH to PWoH. Third, because the sample came from the 14 states in the United States with the greatest number of HIV cases (approximately 75% of all HIV in the United States), we believe our findings have strong generalizability.
In conclusion, there are small increases in the number of hospital DPM for PWH compared with PWoH, and hospital days do not increase with age. In sharp contrast, between age 30 and 55 (women) or 60 (men), nursing home days rise in a linear fashion for PWH compared with PWoH. For PWH at age 55 years, this represents an 81% increase in the nursing home DPM for men, and a 110% increase for women, compared with PWoH. This pattern of age-related disability (nursing home days) may be related to HIV-associated frailty, and efforts to understand and interrupt this pattern are needed. The key utilization outcomes that we studied here can be important tools in understanding how HIV and aging interact. The differences that we observed by clinical condition group may represent opportunities both for targeted mechanistic research and clinical interventions.
AcknowledgementsI.B.W. and M.R. were responsible for the study conception and design. L.Y. and M.R. analyzed the data. I.B.W., M.B.C., Y.L., T.I.S., A.J., and M.R. were involved in the interpretation of the data. I.B.W., M.B.C., Y.L., T.I.S., A.J., and M.R. participated in the revision of the manuscript for important intellectual content and final approval of the manuscript. I.B.W. and M.R. were responsible for obtaining the funding.
This work was supported by the National Institutes of Health: R01MH102202-01A1, R01MH109394-01A1, P30AI042853, and U54GM115677.
Data availability statement: data use agreements with the Center for Medicare and Medicaid Services prevent the sharing of data. However, the code used for the analyses can be found at: https://doi.org/10.26300/vs12-v537.
Conflicts of interestThere are no conflicts of interests.
References 1. Gallant J, Hsue PY, Shreay S, Meyer N. Comorbidities among US patients with prevalent HIV infection—a trend analysis. J Infect Dis 2017; 216:1525–1533. 2. Nanditha NGA, Paiero A, Tafessu HM, St-Jean M, McLinden T, Justice AC, et al. Excess burden of age-associated comorbidities among people living with HIV in British Columbia, Canada: a population-based cohort study. BMJ Open 2021; 11:e041734. 3. Akgün KM, Tate JP, Crothers K, Crystal S, Leaf DA, Womack J, et al. An adapted frailty-related phenotype and the VACS index as predictors of hospitalization and mortality in HIV-infected and uninfected individuals. J Acquir Immune Defic Syndr 19992014; 67:397–404. 4. Althoff KN, Jacobson LP, Cranston RD, Detels R, Phair JP, Li X, Margolick JB. Multicenter AIDS Cohort Study (MACS). Age, comorbidities, and AIDS predict a frailty phenotype in men who have sex with men. J Gerontol A Biomed Sci Med Sci 2013; 69:189–198. 5. Desquilbet L, Jacobson LP, Fried LP, Phair JP, Jamieson BD, Holloway M, Margolick JB. A frailty-related phenotype before HAART initiation as an independent risk factor for AIDS or death after HAART among HIV-infected men. J Gerontol A Biol Sci Med Sci 2011; 66:1030–1038. 6. Desquilbet L, Jacobson LP, Fried LP, Phair JP, Jamieson BD, Holloway M, Margolick JB. Multicenter AIDS Cohort Study. HIV-1 infection is associated with an earlier occurrence of a phenotype related to frailty. J Gerontol A Biol Sci Med Sci 2007; 62:1279–1286. 7. Gustafson D, Shi Q, Thurn M, Holman S, Minkoff H, Cohen M, et al. Frailty and constellations of factors in aging HIV-infected and uninfected women-the women's interagency HIV study. J Frailty Aging 2016; 5:43. 8. MACPAC. Medicaid Spending. 9. Davy-Mendez T, Napravnik S, Wohl DA, Durr AL, Zakharova O, Farel CE, Eron JJ. Hospitalization rates and outcomes among persons living with human immunodeficiency virus in the Southeastern United States, 1996-2016. Clin Infect Dis 2019; 71:1616–1623. 10. Fleming J, Berry SA, Moore RD, Nijhawan A, Somboonwit C, Cheever L, et al. US Hospitalization rates and reasons stratified by age among persons with HIV 2014–15. AIDS care 2020; 32:1353–1362. 11. Sax PE, Meyers JL, Mugavero M, Davis KL. Adherence to antiretroviral treatment and correlation with risk of hospitalization among commercially insured HIV patients in the United States. PLoS one 2012; 7:e31591. 12. Navon L. Hospitalization trends and comorbidities among people with HIV/AIDS compared with the overall hospitalized population, Illinois, 2008-2014. Public Health Rep 2018; 133:442–451. 13. Meyers DJ, Wilson IB, Lee Y, Cai S, Miller SC, Rahman M. The quality of nursing homes that serve patients with human immunodeficiency virus. Journal of the American Geriatrics Society 2019; 67:2615–2621. 14. Meyers DJ, Wilson IB, Lee Y, Rahman M. Understanding the relationship between nursing home experience with human immunodeficiency virus and patient outcomes. Med Care 2021; 59:46–52. 15. Miller SC, Cai S, Daiello LA, Shireman TI, Wilson IB. Nursing home residents by human immunodeficiency virus status: characteristics, dementia diagnoses, and antipsychotic use. J Am Geriatr Soc 2019; 6:1353–1360. 16. Olivieri-Mui B, McGuire J, Cahill S, Griffith J, Briesacher B. People living with HIV in US nursing homes in the fourth decade of the epidemic. J Assoc Nurs AIDS Care 2019; 30:20. 17. Centers for Disease Control and Prevention. HIV Surveillance Report, 2010. March. 2012. 18. Cole MB, Galárraga O, Rahman M, Wilson IB. Trends in comorbid conditions among medicaid enrollees with HIV. Open Forum Infect Dis 2019; 6:ofz124. 19. Goulet JL, Fultz SL, McGinnis KA, Justice AC. Relative prevalence of comorbidities and treatment contraindications in HIV-mono-infected and HIV/HCV-co-infected veterans. AIDS 2005; 19: (Suppl 3): S99–S105. 20. Hotton AL, Weber KM, Hershow RC, Anastos K, Bacchetti P, Golub ET, et al. Prevalence and predictors of hospitalizations among HIV-infected and at-risk HIV-uninfected women. J Acquir Immune Defic Syndr 2017; 75:e27–e35. 21. Palella FJ Jr, Delaney KM, Moorman AC, Loveless MO, Fuhrer J, Satten GA, et al. Declining morbidity and mortality among patients with advanced human immunodeficiency virus infection. New Engl J Med 1998; 338:853–860. 22. Justice AC. HIV and aging: time for a new paradigm. Curr HIV/AIDS Rep 2010; 7:69–76. 23. Clegg A, Young J, Iliffe S, Rikkert MO, Rockwood K. Frailty in elderly people. Lancet 2013; 381:752–762. 24. Akgün KM, Gordon K, Pisani M, Fried T, McGinnis KA, Tate JP, et al. Risk factors for hospitalization and medical intensive care unit (MICU) admission among HIV infected Veterans. J Acquir Immune Defic Syndr 2013; 62:52. 25. Kim DH, Schneeweiss S, Glynn RJ, Lipsitz LA, Rockwood K, Avorn J. Measuring frailty in Medicare data: development and validation of a claims-based frailty index. J Gerontol Series A Biol Sci Med Sci 2018; 73:980–987. 26. Montano M, Oursler KK, Xu K, Sun YV, Marconi VC. Biological ageing with HIV infection: evaluating the geroscience hypothesis. Lancet Healthy Longev 2022; 3:e194–e205. 27. Justice AC, Lasky E, McGinnis KA, Skanderson M, Conigliaro J, Fultz SL, et al. Medical disease and alcohol use among veterans with human immunodeficiency infection - A comparison of disease measurement strategies. Med Care 2006; 44:S52–S60. 28. Panel on Antiretroviral. Guidelines for Adults and Adolescents. Guidelines for the use of antiretroviral agents in HIV-1-infected adults and adolescents. Department of Health and Human Services. Available at: https://clinicalinfo.hiv.gov/en/guidelines/archived-guidelines/adult-and-adolescent-guidelines. [Accessed 9 April 2022]
留言 (0)