
記住我


Maternal thyroid hormones (THs) - L-3,5,3’,5’-tetraiodothyronine (T4) and L-3,5,3’-triiodothyronine (T3) - play pivotal roles in fetal growth and development (1, 2). The developing fetus completely relies on maternal THs until approximately the 16th to 20th week of gestation, when its own thyroid gland matures and commences hormone synthesis (3, 4). This dependency arises from maternal thyroid adaptations in pregnancy, which ensure adequate TH levels to fulfill the mother and fetal metabolic demands (3, 4). The transplacental transfer of T4 from the maternal circulation to the fetus is a particular critical event, given its greater propensity to cross the placental barrier compared to the biologically active T3. This facilitates the direct utilization of T4 by fetal tissues or its conversion into T3 (5, 6). The increased maternal thyroid function in pregnancy also raises the gland susceptibility to dysfunction (7). In this context, gestational hypothyroxinemia (HTX) is an asymptomatic and highly frequent condition in early pregnancy, clinically defined by a reduction in T4 (below the 5th percentile), while maintaining normal levels of T3 and thyroid-stimulating hormone (TSH) in blood (8–10). Gestational HTX has been an overlooked condition given its asymptomatic nature, nonetheless, is associated with neurocognitive impairments in the offspring, including lower intelligence quotient (IQ), auditory and motor difficulties, as well as an increased risk of attention deficit hyperactivity disorder (ADHD) in children (11–16). Interestingly, retrospective studies in humans have reported that 5-to-8-year-old offspring gestated under HTX in the first trimester of pregnancy have a 2-to-4-fold increased likelihood of having autistic traits in behavior (17, 18).
Autism spectrum disorder (ASD) is defined as a sex-biased neurodevelopmental disorder (referring to gender-dependent differences in the occurrence or impact of ASD), characterized by social impairments and restricted repetitive patterns of interest and behavior (19). ASD is a heterogenous condition displaying a broad spectrum of cognitive abilities that often coexists with a spectrum of comorbidities, including epilepsy, feeding difficulties, constipation, attention-deficit hyperactivity disorder (ADHD), anxiety, and depression (19). The World Health Organization (WHO) recognizes ASD as a widespread condition, affecting approximately 1% of the global population (20). Over the past two decades, there has been a notable increase in its prevalence, shifting from 1 in 150 to 1 in 36 in the US. This rise is largely attributed to heightened awareness and advancements in early diagnosis methodologies (20). However, epidemiological and scientific studies indicate that ASD results from intricate interactions involving both genetic predispositions and environmental influences (21–24). In this context, exposure to environmental factors during pregnancy has been identified as potential contributors to the prenatal induction of ASD, including environmental pollution (25–27), the use of neuropsychiatric drugs or teratogens (28, 29), parental aging (30), and maternal inflammation (31). In addition to known thyroid disruptors such as perchlorate and pesticides, it has been demonstrated that these environmental factors that can also impair the adequate functioning of the maternal thyroid gland during pregnancy are associated with the emergence of ASD-like phenotypes in the offspring (32–34).
Mouse models have been essential in studying ASD, reflecting some aspects of the disorder found in humans (35). These models are typically assessed based on behaviors like repetitive actions, anxiety, and social interaction (36). Despite the valuable contributions of these models in uncovering the biological mechanisms of autism, inconsistencies in behaviors are frequently noted, reflecting the variations observed in humans (37–39).
Apart from the behavioral aspect, it has been reported that the expression of synaptic scaffolding proteins of glutamatergic neurons such as Homer protein homolog 1 (HOMER1) and Neuroligin 3 (NLGN3) are altered in the prefrontal cortex (PFC) and hippocampus of animal models with ASD like phenotype (40, 41). This is the case described in adult rats prenatally exposed to valproic acid (VPA) that also exhibit ASD-like behaviors (42). Moreover, both point mutations and altered expression of NLGN3 in mice have been shown to induce defective synaptic pruning and impaired hippocampal circuit-specific organization underlying the ASD-like phenotype (43, 44).
ASD-like alterations extend beyond the central nervous system. Immune dysregulation has been observed in both adult ASD patients and ASD-like rodent models assessed during adulthood (45, 46). Increased serum concentration of proinflammatory cytokines like interleukin (IL)-1β, IL-6, IL-17A, and TNF-α have been detected and are hypothesized to contribute to ASD pathophysiology. Consistently, anti-inflammatory cytokines like IL-10 and TGF-β1 are typically lower in ASD patients (45, 46). Additionally, elevated concentration of IL-17A in specific brain regions, which is considered as a neuroinflammatory-like trait, is associated with alterations in social cognition and appears to be a signature outcome of ASD physiopathology according to animal models displaying ASD-like behaviors (47). Moreover, ASD-related inflammatory profile can be accompanied by persistent dysregulation of both innate and adaptive immune response, as indicated by murine models. For instance, both the inbred mouse strain BTBR T+Itpr3tf/J (murine model of idiopathic ASD) and the adult mice gestated under maternal inflammation activation (MIA) model display increased population of macrophages, natural killers (NKs), and T cell populations in the spleen as compared to wild-type C57BL/6 mice (48–50).
Despite human retrospective studies associating gestational HTX with ASD behavioral traits in the offspring, this notion has not been validated yet, at the same time that ASD-like cellular and molecular alterations have not been evaluated in this offspring. Therefore, by using a mouse model, this study aimed to establish a causal relationship between gestational HTX and ASD-like alterations in behavior, inflammatory biomarkers, and levels of specific glutamatergic proteins in the offspring of both sexes.
2 Materials and methods2.1 AnimalsC57BL/6 mice obtained from The Jackson Laboratory, Bar Harbor, ME, USA were housed in cages with water, bedding, and chow (Prolab, RMH 3000) under standard conditions of a 12-hour light/dark cycle (lights on at 8:00 AM) and a temperature of 22°C at the animal facility of the Facultad de Ciencias de la Vida, Universidad Andrés Bello (Santiago, Chile). All experimental procedures and care were performed according to current regulations and guidelines of the Animal Welfare Committee of the Facultad de Ciencias de la Vida (Bioethics approval certificate number 012/2021) and Agencia Nacional de Investigación y Desarrollo (ANID). Daily supervision of mice was performed by a veterinarian. Mice were euthanized by inhaling 5% isoflurane/O2 according to AVMA guidelines (51).
2.2 Induction of gestational hypothyroxinemiaGestational HTX was induced in pregnant mice according to previous reports (52–55). Six- to eight-week-old C57BL/6 mice were mated in a proportion of 2 females and 1 male. The next day, a vaginal smear was collected and analyzed to search for spermatozoa. Mice with a positive smear were considered pregnant, and that day was referred to as embryonic day 1 (E1). Each dam was individually placed in a cage. On E10, pregnant mice were randomly distributed into three groups (N = 7 pregnant mice per group). The first group received regular tap water during the entire pregnancy (untreated dams); therefore, gestation was conducted under euthyroid conditions. The second group received 0.025% w/v of 2-mercapto-1-methylimidazole (methimazole, MMI) (M8506, Sigma-Aldrich, USA) in the drinking water from E10 to E14 (MMI-treated dams). To reverse the MMI-induced phenotypes, the third group was treated with 0.025% w/v MMI along with a daily subcutaneous injection of 25 μg/kg of T4 dissolved in PBS from E10 to E14 (MMI+T4-treated dams) (52–55). This treatment aimed to demonstrate that the observed effects induced by MMI are due to maternal T4 reduction and not a side effect of MMI. Untreated and MMI-treated dams did not receive a vehicle intraperitoneal injection to avoid the related stress of a daily injection. Both the MMI and MMI+T4 treatments were administered daily from E10 to E14 at 9:00 AM. The water for untreated dams was also renewed during E10 to E14. The bottles containing MMI solution were prepared daily with fresh tap water and protected from light. Consequently, the experimental groups of this work were the respective progenies named after the mother’s treatment: Control-offspring, HTX-offspring, and HTX+T4-offspring.
2.3 Determination of thyroid hormonesTo verify the correct induction of gestational HTX, blood samples were collected from the facial vein of each pregnant mouse on E14 and total (t)THs and TSH were quantified. Additionally, a blood sample was also obtained from each adult mouse on postnatal day 50 (P50) to evaluate thyroid function. Serum was separated from the blood samples by centrifugation at 1,000 xg for 15 min at 4°C. Levels of tT3 and TSH were quantified by sandwich ELISA using mouse CUSABIO® ELISA kits (catalog N°E05086m and N°E05116m, respectively) following the manufacturer’s instructions. Concurrently, tT4 serum levels were determined by chemiluminescence in an external certified veterinary laboratory (LQCE, Santiago de Chile). After quantification, the tT4 range for MMI-treated dams was established at [0.1 – 1.9] (μg/dL), whereas the range of tT4 in the untreated dams was [2.2 – 4.5] (μg/dL). Since the administration of tT4 during MMI treatment is expected to restore their levels and reverse the induced phenotype, the accepted tT4 range in the MMI+T4-treated dams was set equal to that of the untreated group ([2.2 – 4.5] (μg/dL)) (52–55).
2.4 Behavioral testingControl, HTX, and HTX+T4 offspring were weaned on P28. To mitigate the impact of the “litter effect”, experimental groups were formed by randomly selecting 2-3 mice of each sex from each litter. Consequently, each group comprised 30 mice, conformed by 15 females and 15 males. Mice of the same sex were housed together in cages (4-5 mice per cage) from weaning until behavioral assessment. Behavioral testing was conducted during adulthood (from P55 to P64), specifically during the dark phase of the circadian cycle (between 9.00 AM and 2.00 PM), consistent with a previous report of behavioral assessment in mice (56). The sequence of behavioral testing was arranged as follows: marble burying (MB) on P55, elevated plus maze (EPM) on P56, tube dominance test from P57 to P63 (considering training and confrontation steps), and three-chamber social preference test on P64. The behavioral performance of each mouse in the EPM, tube dominance, and three-chamber tests was conducted under 60 decibels (dB) of white noise and recorded using an FHD 1080p/30 fps camera. Data were manually scored and analyzed by three trained investigators blinded to each experimental group.
2.5 Marble burying testMB was performed to analyze repetitive/persistent behavior (57, 58). Each mouse was placed inside the testing cage (arena size: 24 cm x 17.2 cm, wood chips bedding depth: 5 cm) containing 12 marbles arranged in four columns of three marbles at equidistant distances. After 30 min of exploration, each mouse was returned to its respective cage. The number of buried marbles was counted, considering them buried when 2/3 of their volume was concealed within the wood chips.
2.6 Elevated plus maze testThe elevated plus maze (EPM) test was employed to analyze anxious-like behavior (59, 60). Each mouse was placed in the center of a suspended cross-shaped maze consisting of two open and two closed arms (25 cm long x 7 cm wide x 24.5 cm high walls of closed arms). After 5 minutes of exploration, each mouse was returned to its respective cage. The number of entries into both the open and closed arms, as well as the time spent in each arm, were recorded. An entrance was only considered valid when all four paws of the mouse crossed the boundary of the maze center into an open or closed arm.
2.7 Tube dominance testThe tube dominance test was used to assess aggressive social interaction (61). A hollowed transparent Plexiglas tube measuring 30 cm in length and 2.5 cm in diameter was used. Two mice from distinct experimental group were introduced to the tube from opposite directions. The critical point occurs when both mice meet in the middle of the tube, and one must retreat to exit, thereby revealing a dominant or subordinate status based on the species hierarchy theory. The training step was conducted over three consecutive days (from P57 to P59) with the goal of teaching each mouse that crossing the tube is the only way to exit without backing up. Subsequently, the testing stage took place over four consecutive days (from P60 to P63). During the confrontation stage, mice from the Control-offspring were paired with those from the HTX-offspring group, the HTX-offspring mice were paired with the HTX+T4-offspring mice, and the Control-offspring mice were paired with the HTX+T4-offspring mice in a pairwise fashion. Confrontations were conducted between mice of the same sex, with pairs randomly chosen and confronted three times per day, rotating the initial entry position to minimize bias. After each confrontation, mice were returned to their respective cages to reduce the immediate impact of recent winning or losing. The number of wins for each mouse was recorded, and the total number of wins after four days was used as an indicator of their social status, distinguishing between dominant or subordinate.
2.8 Three-chamber social preference testThe three-chamber social preference test was conducted to assess social interaction abilities (62). Mice were first habituated per 1 h to the three-chamber device (a plexiglass box of 102 cm length x 47 cm width x 45 cm height). The three-chambered apparatus consisted of two lateral compartments, each containing one inverted wire cup, along with one empty central compartment. During the pre-test, each mouse was allowed to acclimate to the setup for 10 minutes. Then, the first phase of the test was initiated. An inanimate object was placed under one cup (named “nonsocial stimulus”), while an unfamiliar mouse, matched in terms of age and sex, was placed under the other cup (named “social stimulus”). Each mouse was then positioned in the central compartment of the three-chamber device and allowed to transit between the nonsocial and social compartments for 10 minutes. After that time, mice were returned to their respective cages. In the second phase of the test, the nonsocial stimulus was replaced with a second unfamiliar, age- and sex-matched mouse (also named “de novo stimulus” or “Stranger 2”), while maintaining the first strange mouse now renamed “Stranger 1”. Each mouse was allowed to transit between the Stranger 1 and Stranger 2 compartments for 10 min. The following parameters were registered: the time that each mouse spent in the social, nonsocial, and de novo compartments, the time of direct interaction with the social, nonsocial, and de novo stimulus, and the number of entrances to each compartment. Direct interaction was defined as the presence of the mouse within a diameter of 5 cm around each cup. Similar to the EPM test, an entry was considered when all four legs of the mouse crossed the center of the chamber toward one of the lateral compartments.
2.9 Cytokine determination by sandwich ELISAOn the day following the last behavioral test (P65), the Control, HTX, and HTX+T4 offspring were euthanized to obtain the blood, brain, and spleen. Blood was collected via cardiac puncture and allowed to clot at room temperature for 25-30 minutes. Afterward, serum was isolated by centrifugation (1,000 xg, 15 minutes at 4°C), aliquoted, and stored at -80°C until further analysis. Brains were dissected to isolate the prefrontal cortex (PFC) and hippocampus from the telencephalon, following a standardized mouse brain dissection protocol (63). Both tissues were homogenized in radioimmunoprecipitation assay (RIPA) buffer (50 mM Tris-HCl pH 8.0, 150 mM NaCl, 0.1% SDS, 0.5% sodium deoxycholate, 0.1% Triton X-100) supplemented with phosphatase and protease inhibitors (1 mM Na3VO4, 1 mM NaF, 30 mM sodium pyrophosphate, and 1 mM PMSF). After a 30-minute incubation on ice, the homogenates were centrifuged at 15,000 xg for 15 minutes at 4°C. Total protein quantification from the supernatants was performed using the BCA method with a BSA standard curve (PierceTM, BCA™ 23225). Cytokines were quantified in serum samples of 100 μL and in brain tissue portions (0.5 mg of protein) using sandwich ELISA kits for specific cytokines: IL-1β (BioLegend, 432601), IL-6 (BioLegend, 431307), IL-17A (BioLegend, 432501), IL-10 (BioLegend, 555252), and TNF-α (BioLegend, 430901), following the manufacturer’s instructions. Detection was conducted using a microplate spectrophotometer (Epoch™). Serum cytokine concentrations were normalized to a volume of 100 μL, while cytokine levels in brain tissue portions were normalized to the amount of protein used for these measurements. Results are presented as pg/mL for cytokines in serum and as pg/mg for normalized brain-derived cytokines.
2.10 Detection of NLGN3 and HOMER1 by western blotThe relative expression of the glutamatergic proteins NLGN3 (94 kDa) and HOMER1 (40 kDa) in the PFC and hippocampus was evaluated by western blot. Initially, 20 µg of protein from both tissues was denatured at 95°C for 5 min and then separated on a 12.5% SDS-PAGE gel at 100 V for 120 min. The PageRuler Plus Prestained Protein Ladders of 10-250 kDa (Thermo Scientific™ 26619) and 10-180 kDa (Thermo Scientific™ 26616) were used to estimate the molecular weight of NLGN3 and HOMER1, respectively, and to monitor the progress of electrophoretic separation and electrotransference. Proteins were transferred onto nitrocellulose membranes (Thermo Scientific) for 1 h at 100 V on ice. Thereafter, membranes were blocked with 5% nonfat milk dissolved in Tris buffered saline with 0.1% Tween-20 (TBS-T, pH 7.6) for 1h at R.T with constant shaking. Membranes were separately probed with the primary antibodies anti-NLGN3 (2 μg/mL) (ab192880) and anti-HOMER1 (0,75 μg/mL) (ab211415), both prepared in 5% nonfat milk in TBS-T, overnight at 4°C and constant rotation. Moreover, α-tubulin (1 μg/mL) (ab6046) was used as a loading control. On the next day, membranes were washed (3 times, 5 min each) using TBS-T and then incubated with the secondary antibody anti-rabbit HRP-conjugated (1 μg/mL) (Bethyl A120-101P) in 5% nonfat milk in TBS-T for 1h at R.T and constant rotation. Membranes were washed (3 times, 5 min each) using TBS-T and incubated with ECL detection substrate (Thermo ScientificTM 34076) for 5 min. Bands were visualized and images were recorded using the Alliance Q9 Advanced chemiluminescence and spectral fluorescence imaging system (UVITEC Cambridge). Band intensities were analyzed using ImageJ software (NIH, Bethesda, MD, USA) and the relative expression of NLGN3 and HOMER1 was normalized to α-tubulin.
2.11 Total splenocytes isolationSpleens were separately placed in fresh RPMI-1640 medium supplemented with 10% fetal bovine serum (FBS) and then homogenized through a 70 µm cell strainer. Cell suspensions were centrifuged at 460 xg for 5 min at 4°C and then treated for 5 min at R.T with ammonium-chloride-potassium buffer (ACK, pH 7.2) to lyse erythrocytes. After two washes with fresh 1X PBS (5 mL each), total splenic leukocytes (also called splenocytes) were resuspended in 1 mL of PEB buffer (PBS 1X, 0.5% BSA, 2 mM EDTA), and counted using the Countess 3 Automated Cell Counters equipment (Thermo Fisher Scientific) using the trypan blue exclusion test of cell viability analysis (64).
2.12 Immune cell assessment by flow cytometryAdaptative and myeloid immune cell populations from the splenocytes were analyzed by flow cytometry. A portion of 1.0×10⁷ splenocytes were stimulated in vitro with phorbol myristate acetate (PMA; 5 ng/mL), ionomycin (500 ng/mL), and brefeldin-A (BFA, 10 μg/mL) for 5 h at 37°C and 5% CO2. Cells were harvested by centrifugation (600 xg, 5 min, 4°C) and then incubated with the following antibodies for 45 min at 4°C to assess Treg and Th17 populations: anti-CD4-BUV395 (BD 563790), anti-CD25-PeCy7 (BioLegend 102016), and anti-IL-17A-APCCy7 (BD 560821). Cells were washed and fixed with 2% formaldehyde in PBS for 15 min at R.T. After washing with PEB buffer, the cells were permeabilized using buffer IV (BD Phosflow 560746) during 15 minutes at 4°C. Cells were then washed and incubated with anti-FOXP3-Pe (Invitrogen 12-5773-82) and anti-RORγt-BV421 (BD 562894) during 45 min at 4°C. Antibodies were used at 0.2 mg/mL. Cells were washed and fluorescent beads (Thermo Fisher C36950) were added to each sample at a concentration of 667 beads/mL to determine the absolute number of events of interest. Absolute numbers of Treg and Th17 cells were also used to determine the Th17/Treg ratio as previously reported (65). Finally, 300,000 events per sample were recorded using the BD LSRFFortessa X-20 cytometer from the Facultad de Ciencias Biológicas, Pontificia Universidad Católica de Chile. FlowJo software (version 10.8) was used to analyze the immune cell populations. Concurrently, to analyze myeloid immune cell populations, a portion of 1.0×10⁷ splenocytes were directly stained with the following antibodies to analyze myeloid immune cell populations: anti-CD45-FITC (BioLegend 109806), anti-CD3-PercpCy5.5 (BioLegend 100218), anti-CD11b-PeCy7 (Invitrogen 25-0112-82), anti-CD49b-APC (BioLegend 103515), and anti-NK1.1-BV605 (BioLegend 108739) for Natural killers (NKs); anti-CD45-FITC (BioLegend 109806), anti-F4/80-BUV395 (BD 565614), anti-CD80-BV605 (BioLegend 104729), and anti-CD68-PeCy7 (BioLegend 137015) for M1-like macrophages; and anti-CD45-FITC (BioLegend 109806), anti-F4/80-BUV395 (BD 565614), anti-CD163-APC (BioLegend 156705), and anti-CD206-BV421 (BioLegend 141717) for M2-like macrophages, during 45 min at 4°C and darkness. All antibodies were used at 0.2 mg/mL. Cells were washed and analyzed by flow cytometry as previously described.
2.13 Statistical analysesSample sizes were determined using G*Power 3.1.9.7 software, based on a previous report (66). For pregnant mice groups, one-way ANOVA in F tests was conducted, with an effect size set to 0.80, α set to 0.05, and a test power set to 0.80, and considering 3 groups. This calculation yielded a total sample size of 21, with 7 mice allocated to each group. For experimental groups (Control-offspring, HTX-offspring, and HTX+T4-offspring), sample size was determined using a mixed-effects model in F test ANOVA, with an effect size set to 0.5 (effect size specification according to Cohen, 1988 (67)), α set to 0.05, a test power set to 0.99, number of measurements set to 41 (comprising all independent measurements obtained from each evaluated parameter in this study) and considering 3 groups. This resulted in a total sample size of 90, distributing 30 mice per experimental group, and separating 15 mice per sex. This allocation of mice for behavioral assessment and subsequent molecular analysis on the same mice aligns with the reduction and refinement principles of the 3 Rs in bioethics (68). Data analysis and statistical tests were performed using Prism 9.0.2 software (GraphPad, Inc). Thyroid hormone levels were compared among pregnant mice groups using one-way ANOVA followed by Tukey’s post-hoc test. To conduct multiple comparisons between experimental groups and both sexes for each parameter evaluated in this study, while mitigating the impact of the “litter effect”, a mixed-effects model was employed followed by Tukey’s post-hoc test. This approach enhances the reliability and accuracy of the results, ensuring robust statistical analysis (69). Pearson correlation analysis was applied to associate maternal T4 levels with all outcomes evaluated in the offspring. The results are presented as the mean ± standard error of the mean (SEM). Significance was established at p<0.05. p values in figures and text are presented as follows: *p<0.05, **p<0.01, ***p<0.001, and ****p<0.0001.
3 Results3.1 Methimazole treatment during E10 and E14 induces hypothyroxinemia in damsGestational HTX was induced in pregnant mice by administering 0.025% w/v of methimazole (MMI) through the tap drinking water from embryonic day 10 (E10) to E14 (refer to Materials and methods). The E10 to E14 timeframe for MMI treatment was chosen because it is comparable to the first trimester of gestation in human brain development (70). MMI acts as an allosteric inhibitor of the thyroid peroxidase enzyme, hindering the coupling of molecular iodine to the tyrosine residues in the thyroglobulin molecule, thereby inhibiting the TH synthesis (52–55). Several reports have shown that short-term administration of this drug at this concentration induces gestational HTX rather than gestational hypothyroidism (52–55). To confirm the successful induction of gestational HTX in dams, the levels of tT4, tT3, and TSH were quantified from serum samples obtained on E14. Results are shown in Figure 1. The levels of tT4 in the MMI-treated dams were reduced compared to untreated dams, however, this decrease was reversed by the addition of T4 during the MMI administration (Figure 1A). Additionally, the levels of tT3 (Figure 1B) and TSH (Figure 1C) remained similar among untreated, MMI-treated, and MMI+T4-treated dams. The exclusive reduction in tT4 confirmed the successful induction of HTX. Additionally, tT4, tT3, and TSH were quantified in the Control, HTX, and HTX+T4 offspring of both sexes on P50. The results indicate that the levels of tT4 (Figure 1D) tT3 (Figure 1E) and TSH (Figure 1F) were unchanged across the groups and sexes, indicating that the MMI treatment did not impact the offspring’s thyroid function in adulthood.
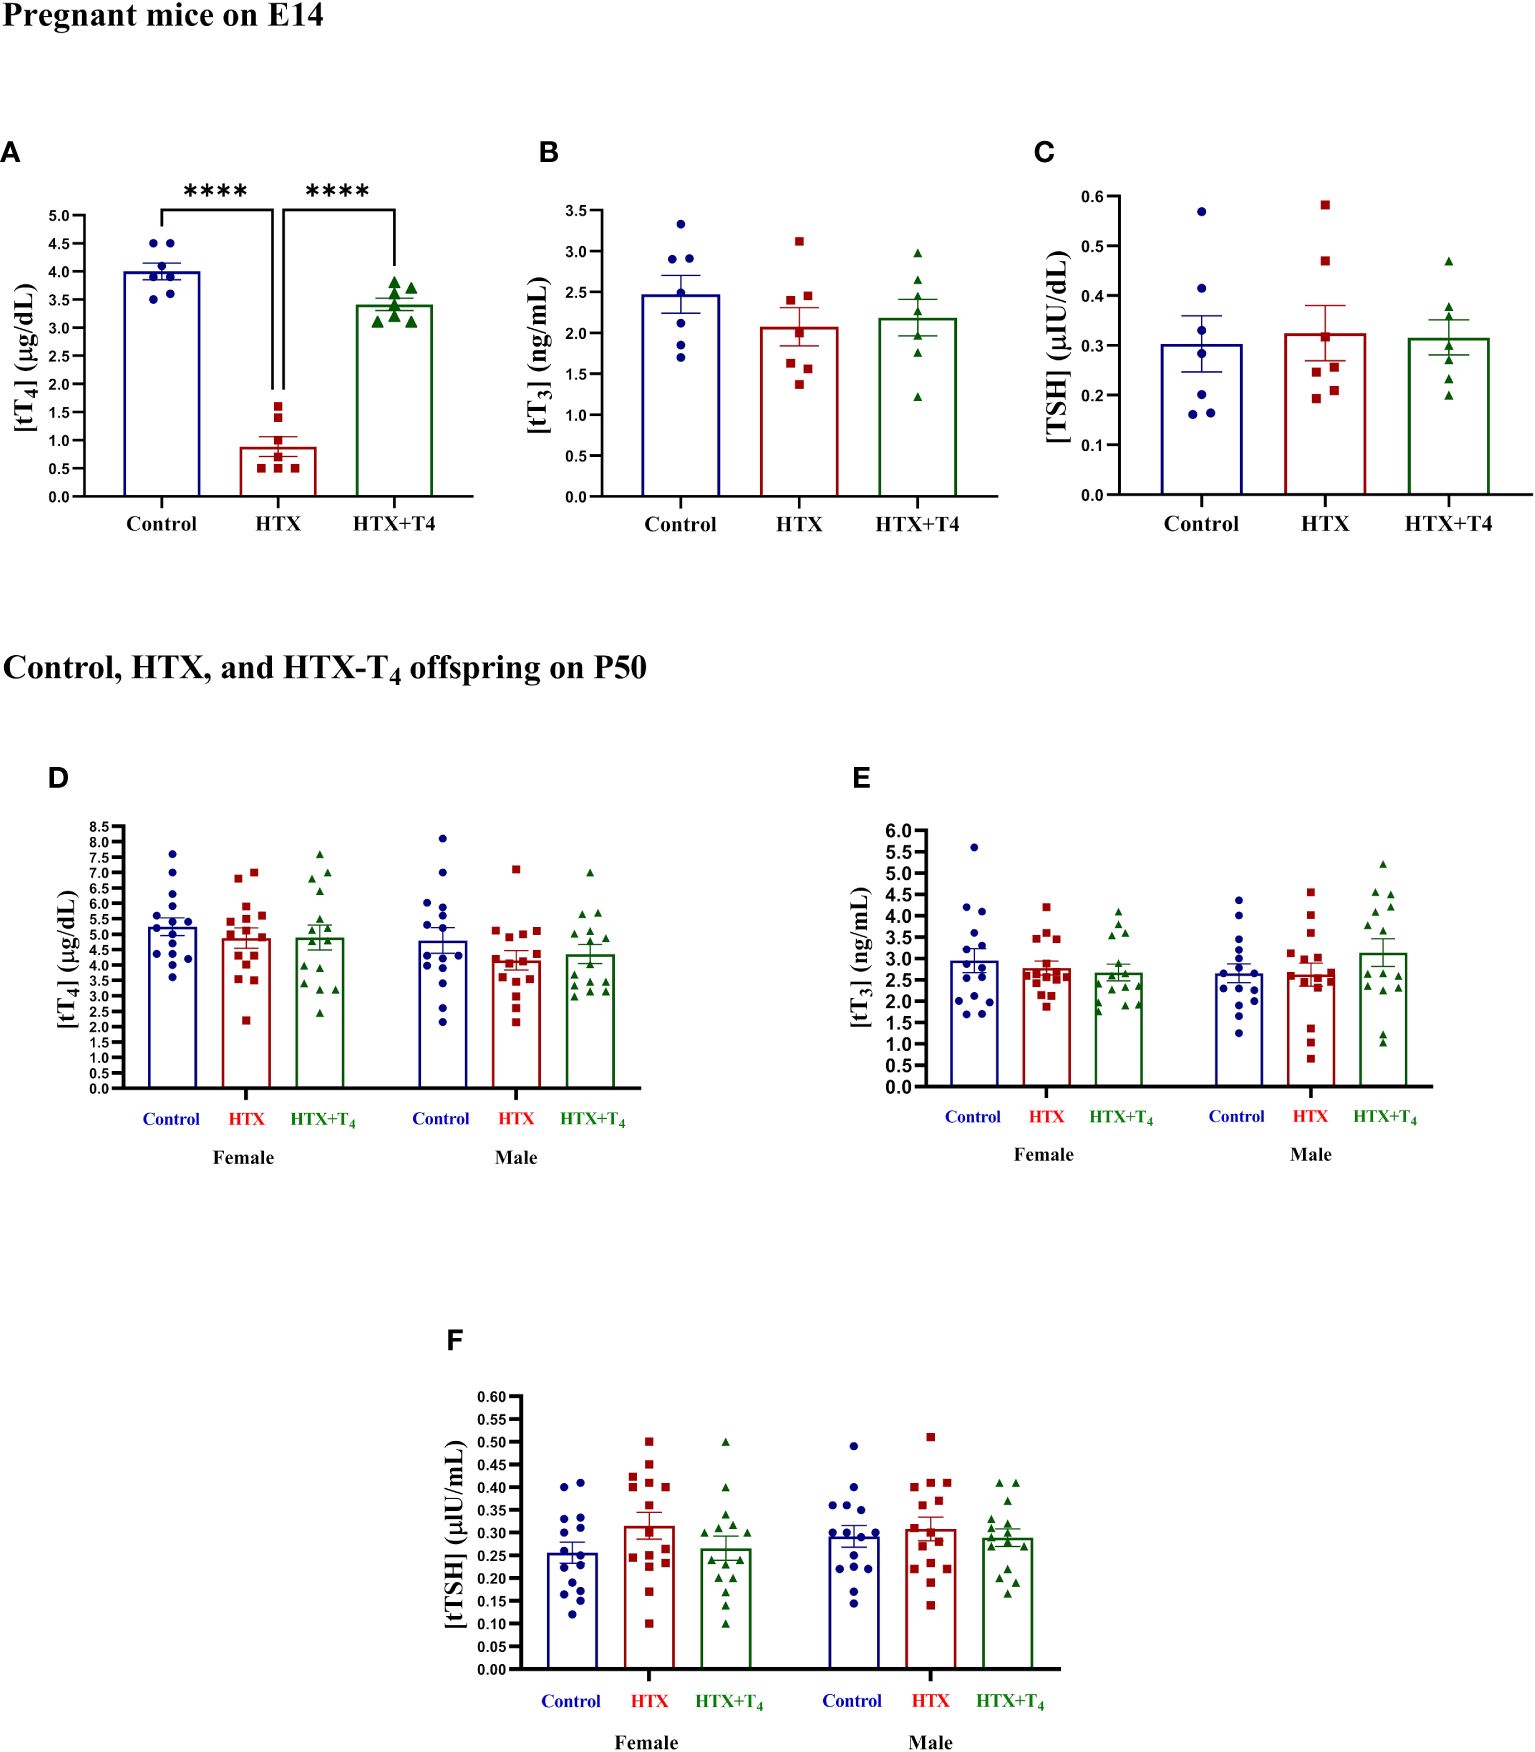
Figure 1 Methimazole treatment induces gestational hypothyroxinemia in pregnant mice, while adult offspring remain euthyroid. Levels of total TH and TSH were measured in blood samples obtained from the facial vein of Control, HTX, and HTX+T4 dams on E14 and plotted at (A) tT4, (B) tT3, and (C) TSH. Furthermore, the same hormones were quantified in both female and male offspring from the three experimental groups on P50 (D-F) (see Materials and Methods section). (A-C) N = 7 pregnant mice per group. (D-F) N = 15 per group and sex. Data are presented as mean ± S.E.M. Differences between pregnant mice groups (A-C) were analyzed by one-way ANOVA and Tukey’s post-hoc. (****p<0.0001). Multiple comparisons between experimental groups and both sexes (D-F) were analyzed by Mixed-effects model and Tukey’s post-hoc. Control-offspring: blue circles, HTX-offspring: red squares, and HTX+T4-offspring: green triangles.
3.2 Gestational HTX induces ASD-like behavioral alterations in adult offspring of both sexesRetrospective studies in humans have associated gestational HTX with autistic behavioral traits in the offspring (17, 18). However, comprehensive causal studies, along with an investigation into the cellular and molecular mechanisms underlying these ASD-like manifestations in the offspring, have yet to be conducted. Therefore, using a mouse model, the primary aim of this study was to validate the notion that gestational HTX leads to the development of ASD-like behavioral alterations in the offspring. Furthermore, considering potential sex-specific effects, both females and males were included in the exploration of these outcomes. For this purpose, four behavioral tests were employed to evaluate repetitive behavior, anxious-like behavior, and social interaction abilities in the HTX-gestated offspring of both sexes and compare their performance with that of Control and HTX+T4 offspring of both sexes. Behavioral testing was performed during adulthood given it is known that the brain reaches maturity at synaptic level and behavior-relevant areas, enabling a more precise investigation of ASD-like associated cognitive functions (70). Data are provided in Supplementary Table 1.
First, repetitive behavior was assessed using the marble burying test, where increased number of buried marbles compared to the control group indicates ASD-like repetitive behavior (57, 58). Female and male Control, HTX, and HTX+T4 offspring were individually placed in the testing cage containing twelve glass marbles for 30 min to evaluate their burying behavior. After that time, mice were returned to their respective cages and the number of buried marbles was counted (see Materials and methods). The percentages of buried marbles are shown in Supplementary Table 1.1. The representative images illustrate the buried marbles of both the female Control (Figure 2A), HTX (Figure 2B), and HTX+T4 (Figure 2C) offspring, as well as the male Control (Figure 2D), HTX (Figure 2E), and HTX+T4 (Figure 2F) offspring. Quantified data indicate that both female and male HTX-offspring significantly buried fewer marbles than the Control and HTX+T4-offspring (Figure 2G, Supplementary Table 1-1.1), suggesting the HTX-gestated offspring do not manifest a repetitive ASD-like behavior.
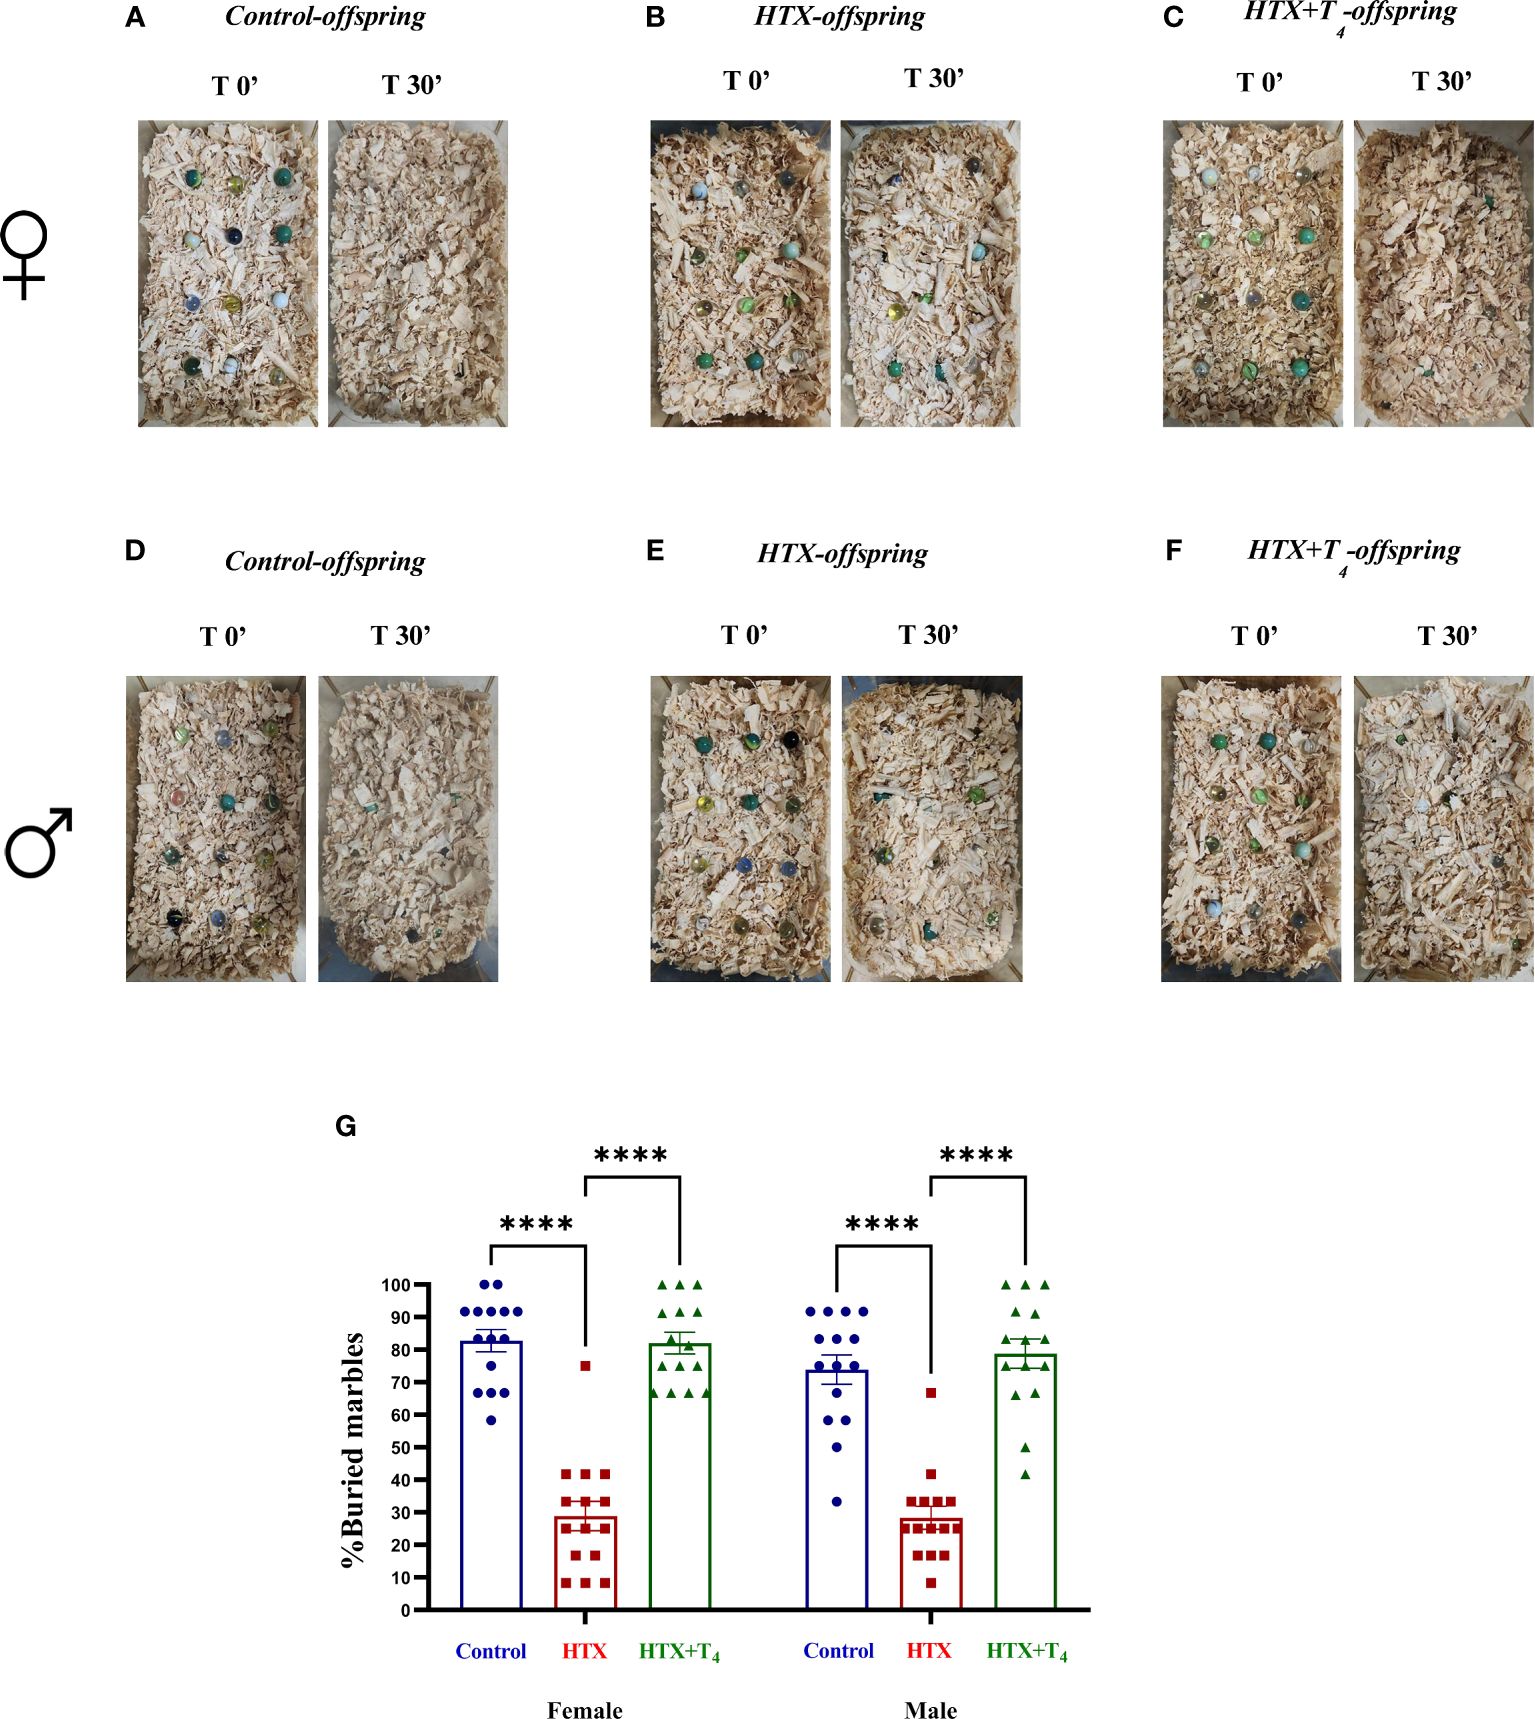
Figure 2 The HTX-gestated offspring of both sexes buried fewer marbles compared to the Control and HTX+T4 offspring. To assess repetitive behavior, adult offspring from the three experimental groups underwent the marble burying test on P55. The number of buried marbles was recorded, and the average count per experimental group was calculated. Pictures of the marbles at time 0’ and 30’ of the male (A-C) and female (D-F) experimental groups are illustrated. (G) The graph shows the percentage of buried marbles. N = 15 per group and sex. Data are presented as mean ± S.E.M. Multiple comparisons between experimental groups and both sexes were analyzed by Mixed-effects model and Tukey’s post-hoc. (****p<0.0001). Control-offspring: blue circles, HTX-offspring: red squares, and HTX+T4-offspring: green triangles.
Since anxiety is a widespread comorbid condition in ASD (71), the second evaluated aspect was the anxious-like behavior through the elevated plus maze (EPM) test (59, 60). Mice were individually placed in the cross-shaped maze and the time spent in both the open and closed arms and the number of entrances were registered (see Materials and methods). Results are shown in Figure 3 and Supplementary Table 1-1.2. The findings indicate that both female and male HTX-offspring spent considerably less time exploring the open arms (Figure 3A, Supplementary Table 1-1.2a), which was consistent with a lower number of entries into the open arms (Figure 3B, Supplementary Table 1-1.2b), compared to the Control and HTX+T4 offspring. Conversely, both female and male HTX-offspring spent significantly more time hiding in the closed arms, compared to the Control and HTX+T4 offspring (Figure 3C, Supplementary Table 1-1.2c). No differences in the number of entrances to the closed arms were detected across experimental groups and sexes (Figure 3D, Supplementary Table 1-1.2d). Considering that when mice spending more time hiding in the closed arms of the maze and less exposure to open spaces points to anxious-like behavior, these results suggest that the HTX-offspring manifests a behavior indicative of anxiety.
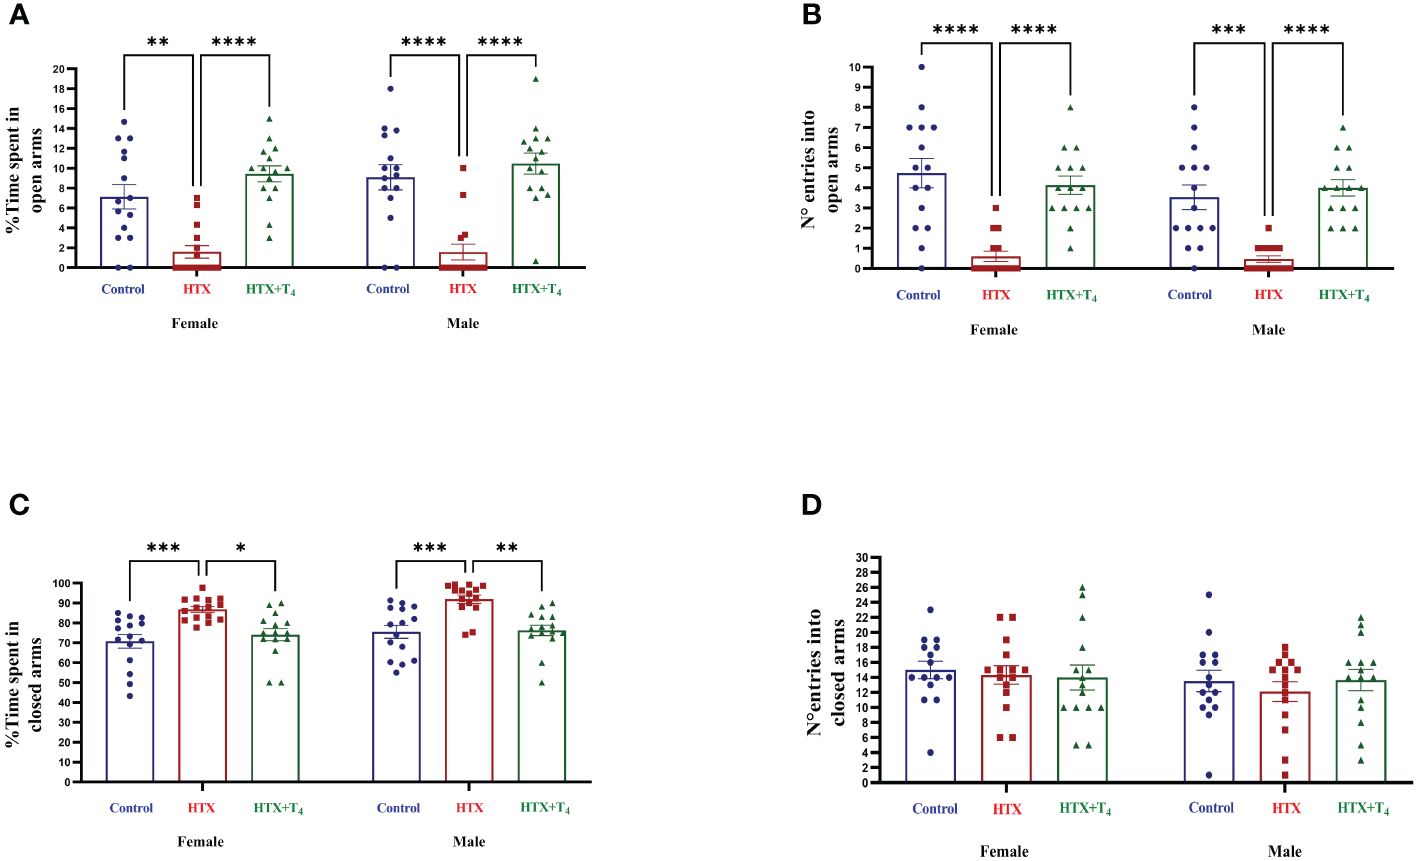
Figure 3 Female and male HTX-offspring exhibited anxious-like behavior. To assess anxious-like behavior, both male and female offspring from the three experimental groups were subjected to the elevated plus maze test on P56. (A) Percentage of time spent in open arms, (B) Number of entrances into the open arms, (C) Percentage of time spent in closed arms, and (D) Number of entrances into the closed arms. N = 15 per group and sex. Data are presented as mean ± S.E.M. Multiple comparisons between experimental groups and both sexes were analyzed by Mixed-effects model and Tukey’s post-hoc. (*p<0.05, **p<0.01, ***p<0,001, ****p< 0.0001). Control-offspring: blue circles, HTX-offspring: red squares, and HTX+T4-offspring: green triangles.
Subsequently, two specific tests were employed to evaluate two different dimensions of social behavior. The first test was tube dominance, design to assess socially aggressive behavior, aiding in the differentiation between subordinate and dominant statuses based on the principles of the hierarchy species theory (61). The test involves positioning two mice from distinct experimental groups at opposite entrances of a transparent hollow tube and allowing them to enter. Once they meet in the middle, a confrontation occurs, with one of the two compelling its opponent to retreat to exit. To evaluate the aggressive behavior of the HTX-gestated offspring, the following confrontation design was employed: Control-offspring vs. HTX-offspring, HTX+T4-offspring vs. HTX-offspring, and Control-offspring vs. HTX+T4-offspring (details in the Materials and Methods section). The percentage of wins for each experimental group was determined and provided in Figure 4 and Supplementary Table 1-1.3. The findings revealed that both female and male HTX-offspring displayed lower winning percentages when confronted with their respective female and male Control-offspring (Figure 4A, Supplementary Table 1-1.3a), and HTX+T4-offspring (Figure 4B, Supplementary Table 1-1.3b), suggesting that the HTX-gestated offspring have a subordinate status in the context of confrontation. Additionally, when Control-offspring was confronted with HTX+T4-offspring, regardless the sex, no significant differences in the winning percentage were detected (Figure 4C, Supplementary Table 1-1.3c).
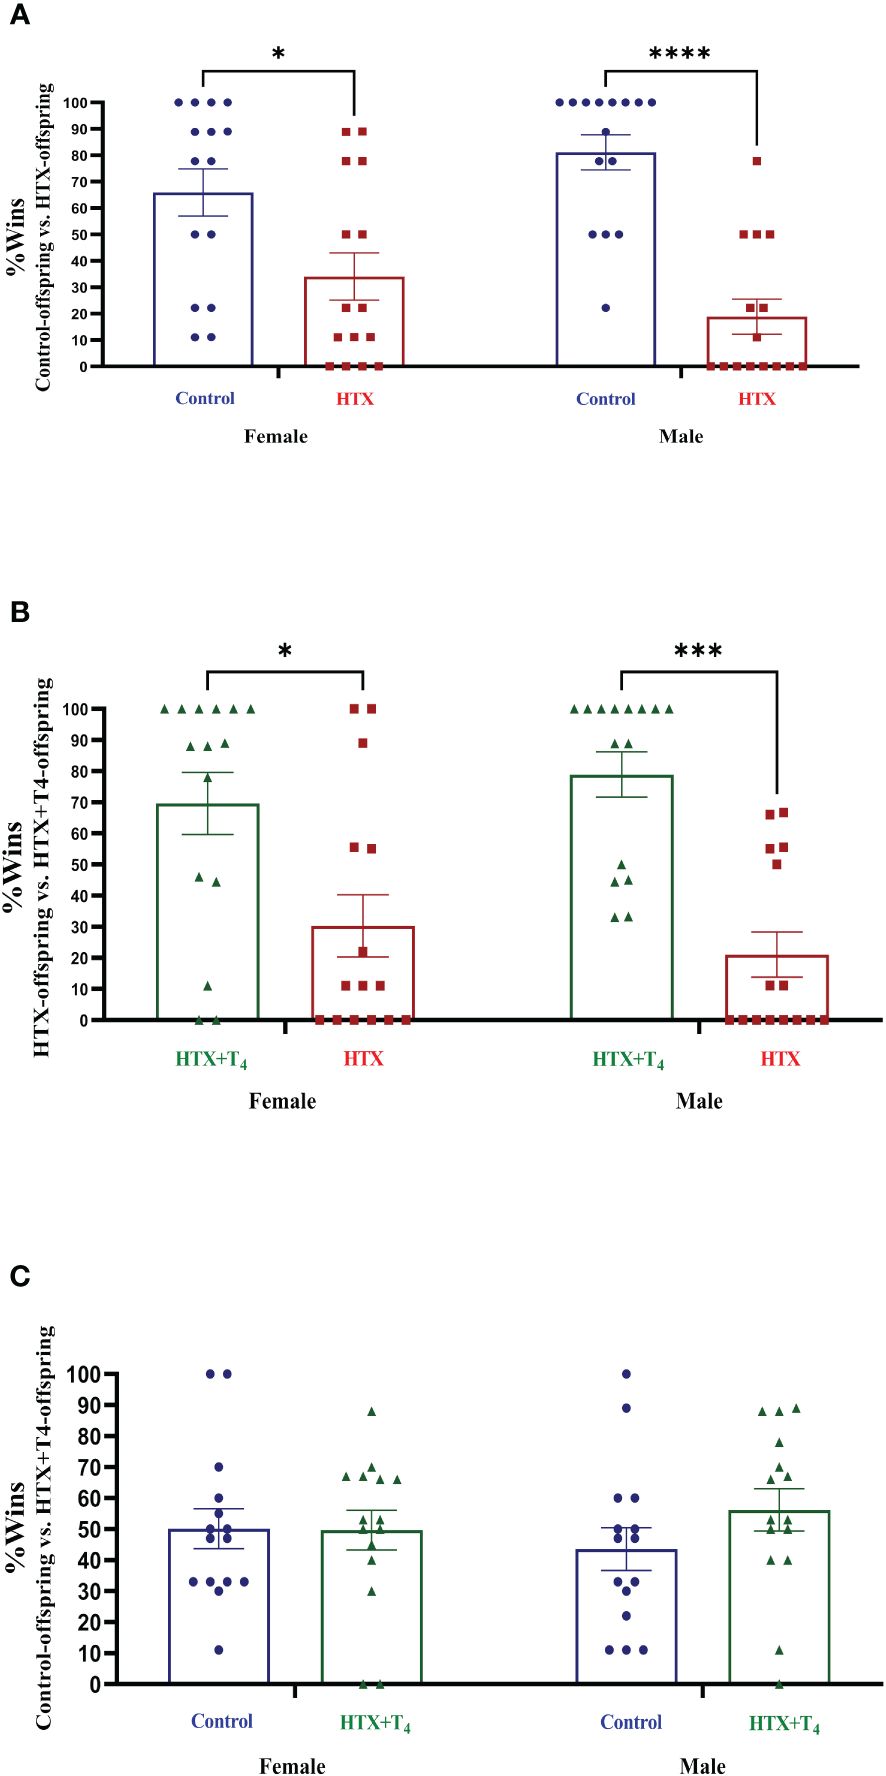
Figure 4 The HTX-gestated offspring of both sexes exhibited a subordinate state in the tube dominance test. Offspring from the three experimental groups were submitted to the tube dominance test (from P57 to P63) to study their socially aggressive behavior (details in Materials and methods section). Confrontations were arranged as follows: (A) Control-offspring vs. HTX-offspring, (B) HTX-offspring vs. HTX+T4-offspring, and (C) Control-offspring vs. HTX+T4-offspring. The percentage of wins was plotted. N = 15 per experimental group and sex. Data are presented as mean ± S.E.M. Multiple comparisons between experimental groups and both sexes were analyzed by Mixed-effects model and Tukey’s post-hoc. (*p<0.05, ***p<0,001, ****p<0.0001). Control-offspring: blue circles, HTX-offspring: red squares, and HTX+T4-offspring: green triangles.
The second social aspect evaluated was the social interaction preferences through the three-chamber social preference test (62). Mice from the three experimental groups were exposed to interact with different stimuli placed in opposite compartments of a three-chamber device to assess social preferences (details provided in Materials and methods). The percentage of time spent in each compartment and the number of entrances are illustrated in Supplementary Table 1-1.4, Supplementary Figures 1, 2. The percentage of time spent for direct interaction with each stimulus is shown in Figure 5 and Supplementary Table 1-1.4. During the first step of the test, female HTX-offspring spent more time in the nonsocial compartment only compared to the HTX+T4 offspring, while male HTX-offspring spent more time in the nonsocial compartment compared to both the Control and HTX+T4 offspring (Supplementary Table 1-1.4a, Supplementary Figure 1A). Likewise, male HTX-offspring spent more time in the nonsocial compartment even compared to female HTX-offspring (Supplementary Table 1-1.4a, Supplementary Figure 1A). Additionally, only male HTX-offspring made a higher number of entrances to the nonsocial compartment (Supplementary Table 1-1.4a, Supplementary Figure 1B) and spent more time directly interacting with the nonsocial stimulus compared to both the Control and HTX+T4 offspring and even compared to female HTX-offspring (Figure 5A, Supplementary Table 1.4c). Conversely, only male HTX-offspring spent less time in the social compartment (Supplementary Table 1-1.4d, Supplementary Figure 1C), however, the number of entrances into the social compartment remained similar between experimental groups and sexes (Supplementary Table 1-1.4e, Supplementary Figure 1E). Finally, both female and male HTX-offspring spent less time directly interacting with the social stimulus compared to the Control and HTX+T4 offspring (Figure 5B, Supplementary Table 1-1.4f).
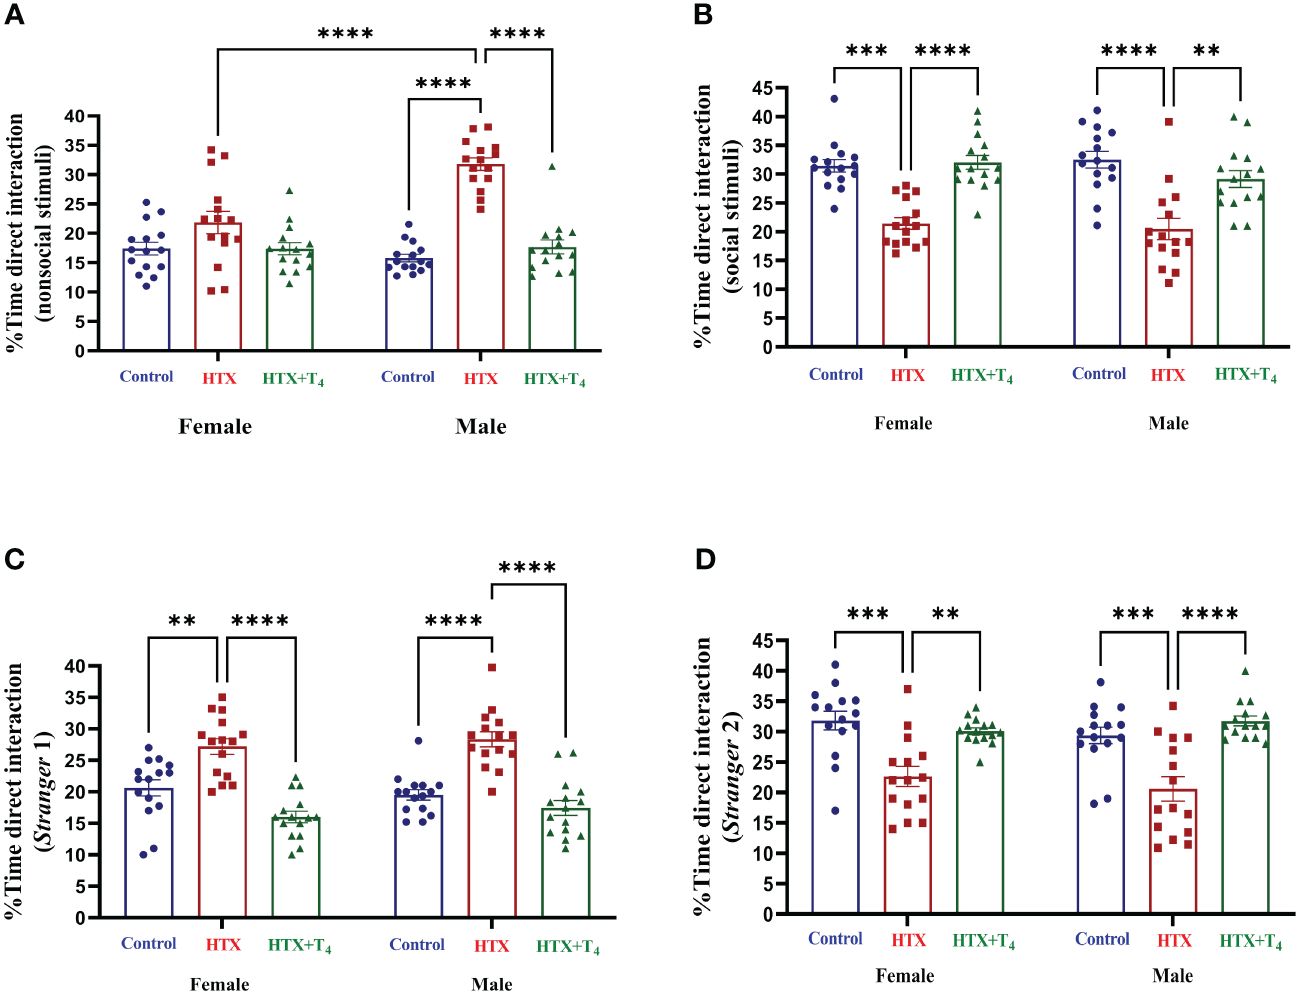
Figure 5 Female and male HTX-offspring display decreased direct social interaction preference compared to Control-offspring and HTX+T4-offspring. Offspring from the three experimental groups were subjected to analyze their social interaction abilities with the three-chamber social preference test on P64 (see Materials and methods). In the “Stranger 1” step, mice were exposed to a nonsocial and a social stimulus. (A) Percentage of time of direct interaction with the nonsocial stimulus and (B) Percentage of time of direct interaction with the social stimulus. In the “Stranger 2” step, mice were exposed to interact with the social stimulus from the first step but now renamed as “Stranger 1” step and the nonsocial stimuli was replaced with a new social incentive named “Stranger 2”. (C) Percentage of time of direct interaction with the S1 stimulus and (D) Percentage of time of direct interaction with the S2 stimulus. N = 15 per group and sex. Data are presented as mean ± S.E.M. Multiple comparisons between experimental groups and sexes were analyzed by Mixed-effects model and Tukey’s post-hoc. (**p<0.01, ***p<0,001, ****p< 0.0001). Control-offspring: blue circles, HTX-offspring: red squares, and HTX+T4-offspring: green triangles.
In the second phase of the test, the nonsocial stimulus was replaced with a new stranger mouse (referred to as the ‘de novo stimulus’ or ‘Stranger 2’), while maintaining the first stranger mouse, now renamed as ‘Stranger 1’. Despite no differences were identified in the time spent in the Stranger 1 compartment (Supplementary Table 1-1.4g, Supplementary Figure 2A), only male HTX-offspring made more entries to that compartment compared to Control and HTX+T4 offspring (Supplementary Table 1-1.4h, Supplementary Figure 2B). Additionally, both female and male HTX-offspring spent more time directly interacting with the Stranger 1 stimulus compared to Control and HTX+T4 offspring (Figure 5C, Supplementary Table 1-1.4i). Conversely, HTX-offspring (both sexes) spent less time in the Stranger 2 compartment (Supplementary Table 1-1.4j, Supplementary Figure 3C), but only females displayed a lower number of entrances to the Stranger 2 compartment (Supplementary Table 1-1.4k, Supplementary Figure 3D). Finally, both female and male HTX-offspring spent less time directly interacting with the de novo stimulus compared to Control and HTX+T4 offspring (Figure 5D, Supplementary Table 1-1.4l). Complementing these results with the first step, the HTX-gestated offspring show a reduced preference for interacting with the social stimuli but exhibit a stronger preference for interacting with the same social stimuli when the object is replaced with a second unfamiliar one in the second step of the test. These findings reinforce the notion of impaired interaction abilities resembling ASD-like behavior in this offspring.
3.3 Gestational HTX elevates proinflammatory markers in both female and male offspringBeyond behavioral alterations, immune dysregulation has also been associated with ASD, mainly by the determination of proinflammatory cytokines in blood samples of patients and the examination of neuroinflammatory traits and immune cell populations in secondary lymphoid organs in mouse models (45, 46). Hence, we investigated whether gestational HTX leads to ASD-like inflammatory status in offspring.
After conducting the behavioral tests, mice were euthanized, and specific cytokines were measured from serum samples (refer to Materials and Methods) (Figure 6, Supplementary Table 2-2.1). The results indicate that both female and male HTX-offspring had increased concentrations of the proinflammatory cytokines TNF-α (Figure 6A, Supplementary Table 2-2.1a), IL-6 (Figure 6B, Supplementary Table 2-4.1b), IL-1β (Figure 6C, Supplementary Table 2-2.1c), and IL-17A (Figure 6D, Supplementary Table 2-2.1d), in comparison to Control and HTX+T4 offspring. Additionally, IL-1β was even higher in the male HTX-offspring than in females (Figure 6C, Supplementary Table 2-2.1c). The anti-inflammatory cytokine IL-10 was significantly reduced only in male HTX-offspring compared to male Control and HTX+T4 offspring (Figure 6E, Supplementary Table 2-2.1e). The increased serum concentration of proinflammatory cytokines in the HTX-offspring is in concordance with ASD-like molecular features. Considering the neuroinflammatory component of ASD (47), IL-17A and its counterpart IL-10 were quantified in brain regions related to social cognition (prefrontal cortex (PFC) and hippocampus) (Figure 7, Supplementary Table 2-2.2). In the PFC, both female and male HTX-offspring had an increased concentration of IL-17A (Figure 7A, Supplementary Table 2-2.2a), while a reduction of IL-10 in the PFC was only observed in male HTX-offspring, compared to Control and HTX+T4 offspring (Figure 7B, Supplementary Table 2-2.2b). Interestingly, the male Control-offspring had a higher content of IL-10 in the PFC compared to female Control-offspring (Figure 7B, Supplementary Table 2-2.2b). Moreover, IL-17A in the hippocampus was increased in HTX-offspring of both sexes (Figure 7C, Supplementary Table 2-2.2c), whereas IL-10 was reduced only in the hippocampus of male HTX-offspring compared to Control and HTX+T4 offspring (Figure 7D, Supplementary Table 2-2.2d). These results suggest that the HTX-offspring exhibits a sex-dependent neuroinflammatory-like component which can also be indicative of an ASD-like phenotype.
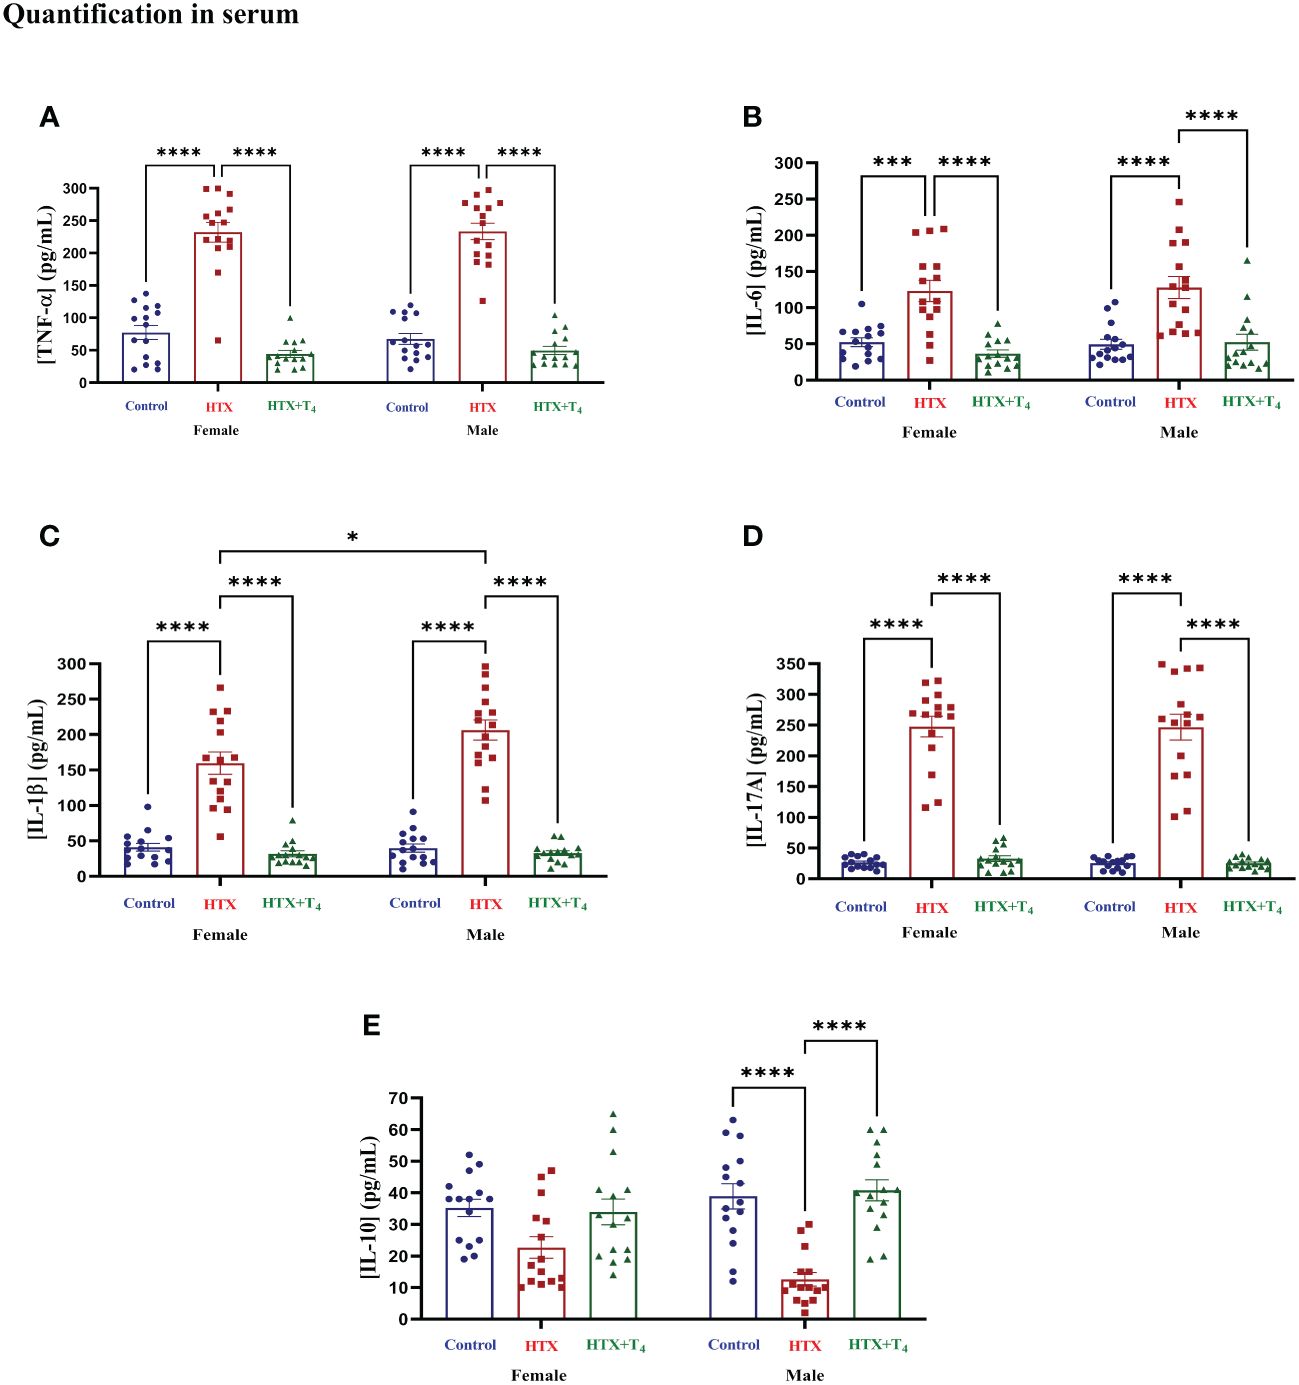
Figure 6 Female and male HTX-offspring has an increased concentration of pro-inflammatory cytokines in blood, while only male showed a reduced concentration of IL-10. Offspring from the three experimental groups were euthanized on P65, and the blood was extracted by cardiac puncture. The serum was isolated and used as samples (100 μL each) for the following cytokines determination by using sandwich ELISA: (A) TNF-α, (B) IL-6, (C) IL-1β, (D) IL-17A, and (E) IL- 10. N = 15 per group and sex. Data are presented as mean ± S.E.M. Multiple comparisons between experimental groups and both sexes were analyzed by Mixed-effects model and Tukey’s post-hoc. (*p<0.05, ***p<0,001, ****p<0.0001). Control-offspring: blue circles, HTX-offspring: red squares, and HTX+T4-offspring: green triangles.
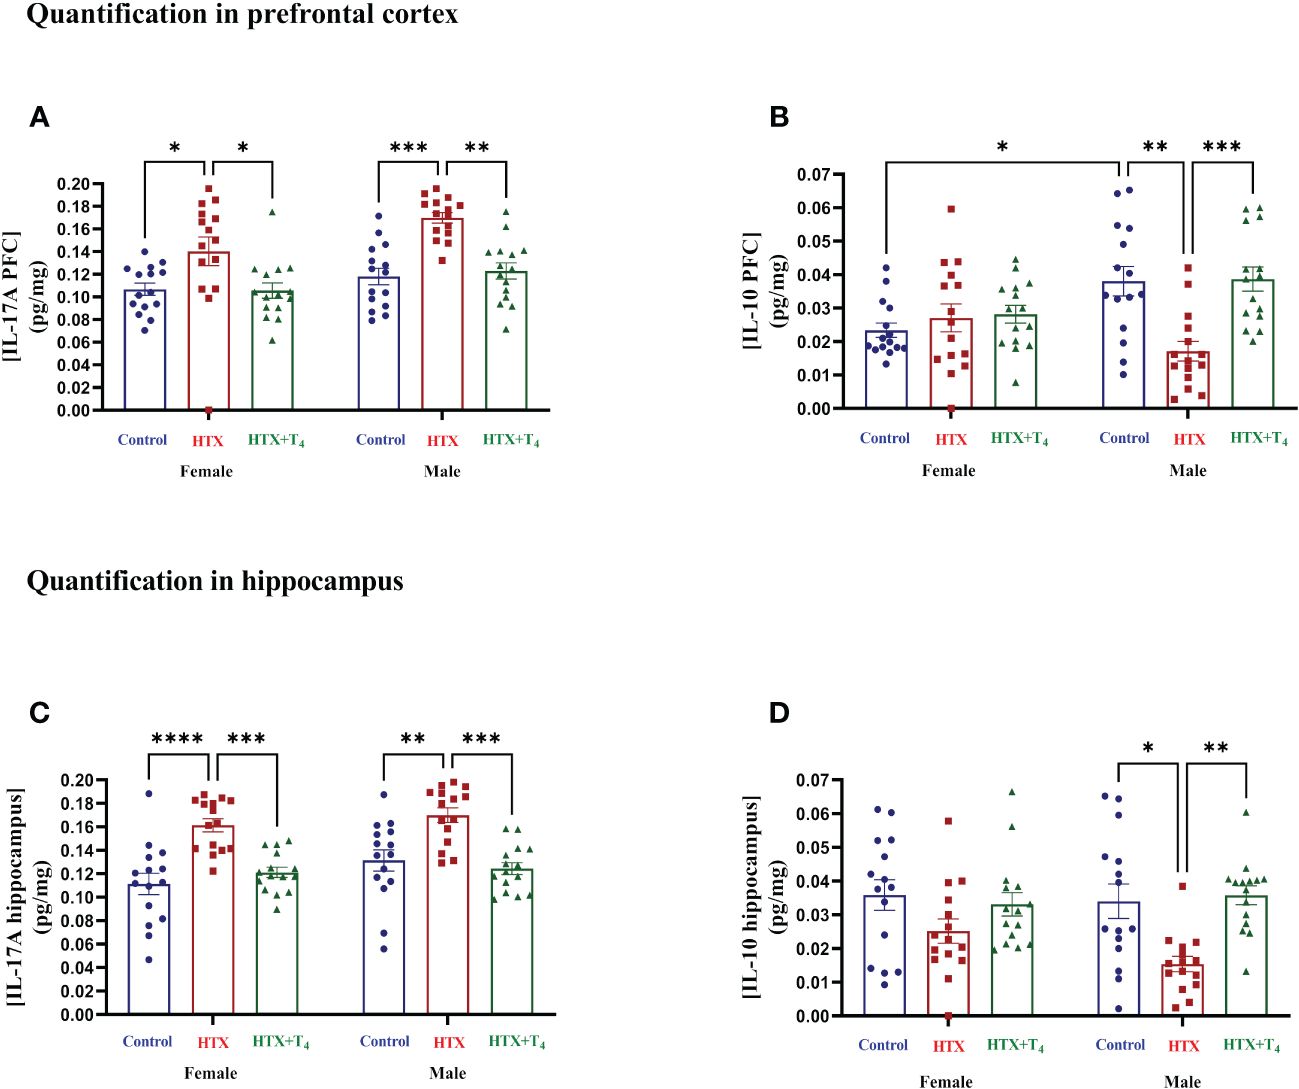
Figure 7 The HTX-gestated offspring of both sexes has higher levels of IL-17A in the prefrontal cortex and hippocampus than the control groups and reduced IL-10 only in males. Progenies of the three experimental groups were euthanized on P65, and PFC and hippocampus were isolated. Total proteins were extracted from these tissues and 0.5 mg per sample were used for the measurement of IL-17A and IL-10 by sandwich ELISA. (A) IL-17A in the PFC, (B) IL-10 in the PFC, (C) IL-17A in the hippocampus, and (D) IL-10 in the hippocampus. Data was normalized to mg of proteins. N = 15 per experimental group and sex. Data are presented as mean ± S.E.M. Multiple comparisons between experimental groups and both sexes were analyzed by Mixed-effects model and Tukey’s post-hoc. (*p<0.05, **p<0.01, ***p<0,001, ****p<0.0001). Control-offspring: blue circles, HTX-offspring: red squares, and HTX+T4-offspring: green triangles.
Finally, to broaden our comprehension of the immunological aspect of the HTX-offspring regarding the proportion of immune cell populations (48, 49), total splenocytes were isolated, and myeloid and specific T cells were assessed by flow cytometry. Total splenocytes were subjected to an in vitro stimulation with PMA, ionomycin, and BFA. Thereafter, harvested cells were labeled with appropriate antibodies to identify Tregs and Th17 cells and analyzed by flow cytometry (see Materials and methods). The results are presented in Figure 8 and the employed gating strategy for Treg and Th17 cell selection is shown in Supplementary Figures 3A and B, respectively. The findings revealed that both female and male HTX-offspring had a lower absolute number of CD4+CD25highFOXP3+ cells (Tregs), compared to Control and HTX+T4 offspring (Figures 8A, B). Conversely, an increased absolute number of CD4+IL-17A+RORγt+ cells (Th17) was observed in HTX-offspring of both sexes, also compared to Control and HTX+T4 offspring (Figures 8C, D). Consistent with these findings, both female and male HTX-offspring had a higher Th17/Treg ratio (Figure 8E). Myeloid cells, particularly M1/M2-like macrophages and NK cells were also evaluated in splenocytes by flow cytometry. The results are depicted in Figure 9 and the employed gating strategy is shown in Supplementary Figures 4A-C. Similarly, both female and male HTX-offspring had a higher absolute number of CD45+CD3-F4/80+CD80+CD68+ cells (M1-like macrophages), than the Control and HTX+T4 offspring (Figures 9A, B). Nonetheless, no differences were observed in the absolute numbers of CD45+CD3-F4/80+CD206+CD163+ cells (M2-like macrophages) (Figures 9C, D) and CD45+CD3-CD11b+NK1.1+CD49b+ cells (NKs) (Figures 9E, F). These findings, in conjunction with the previous ones, indicate that the HTX-offspring also exhibits an imbalanced proportion of immune cells, overall pointing to an exacerbated proinflammatory status that aligns with an ASD-like phenotype.
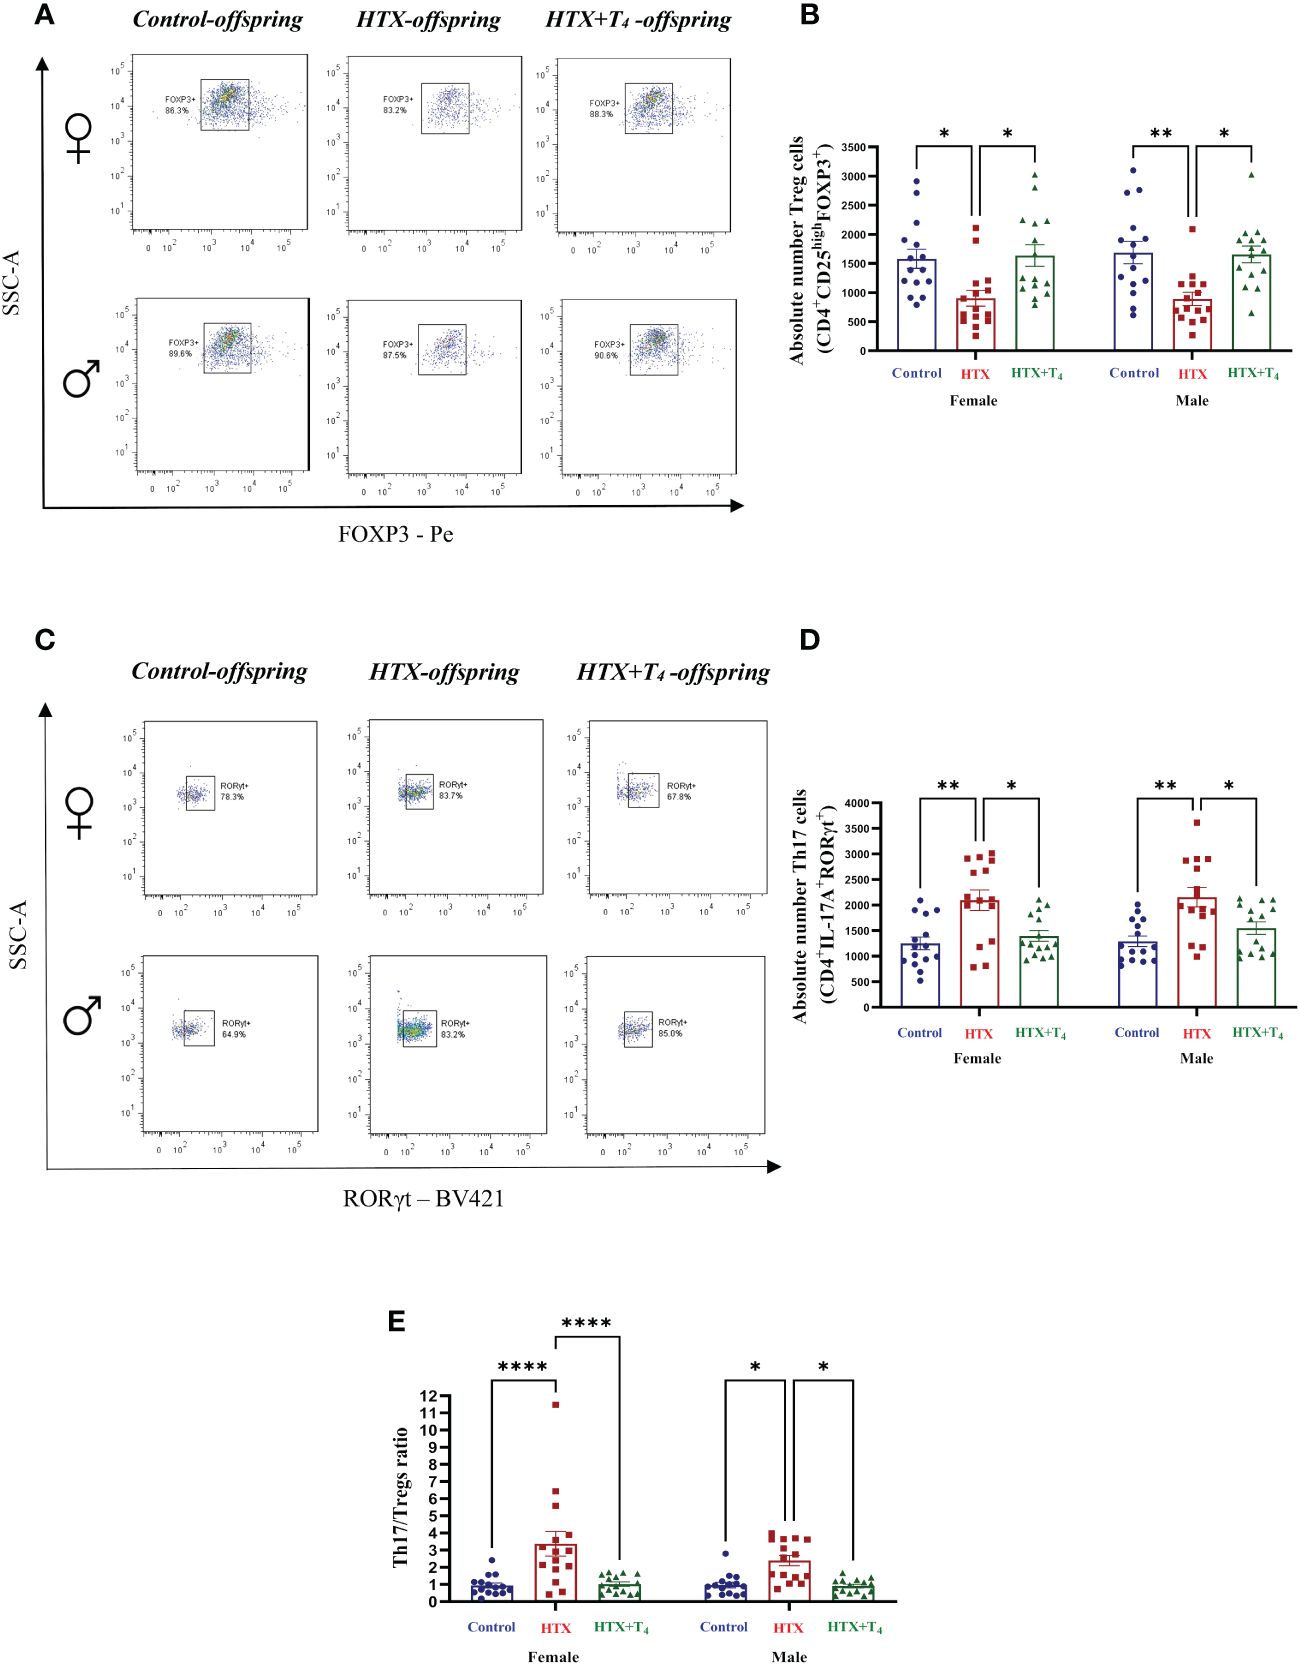
Figure 8 The HTX-offspring of both sexes has an imbalance in the Th17/Tregs ratio inclined towards increased Th17 cell number. Progenies from the three experimental groups were euthanized on P65, and spleens were removed. Total splenocytes were purified and a portion of these cells was in vitro stimulated using PMA-Ionomycin-BFA (see Materials and methods). The population of Tregs and Th17 were quantified by flow cytometry. (A) Representative dot plots of FOXP3-positive cells, (B) The graph shows the absolute number of FOXP3-positive cells, (C) Representative dot plots of RORγt-positive cells, (D) the graph shows the absolute number of RORγt-positive cells, and (E) the graph shows the Th17/Tregs ratio. N = 15 per group and sex. Data are presented as mean ± S.E.M. Multiple comparisons between groups and both sexes were analyzed by Mixed-effects model and Tukey’s post-hoc. (*p<0.05, **p<0.01, ****p<0,0001). Control-offspring: blue circles, HTX-offspring: red squares, and HTX+T4-offspring: green triangles.
留言 (0)