
記住我


From the 90 patients included in the trial, 30 were initially excluded from NGS studies due to insufficient BM PC to perform CD138 positive selection or due to insufficient genomic DNA obtained after cell selection. Other 3 patients were excluded due to low total read counts obtained after sequencing. A total of 57 patients (63%) were successfully characterized using our custom NGS panel.
Clinical variables of the 57 patients are described and compared with the entire cohort of 90 patients in Table S1. Overall, the median age at diagnosis was similar (59 years) with identical distribution of cytogenetic risk categories. Other biochemical parameters were also comparable. According to the 2014 IMWG definition of smoldering and symptomatic disease, 44 patients met the current criteria to be considered HR SMM at diagnosis, while the remaining 13 cases, originally classified as UHR SMM, had active disease at baseline following the current criteria. Median follow-up after inclusion in the trial (cutoff date: October 31st, 2022) was 64.5 months (range: 23.7‒82). Six patients died; only 2 of them had previously experienced clinical progression (Figure S1). Biochemical relapses, including biochemical progression, MRD conversion from negative to positive at any time, and relapse from CR, occurred in 5, 4, and 11 patients, respectively. Projected 60-month bPFS, PFS, and OS were 66.2, 89.3, and 91.1%, respectively.
In addition to the clinics and the aforementioned three criteria used for their current identification, UHR SMM patients were associated with Bence-Jones (BJ) disease (3/4 BJ cases in this series were UHR, p = 0.023), but other parameters were similarly distributed between HR and UHR SMM cases.
Mutational profile of high-risk and ultrahigh-risk SMM patientsOverall, 96 SNV and indels were identified after filtering. A visual summary of SNV and indels is shown in Fig. 1. The median number of alterations per patient was 1 (range: 0‒9), with 11/57 patients (19.3%) harboring no alterations in the studied genes. Moreover, VAF from SNV and indels indicated that most alterations (69%) were subclonal (Fig. 2).
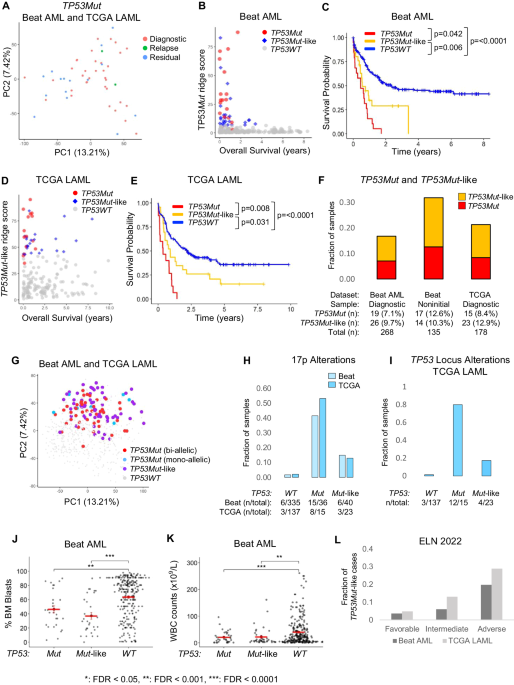
Fig. 1: Mutational profile of the 57 patients with high-risk smoldering myeloma and ultrahigh-risk smoldering myeloma.
Both genomic and clinical data were integrated for each patient, represented by individual columns. Single nucleotide variants and indels are listed per gene, grouped based on the corresponding molecular pathway. Genes that do not belong to specific pathways were included in the category “other pathways”. Multihit mutations (i.e. several mutations in the same gene) are represented with an asterisk. The 8 structural variants evaluated by FISH were also incorporated as an additional molecular group in light green (positive), grey (negative) or white (not tested). On the top, the tumor mutation burden combining NGS and FISH is plotted, distinguishing between molecular pathways. On the lower side of the figure, diagnosis, MRD dynamics, biochemical progression, clinical progression and death events are color-coded. On the right side of the figure, the global percentage of each genomic event and the corresponding absolute number of altered patients are represented. bPFS biochemical progression-free survival, HR SMM high-risk smoldering myeloma, MAPK mitogen-activated protein kinase, MRD minimal residual disease, NF-κB nuclear factor-κB, TMB tumor mutation burden (total number of events per patient), transl translocation, UHR SMM ultrahigh risk smoldering myeloma.
Fig. 2: Frequencies of recurrent genetic alterations.
A Represented with blue boxplots, Variant allele frequencies of single-nucleotide variants or indels, corrected based on FISH results. Note that local copy numbers were not evaluated and therefore not used to calculate cancer clonal fractions. B Represented with red boxplots, the proportion of altered cells as detected by FISH. Each event is represented by a blue/red dot. Those genes altered only once in our cohort were excluded. Clonality and subclonality of genomic alterations were defined as >80% or ≤80% by FISH, and as >40% or ≤40% by NGS, respectively. del: deletion; FISH: fluorescent in-situ hybridization.
First, we compared HR and UHR SMM patients (Table S2). TRAF3 mutations were exclusive of UHR SMM (3/13 vs 0/44, p = 0.01), while other mutations were equally distributed. Based on this result, further evaluations were performed, including all 57 patients. The mutational profile of our patients was enriched in alterations involving well-known drivers in MM, such as KRAS (17.5%), NRAS (12.3%), DIS3 (15.8%) or FAM46C (7%) (Table 1). When genes were grouped together based on their corresponding signaling pathways, MAPK gene mutations were the most abundant (52.6%), followed by those belonging to RNA and protein processing (22.8%), NF-κB (15.8%), DNA repair (10.5%), B-cell development (5.3%) and cell cycle (1.3%) pathways (Table 1). In 7 patients, we identified more than one SNV and/or indel in the same gene (multihit mutations), which were generally restricted to functionally relevant domains of the coding protein (Fig. 1, Table 2).
Table 1 Frequencies of mutations, common CNA and translocations in high-risk smoldering myeloma compared with previous series.Table 2 List of patients affected by multihit mutations.In addition, 56 chromosomal aberrations were detected by FISH (Fig. 1, Table 1). Combining NGS and FISH, only 3 patients had no genomic alterations detected. High-risk cytogenetic aberrations [t(4;14), t(14;16), and/or del17p] were identified in 13 cases, with two patients harboring both t(4;14) and del17p. Gains/amplifications of 1q and 1p deletions were detected in 51.9% and 3.8% of cases, respectively. Out of the 33 patients that could be tested for t(11;14), 4 (12.1%) were positive. Cytogenetic alterations involving 8q24 locus were evaluated in 40 patients and included the detection of 5 cases with 8q24 gains (12.5%) and 2 cases with 8q24 translocations (5%) involving the IGH locus. Looking at FISH aberrations shown in Fig. 2, t(11;14) and t(4;14) had high median clonal percentages, as expected for initiating events in myelomagenesis. Clonal proportions of +1q were also higher as compared to other structural events. Again, no significant differences between cytogenetic profiles of HR and UHR SMM patients were identified.
In terms of concurrent alterations (Fig. 3), FGFR3 mutations were frequently accompanied by t(4;14): out of 11 t(4;14) positive patients, 8 had FGFR3 mutations, and 5 of these consisted on amino acid substitutions to Cysteine residues in one of the three extracellular subdomains (Table S3). KRAS mutations and 1q alterations were mutually exclusive. NRAS mutations often co-occurred with t(11;14). 8q24 gains were associated with t(4;14) and DIS3 mutations. Finally, DUSP2 mutations specifically co-occurred with 8q24 gains and FGFR3 mutations. No double-hit events involving TP53 were identified in our cohort. Only one patient had a CCND1 mutation, with a concurrent t(11;14) translocation. In the same line, the only patient that showed a MAF mutation was the only t(14;16) positive one.
Fig. 3: Correlation matrix showing concurrent and mutually exclusive alterations.
Colors blue and red are used to depict positive or negative associations, respectively. P-values were adjusted for significant associations at the levels of 0.05 (black circle) and 0.1 (white circle).
The mutational profile of high-risk SMM patients is intermediate between SMM and MMComparing our cohort of HR/UHR SMM with previously published series of SMM and symptomatic MM, we could observe that the burden of genomic aberrations consistently increased across the three entities, with HR/UHR SMM representing an intermediate link between low/intermediate SMM and MM (Table 1). Compared to previous observations in general populations of SMM, HR/UHR SMM patients showed an enrichment in DIS3, FAM46C, PRKD2, NF1, ZNF292 and ACTG1 mutations, as well as more +1q and t(4;14). Compared with a large MM cohort, our patients only showed a significantly lower incidence of 1p deletions. Only FGFR3 mutations were significantly enriched in HR/UHR SMM compared to the other two entities (p = 0.004 and p < 0.0001 compared with SMM, p = 0.001 compared to MM).
Comparing cell signaling pathways (Table 1), we found a higher proportion of mutations in the MAPK (52.6%), RNA processing (22.8%) and NF-κB (15.8%) pathways in our cohort, compared to those reported by Boyle and colleagues (24%, 3.7% and 4.9%, respectively). Conversely, in the other two cohorts, the proportions of each altered pathway were similar, probably indicating that patients described by Boyle et al. were mostly low-intermediate risk SMM.
Molecular and clinical associations in high-risk SMMEvaluating specific subgroups of patients, we identified correlations between clinical and biological features. As mentioned above, the 13 UHR SMM patients were associated with BJ disease (p = 0.015) and, importantly, TRAF3 mutations were exclusive of this group, specifically of those with a sFLCr > 100. In the CoMMpass series, we checked the association between TRAF3 mutations and a sFCLr > 100 at diagnosis: 47/409 cases with a high sFLCr also had TRAF3 mutations, compared to only 21/483 cases with a lower sFLCr (11.5% vs 4.3%, p < 0.0001). Moreover, in our UHR SMM patients the presence of multihit mutations was enriched (30.7% of 13 UHR vs 6.8% of 44 HR patients, p = 0.041). No other mutation was specific to any clinical characteristic of our patients, although those with no somatic mutations detected with our panel most often had ≤ 20% BM PC infiltration, compared to mutated patients (8/11 vs 14/46, p = 0.015). Five out of the seven patients with multihit mutations had sustained positive minimal residual disease (MRD) assessed by next-generation flow cytometry (median sensitivity 2·10−6) or converted from undetectable to detectable MRD at any time point (p = 0.21). In cases with high-risk cytogenetics, compared to those with a standard-risk profile, the mean number of point mutations per patient was higher [2.62 (95% CI: 1.08‒4.15) vs 1.40 (95% CI: 1.03‒1.78); p = 0.021], as it was the mean serum M-protein levels [3.47 g/dL (95% CI: 2.26‒4.71) vs 2.34 g/dL (95% CI: 1.95‒2.73); p = 0.017].
Genomic predictors of treatment resistance and progression in high-risk SMM patientsFor survival analyses, HR and UHR SMM were independently evaluated. First, we tested whether previously identified risk factors of progression would be still significant in the context of HR SMM patients receiving an intensive regimen. Neither t(4;14) alone, combined MAPK mutations, DNA repair pathway gene mutations nor structural variants affecting the 8q24 locus could effectively discriminate outcomes in the Kaplan‒Meier plots (Figure S2A-D). In contrast, we discovered new potential prognostic factors for these patients: the combination of t(4;14) plus FGFR3 mutation, as well as NRAS mutations, were both significantly associated with lower bPFS rates in univariate analyses; conversely, patients with KRAS mutations showed a trend towards longer bPFS (Fig. 4A-C).
Fig. 4: Kaplan-Meier plots of new genomic risk factors in high-risk smoldering myeloma under treatment.
Biochemical progression-free survival curves of the 44 high-risk SMM cases were plotted based on the presence (red) or absence (black) of different alterations at baseline. The 13 ultrahigh-risk patients were not considered here. (A) KRAS mutations; (B) NRAS mutations; (C) concurrent FGFR3 mutation and t(4;14). The number of patients for each category is shown in brackets. bPFS biochemical progression-free survival SV structural variant, WT wild type.
Among the 13 cases with UHR MM, only those with multihit mutations (Figure S3) showed a trend towards shorter bPFS rates (median: 20.10 months vs not reached, p = 0.053). TRAF3 mutations did not reach statistical significance, probably given the short size of the UHR MM subset, but in the MMRF’s CoMMpass cohort their presence predicted significantly improved outcomes as compared to TRAF3 wild-type patients (Fig. 5A-C).
Fig. 5: Impact of TRAF3 mutations in ultra-high risk myeloma patients.
A Survival plot of the 13 ultrahigh-risk patients in our cohort showed that patients with TRAF3 mutations may have improved outcomes, although this did not reach significance in our series. However, the prognostic significance of TRAF3 mutations was later explored in the CoMMpass series for confirmation. B Globally, TRAF3 wild-type patients in the CoMMpass cohort had a significantly worse PFS compared to TRAF3 mutated patients. C From the CoMMpass series, patients that had a sFLCr > 100 at diagnosis and experienced disease progression at any time (N = 181) were selected. In this high-risk subpopulation, TRAF3 wild-type patients also showed dismal prognosis with a significantly shorter TTP. CI Confidence interval, bPFS biochemical progression-free survival, HR hazard ratio, PFS progression-free survival, TTP time to progression, WT wild type.
Due to the low number of UHR cases, a multivariate Cox regression analysis was carried out only for the 44 HR SMM patients, including those variables with statistically significant impact in univariate analyses: NRAS mutations, combined t(4;14) plus FGFR3 mutations, the age at inclusion in the trial, and a high-risk cytogenetic status. Three variables retained its independent prognostic impact on bPFS: the combined presence of t(4;14) and FGFR3 mutations (HR: 6.58, 95% CI: 1.84‒23.47, p = 0.004), the age at inclusion (HR: 1.16, 95% CI: 1.04‒1.30, p = 0.006) and NRAS mutations (HR: 5.39, 95% CI: 1.54‒18.80, p = 0.008).
留言 (0)