
記住我
A total of 74 RRMM patients were enrolled. Patients had previous exposure to alkylating agents and/or anthracycline-containing chemotherapy (93.2%) and proteasome inhibitors (PIs) and/or immunomodulatory drugs (IMiDs) (95.9%), while 24.3% of patients underwent autologous hematopoietic stem cell transplantation (Supplementary Table 1). The median number of prior lines of therapy was three (range 1∼9). Patients aged 27∼74 years old with a median of 54.5. 16.2% of participants had poor Eastern Cooperative Oncology Group (ECOG) performance status (≥ 2 scores). Immunoglobulin (Ig) G (44.6%) subtype accounted for the most, followed by IgA (28.4%) and light chain (25.7%). With respect to tumor burden and myeloma biology, 28.4% of the cases were stratified as International Staging System (ISS) III and 75.7% were categorized as Durie-Salmon System III. Extramedullary plasmacytoma was present in 29.7% of patients at baseline. Cytogenetic abnormalities (CA) information including t(4;14), t(14;16), t(14;20), del(17p), and gain(1q), was available in 42 patients, 78.6% of whom bore high-risk CA. According to the updated risk stratification proposed by the Mayo clinic [10], 23.8% and 2.4% of the 42 patients were involved with double-hit and triple-hit diseases, respectively. The mean level of serum β2-microglobulin was 5.8 mg/L. Details are shown in Table 1.
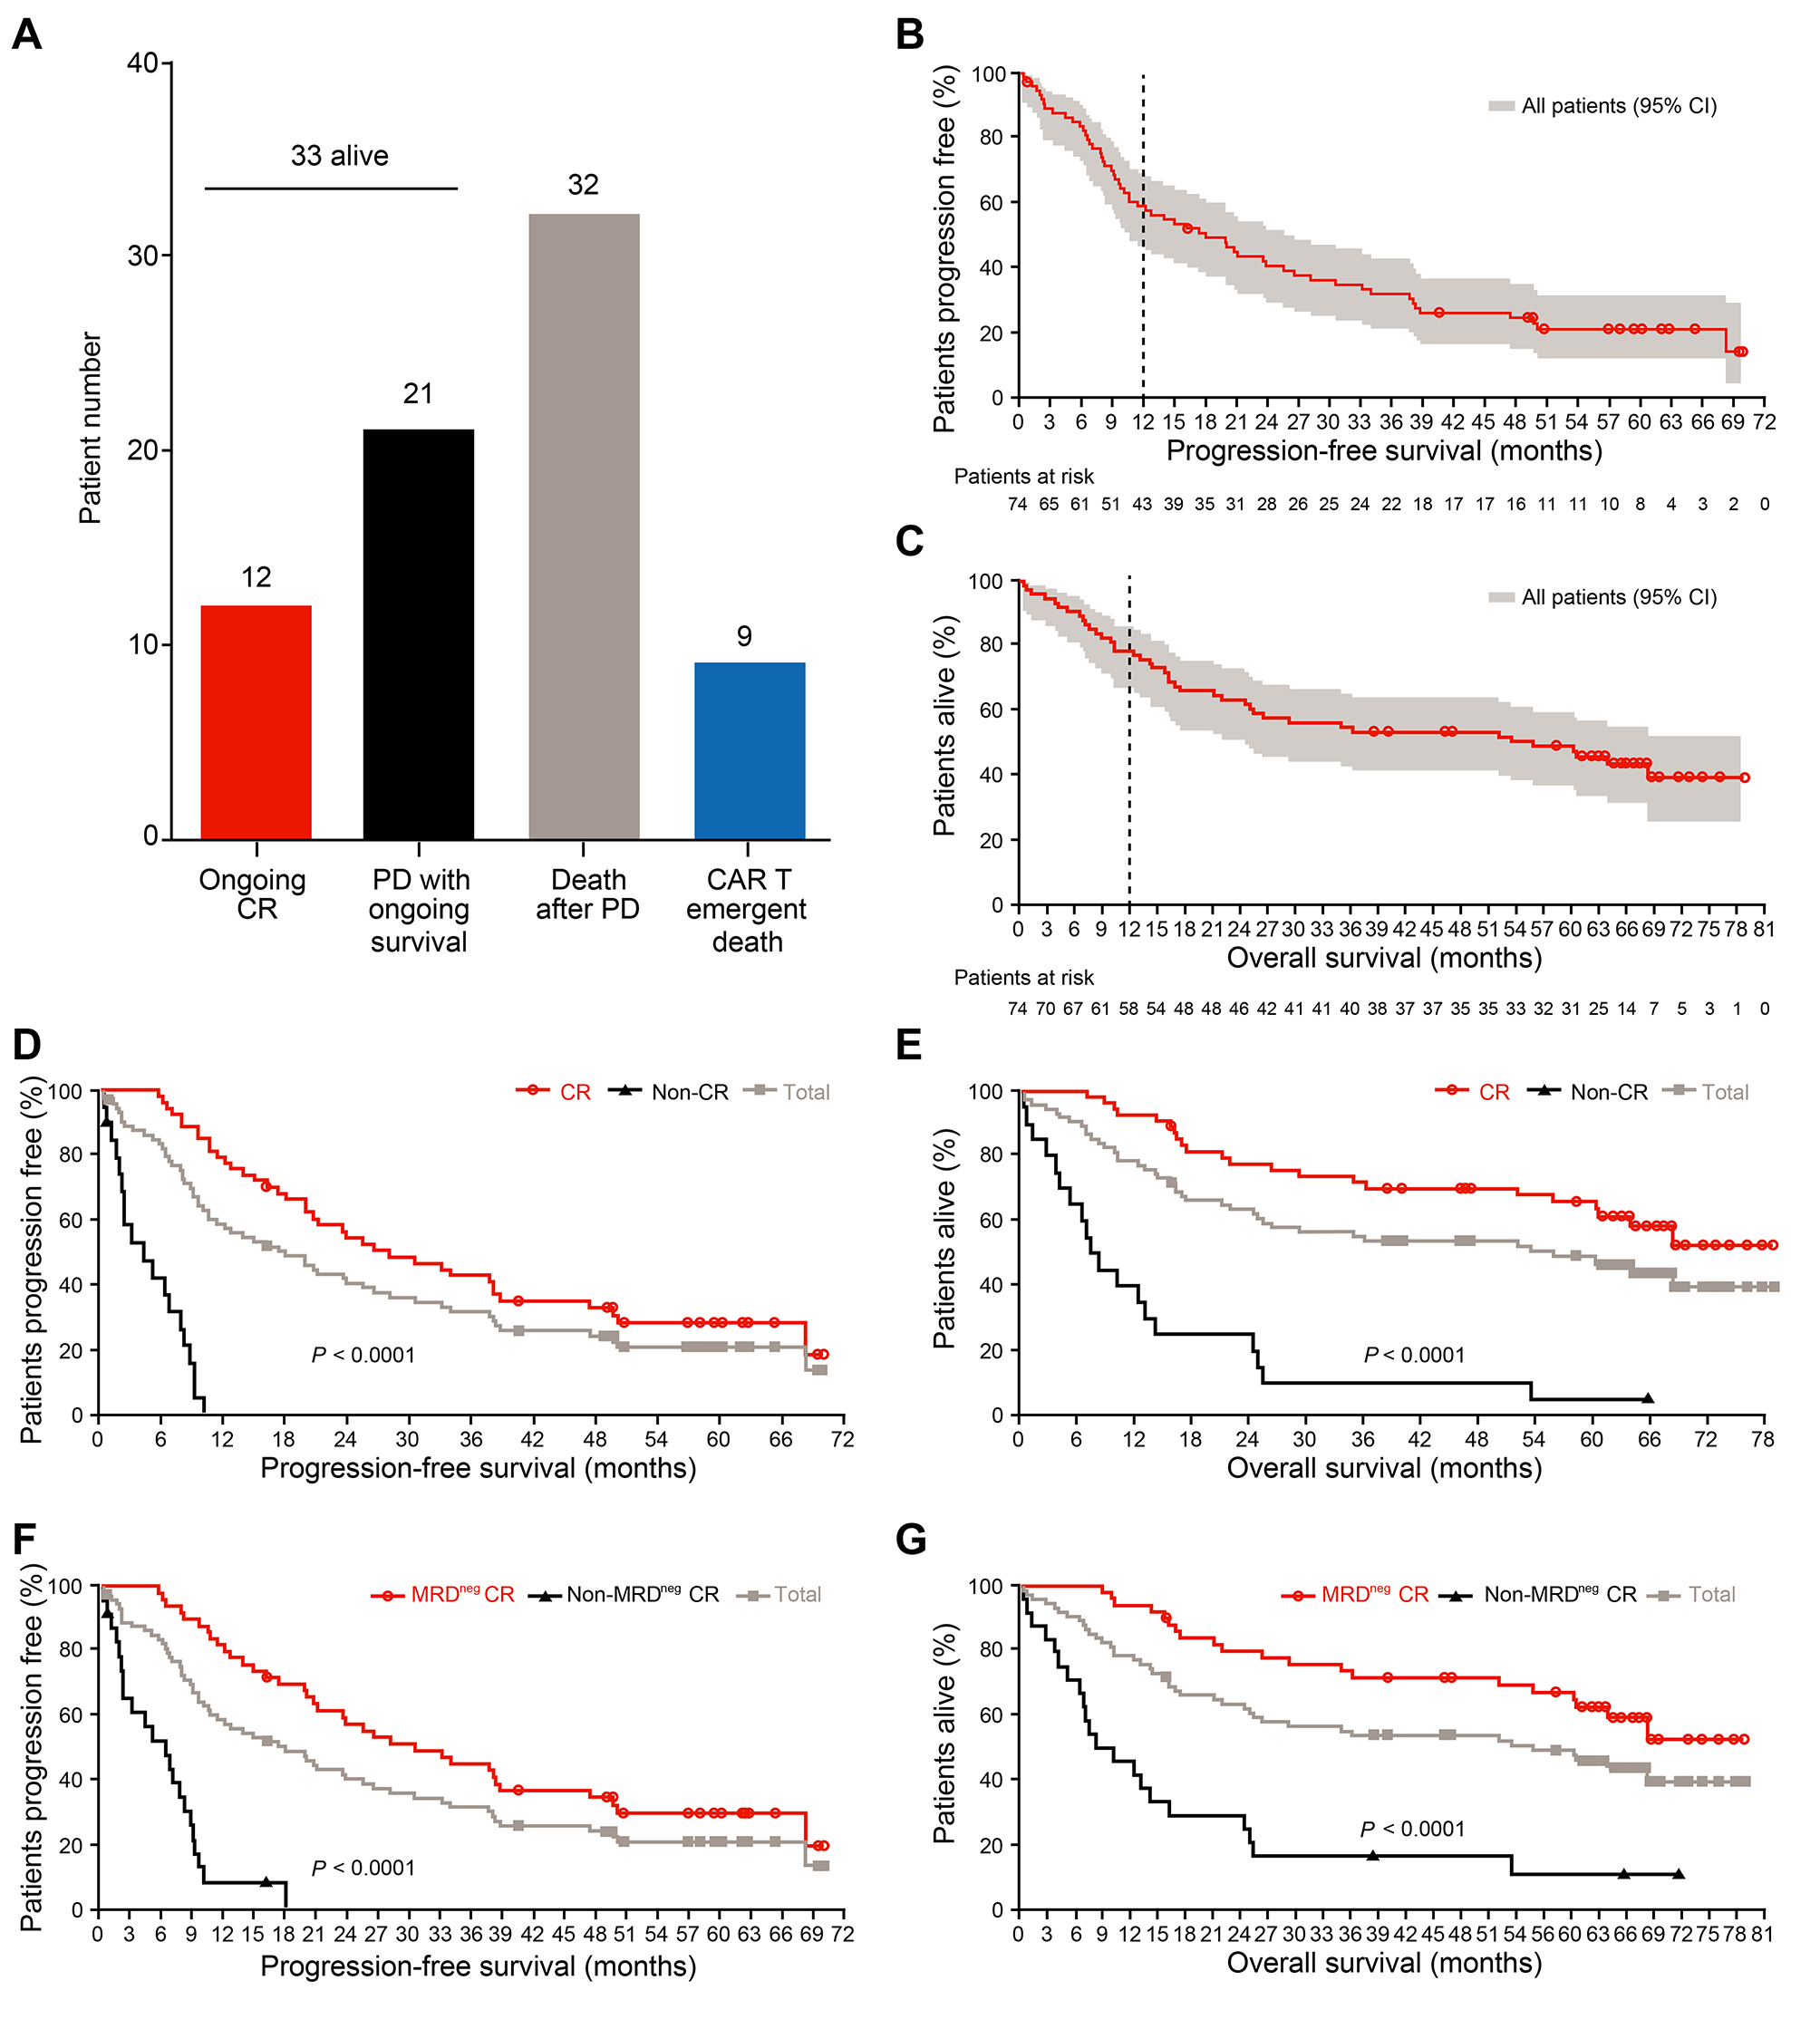
Table 1 Clinical relevance of baseline demographicsClinical significance of patients’ characteristicsAs previously reported [7], the ORR was 87.8% (65/74 patients). Fifty-four (73.0%) patients achieved complete response (CR), and 50 (67.6%) obtained deep remission with MRD negativity (< 10− 4). As of November 30, 2022, 33 (44.6%) patients were still alive. Notably, 12 (16.2%) remained relapse-free. The longest remission had been 6.4 years. Sixty-two patients suffered progressive disease (PD) and/or death (PD/Death). Among them, 53 appeared PD after partial response (PR) or better. Thirty-two died of PD and 9 were deceased owing to non-relapse events. Twenty-one PD patients had ongoing survival after receiving subsequent treatments (Fig. 1A).
Fig. 1
Long-term efficacy of LCAR-B38M. A) The column graph shows the number of patients with different survival states. CR: complete response; PD: progressive disease. (B, C) The Kaplan-Meier survival curves show the progression-free survival (PFS) rate (B) and the overall survival (OS) rate (C) of all 74 patients at a median follow-up time of 65.4 months. (D, E) The Kaplan-Meier survival curves compare the PFS (D) and OS (E) rates between the 54 patients achieving CR and the rest who did not have CR (Non-CR). (F, G) The Kaplan-Meier survival curves compare the PFS (F) and OS (G) rates between the two CR cohorts with (Non-MRDneg CR) and without (MRDneg CR) measurable residual disease (MRD), respectively
Patients with durable responses were more likely to have favorable baseline performance status (ECOG score = 0), IgG MM subtype, and no extramedullary disease compared with those who had PD/Death. Patients with lambda light chain MM had a tendency toward inferior outcomes although no statistical difference was reached. In addition, high-risk CA was not a poor prognostic factor in this trial (Table 1). Data suggested that use of combined preconditioning strategy with fludarabine and cyclophosphamide may confer a therapeutic advantage over cyclophosphamide alone (Table 1).
Long-term efficacyWith a median follow-up time of 65.4 months, the 5-year PFS rate was 21.0% (95% CI = 12.2%∼31.4%, Fig. 1B), and the 5-year OS rate was 49.1% (95% CI = 37.2%∼60.0%, Fig. 1C) across all treated patients. The PFS and OS curves progressively flattened over time. Among the 65 responders, the 5-year PFS and OS rates were 23.6% and 55.9%, respectively (Supplementary Fig. 2A and 2B). The survival status of the 54 CR patients was further improved. Their 5-year PFS and OS rates were respectively 28.4% and 65.7%, both being significantly higher than those without achieving CR (p < 0.0001, Fig. 1D and E). Such a meaningful benefit was more pronounced in the patients with MRD negativity relative to those with positivity (p < 0.0001, Fig. 1F and G). 24.0% (12/50) of the MRD-negative responders remained in deep remission with sustained responses at data cut off.
Median PFS and median OS respectively reached 18.0 and 55.8 months. For the subjects achieving CR and MRD-negative CR, the median PFS was prolonged to 28.2 and 30.6 months, respectively. Median OS was not reached for those patients (Supplementary Table 2 ∼ 5). Conversely, patients who did not obtain CR or better response showed inferior outcomes as they only had a median PFS of 4.4 months and a median OS of 7.9 months (Supplementary Tables 2 and 4). Median DOR for all patients was 23 months, and the MRD-negative responders displayed a significantly longer median DOR than the other responders (32.7 months versus 7.5 months, p < 0.0001, Supplementary Table 6). These data suggest that patients with an in-depth response are more likely to have favorable outcomes.
To evaluate if an early good response could lead to durable responsiveness, the relationship between the time to response and the remission persistence was assessed. It turned out that patients with longer time to best response (≥ 3.3 months) had longer PFS and OS compared with those achieving best response within 3.3 months (Fig. 2A and B). A late best response was associated with IgG subtype and higher ISS stage (Supplementary Table 7).
Fig. 2
Outcomes by time to best response. (A, B) The Kaplan-Meier survival curves compare the progression-free survival (A) and the overall survival (B) rates between the patients who reached the best responses shorter and longer than 3.3 months after CAR T cell infusions
Normal Ig recovery represents a steady-state condition of humoral immunity for the patients who achieved remission. In 26 CR patients with available Ig data, 21 were found to have serologically normal Ig levels. Only one patient’s Ig level turned normal at 5.4 years and the rest twenty were recovered by 5 years (Supplementary Table 8). The median time to a full restoration was 16.7 months with the earliest emerging at 9.1 months post-infusion. All patients who were persistently relapse-free had serum Ig recovery (Supplementary Table 8), implying a completely resolved humoral immunity. The 5-year OS rate of the 21 patients with CR and a full Ig recovery was 100% but was not significantly different from those five patients who had abnormal levels, probably because of an unbalanced sample size (p = 0.14, Supplementary Fig. 3). Patients in CR with a normal Ig level did not report serious infections.
It is noteworthy that the risk of progression still existed after 5-year remission. Disease relapse occurred at 68.3, 69.5, and 62.4 months post-infusion in three patients who had achieved MRD-negative CR (Supplementary Table 9). One patient developed extramedually lesion without detectable tumor in BM, and two patients had an increased level of monoclonal paraprotein. All proceeded with subsequent therapies.
Of 53 patients who progressed, 44 received subsequent treatments, most commonly PIs, followed by IMiDs, BCMA-redirected CAR T cell products, and anti-CD38 monoclonal antibody (Table 2). Of 36 patients with response data, 22 (61.1%) patients were responsive to the post-CAR T salvage therapies, obtaining PR or better. PI-based regimen induced the highest ORR (80.0%) and the highest CR rate (55.0%). Salvage treatment with anti-BCMA CAR T infusions only benefited 31.3% patients, which was lower than the previous ORR of 87.8% (Table 2). Most patients who gained a second remission had maintenance treatment. Two patients discontinued treatment after obtaining CR with autologous hematopoietic stem cell transplantation or anti-BCMA CAR T intervention. Importantly, 21 patients survived more than two years additionally after PD.
Table 2 Subsequent therapies for patients who had progressive diseases after LCAR-B38MLong-term safetyAll patients experienced treatment-emergent adverse events (TEAEs) during the first month of treatment. Cytokine release syndrome (CRS) was the most common TEAE and occurred in 68 (91.9%) participants. This complication was mostly limited to low grade and all clinically reversible. CRS resolved within 30 days of CAR T cell infusion for most patients, but three patients had extended CRS which lasted 31, 37, and 51 days. No second wave of CRS was observed. Grade 3/4 neutropenia, thrombocytopenia, and hepatic disorder were observed in 85.3%, 58.8%, and 38.3% of patients, respectively. One patient experienced transient Grade 1 immune effector cell-associated neurotoxicity syndrome. One patient died of suicide after a psychiatric disorder that developed following myeloma progression; the patient had no abnormal parameters indicative of movement and neurocognitive TEAEs.
By 6 months post-infusion, 47.3%, 44.6% and 59.5% of all patients reached normal leukocyte, hemoglobin and platelet levels, respectively, and median levels were 4.7 × 10⁹/L, 125.3 g/L and 155.0 × 10⁹/L, respectively (Fig. 3A ∼ C). The median levels of aspartate aminotransferase and alanine aminotransferase were 21.0 U/L and 18.5 U/L, respectively (Fig. 3D and E). No significant differences in hematologic and hepatic function recovery were found between non-PD and PD/Death groups (Fig. 3A ∼ E), indicating that safety profile does not influence the patients’ efficacy outcomes.
Fig. 3
Hematologic and liver function recovery by 6 months post-infusion. (A, B, C) The box plots show the levels of leukocyte (A), hemoglobin (B) and platelet (C) of all patients (Total), the patients with ongoing response (Non-PD) and the patients having progression disease and/or being deceased (PD/Death). (D, E) The box plots show the levels of aspartate aminotransferase (D) and alanine aminotransferase (E) of all patients, as well as the patients with Non-PD and PD/Death. (F) The curves display the circulating lymphocyte counts of Non-PD, PD/Death and all patients
Virus reactivation or infection was observed beyond 6 months of follow-up but no severe situation was reported. Herpes zoster virus involvement was documented in 3 patients and hepatitis B virus in one patient. These affected patients recovered after anti-viral drugs and Ig administration. Medical history of COVID-19 infection was obtained from 19 surviving patients, of whom six were negative and 13 had been infected during the global pandemic period (years 2020 ∼ 2022). All 13 affected patients presented with self-limiting symptoms, such as low fever, cough, and fatigue. These physical signs lasted from 1 to 3 days variably. No COVID-19-related pneumonia or death was reported. The transgene-specific replication-competent lentivirus had been undetectable in the routine test. Uncontrollable lymphocyte expansion under the circumstance of viral infection was not observed.
To the cut-off date, four patients developed SPM of the lung, esophagus, and cervix at 8 ∼ 32 months after LCAR-B38M treatment. All achieved myeloma remission and had no concurrent hematological malignancies detectable with the SPM. Three patients eventually died of SPM. One patient was cured of cervical cancer but had a MM relapse at 50.0 months post-infusion, and achieved CR after treatment with bortezomib and lenalidomide.
CAR T cells kineticsDuring an observatory period up to 180 days after CAR T cell infusion, the average circulating lymphocyte counts rose to a peak level at 14 ∼ 28 days, and gradually declined after 1 month (Fig. 3F). Though the average lymphocyte count peaks of the non-PD cohort tended to be higher than that of PD/Death patients as CAR T expanded (Fig. 3F), a high peak level of LCAR-B38M did not correlate with CR and durable remission in 16 patients with available transgene data (Supplementary Fig. 4A and 4B). The long duration of the transgene persistence (Tlast) was theoretically relevant to favorable outcome. Patients who achieved very good partial response or better had a longer Tlast compared with those having PR or worse (421.0 days versus 141.8 days at median, p = 0.032). Notably, patients with a longer time to best response had longer CAR T cell persistence compared to those with shorter time to best response (535.3 days versus 261.6 days at median, p = 0.001) (Table 3). However, in the long-term observation, long persistence of CAR T cells did not confer a durable remission (Table 3).
Table 3 Prognostic relevance of TlastAs of the cut-off date, CAR T cells remained detectable in one patient who had maintained MRD-negative CR for 5.6 years at the last follow-up (Supplementary Table 9). The immunophenotype of the long-persisting CAR T cells was examined at 2 months, 1 year, 3 years, and 5 years after infusion using a 41-antibody panel (Supplementary Table 10). CAR T cells labeled by an anti-camelid VHH antibody made up 3.01%, 1.04%, 0.49%, and 0.24% of the CD45+ nucleated cells in circulation at the four time points, respectively. Based on the marker expression profile (Fig. 4A and Supplementary Fig. 5), the CAR T cell pool could be assigned into 9 clusters (denoted as C1 ∼ 9) using the algorithm of t-SNE clustering (Fig. 4B and Supplementary Fig. 6A). Signature markers first distinguished three major subsets: CD4+ (C6), CD8+ (C1 ∼ 3, C5) and CD4−CD8− (C4, C7 ∼ 9) (Fig. 4C). Surprisingly, the CD4−CD8− subset expanded proportionately with time, accounting for 91.6% of all CAR T cells at 5 years. The CD8+ subset was less than 10% and CD4+ engineered cells were barely detectable (Fig. 4C). We further found the CD4/CD8 double negative (DN) CAR T subset at later time points exhibited high levels of HLA-DR, CCR7, CD27, CD28 and CD107a, comparable levels of Ki67 and CD38, and low levels of GZMB, PD-1 and Tim-3 as compared to that at initial treatment phase (Fig. 4D and Supplementary Fig. 6B). In the CD8+ subset, Ki67 and HLA-DR levels were similar at 2 months and 5 years, but expression of GZMB and PD-1 was decreased at 5 years (Fig. 4D and Supplementary Fig. 6B). Compared with host T cells (CD3+VHH−), CAR T cells (CD3+VHH+) featured regular proliferation with Ki67 moderately expressed, functional activation with PD-1 and CD57 down-regulation, and low cytotoxicity with reduced GZMB and CD107a expression at the 5-year time point (Fig. 4E).
Fig. 4
Immunophenotypic characterization of a long-lived CAR T population in a single patient. (A) Heatmap shows normalized expression of 33 surface markers of CAR T cells for nine clusters identified with FlowSom. CAR T population was gated upon CD45+CD11b−CD11c−CD66b−CD19−CD14−CD7+CD3+VHH+. Relative frequencies are displayed as a bar graph to the right bottom. (B) t-SNE map displays CAR T cells in the four samples of different time points. Cells are colored by FlowSom cluster. (C) The left upper panel shows three subsets of CD4+, CD8+ and DN CAR T cells in the four samples of different time points. The left bottom panel shows the cluster disposition of each CAR T cell subset. The right panel shows the frequencies of 9 clusters in individual sample. DN: CD4 and CD8 double-negative. (D) The violin plots display the immunophenotypic expression of Ki67, HLA-DR, CCR7, GZMB and PD-1 of CD4+, CD8+ and DN CAR T cells of the four samples. p values were statistically calculated by comparing the mean marker expression of the sample of 5 years to that of 2 months. (E) The violin plots compare the expression levels of Ki67, GZMB, CD107a, PD-1 and CD57 between the CAR T cells (CD3+VHH+) and the host T cells (CD3+VHH−). The abbreviations for month and year are mo and yr, respectively
留言 (0)