The methodology of this study has been published in detail [1]. A summary follows.
Ethics
The Ethics Review Board of King Abdullah International Medical Research Centre approved the protocol. The study was conducted in accordance with the Declaration of Helsinki [5]. All participants gave informed consent before taking part.
Data protection legislation was complied with. Personal data were anonymised during analysis and dissemination.
Study design
This was a cross-sectional survey of the adult population (aged 18–65 years) of KSA. It included 2,316 randomly selected individuals from all 13 regions of the country [1], well above the recommended minimum sample size of N = 2,000 [4] As a culturally mandated modification, we engaged with participants by cellphone using random digit-dialling rather than by unannounced door-to-door visits (the usual, and better method [4]). Trained interviewers, with nursing or other health backgrounds, interviewed eligible and willing respondents (participating proportion 86.5% [1]). The structured Headache-Attributed Restriction, Disability, Social Handicap and Impaired Participation (HARDSHIP) questionnaire [3] translated into Arabic [6] was used for the interviews.
Headache diagnoses
The headache screening question was “Have you had a headache during the last year”. Those answering yes were asked diagnostic questions; when headaches of more than one type were reported, participants were instructed to focus in this enquiry on whichever was the most bothersome. Diagnoses were made algorithmically, with headache on ≥ 15 days/month (H15+) identified first. This was classified as pMOH when associated with reported regular use of headache medication on > 3 days/week, and otherwise as other H15+. In remaining participants, definite migraine, definite TTH, probable migraine and probable TTH were diagnosed, in that order, in accordance with ICHD criteria [7].
Further enquiry included the question “Did you have a headache yesterday?” (HY).
Headache-attributed burdenSymptom burden
We estimated symptom burden at individual level in terms of frequency, duration and intensity of headache. Frequency, reported in days/month, and usual duration, reported in hours or minutes, but expressed for analysis in hours, were treated as continuous variables. Usual intensity, reported as “not bad”, “quite bad” or “very bad”, was converted into a numerical scale (1, 2 or 3). Proportion of (all) time spent in ictal state (pTIS) was calculated by multiplying headache frequency and duration and dividing by the total time available (30 days*24 hours). Since frequency was recorded in days/month, not attacks/month, duration was capped at 24 in these calculations.
Duration and intensity of HY were also recorded. pTIS for those with HY was calculated by dividing duration by 24 h.
For migraine and TTH, headache-attributed lost health was computed by multiplying pTIS by the appropriate disability weight (DW) from the Global Burden of Disease study [8].
Impaired participation
Two separate means of enquiry were used to estimate impaired participation at individual level.
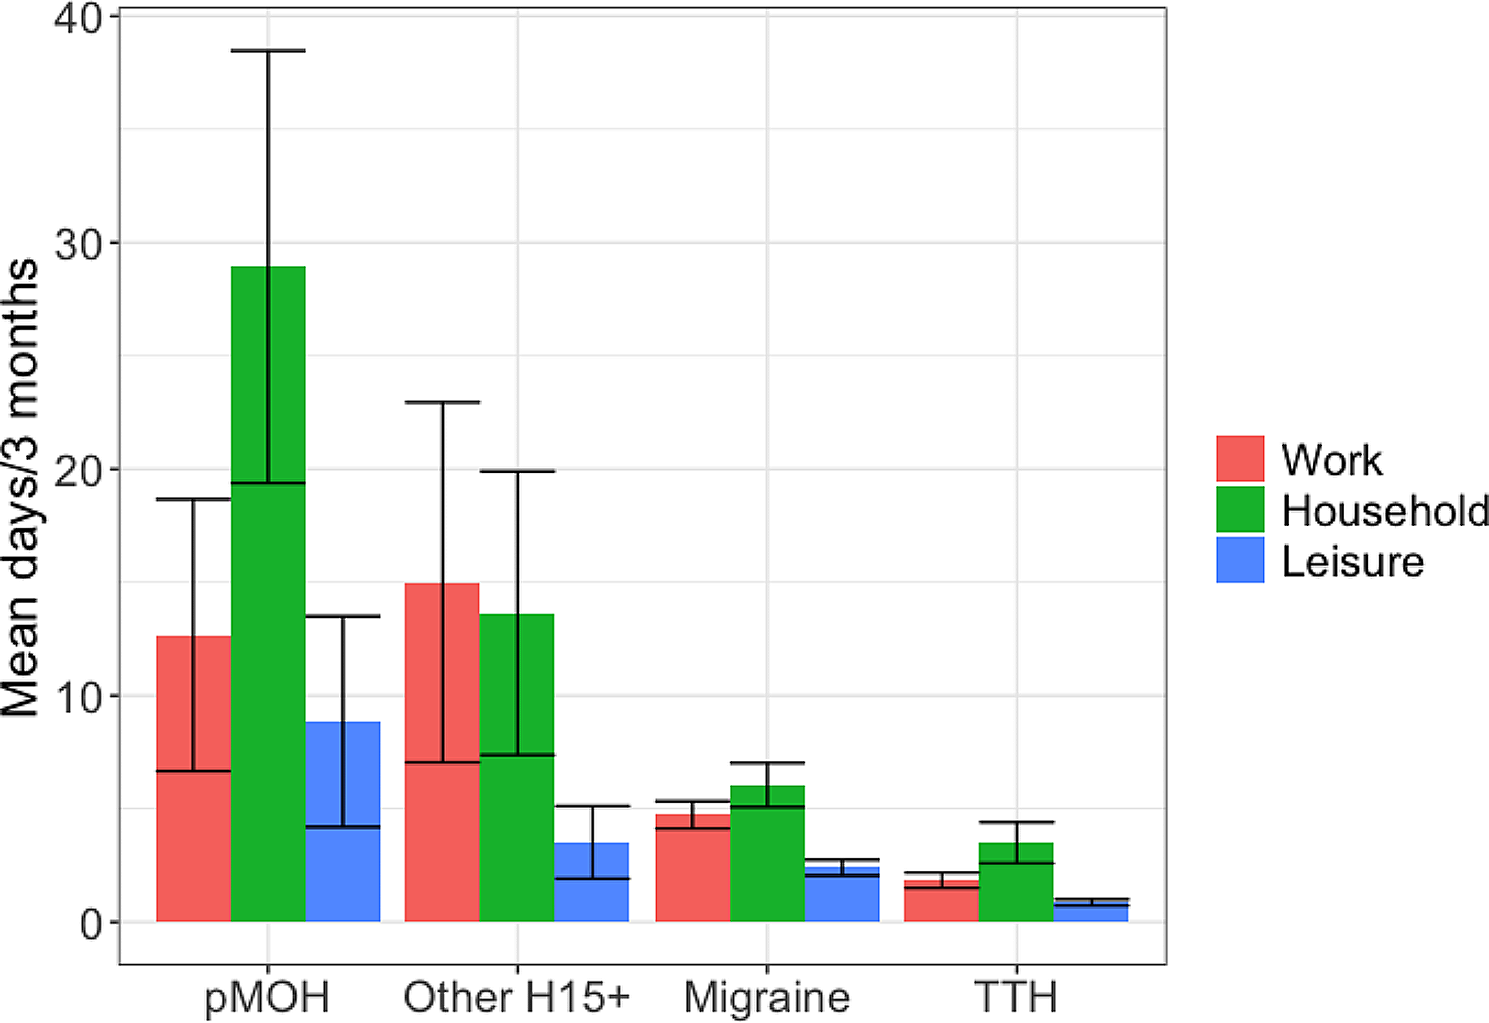
The first used the headache-attributed lost time (HALT-90) questionnaire [9]. Its five questions distinguished between impaired participation resulting in lost productivity, separately from paid (questions 1 and 2) and household work (questions 3 and 4), and lost social or leisure time (question 5) over the preceding 3 months [9]. For the former, days of nothing or less than half achieved were totalled in accordance with accepted methodology [9] (counterbalanced by interpreting more than half achieved as everything achieved). For the latter, we counted reported days of missed social or leisure activity or occasions.
The second enquiry was into impaired participation yesterday among those with HY, without distinguishing between paid or household work and social activity. Response options were everything, more than half, less than half or nothing achieved yesterday of whatever had been planned. Again we took less than half as nothing achieved, and, in counterbalance, more than half as everything achieved.
Population-level estimates
pTIS, lost health and impaired participation at population level were calculated by factoring in prevalence estimates and adjusting for age and gender.
We were also able to make population-level estimates of pTIS and lost productivity based on HY, factoring in 1-day prevalence of any headache and again adjusting for age and gender. We chose to do this only for all headache, recognizing that ICHD criteria do not permit diagnosis of individual headache episodes [7]. We could infer the diagnosis of HY whenever headache was of only one type, or HY was reported to be of the same type as the (diagnosed) most bothersome headache, but our inability to do so in all cases precluded estimation of 1-day prevalence of each type.
Health-care needs assessment
We defined “need” for health care in terms of numbers likely to benefit from health care, setting opinion-based criteria for bothersomeness, likelihood of negative impacts on participation and quality of life, and expectation of need for prescription medication (including preventative). Accordingly, we counted all participants with H15+, all those with migraine on ≥ 3 days/month, and those with migraine or TTH who met one or both of the following criteria: a) pTIS > 3.3% and intensity ≥ 2 (moderate-severe); b) ≥ 3 lost workdays and/or lost household days during the preceding 3 months. These counts were adjusted for age- and gender-composition of the sample to yield population estimates.
Statistics
Means, standard deviation (SDs), standard errors of the mean (SEMs) and medians were used to describe continuous variables. Group-differences were examined using ANOVA for continuous variables and chi-squared tests for categorical variables.
Statistical analyses were conducted using SPSS version 28 for statistical analysis (SPSS, INC, Chicago, IL). The threshold for significance was set at p < 0.05.


留言 (0)