Microorganisms, vitamin D3, culture medium
A. hyovaginalis CCASU-A11-2 was deposited in the Culture Collection Ain Shams University and was proven to convert vitamin D3 into calcitriol (Abbas et al. 2023). It was cultured and preserved as previously reported in our previous study (Miller 1972) (Abbas et al. 2023). Vitamin D3 was generously supplied by Medical Union Pharmaceuticals (MUP), Cairo, Egypt, and calcitriol was procured from Sigma-Aldrich, St. Louis, MO, USA. The culture medium was formulated as previously reported and the pH was adjusted to pH 7.8 (Abbas et al. 2023). The phosphate-buffered salt solution was formulated as previously described (Abbas et al. 2023).
Preparation of the cell lysate
A single colony of the study isolate from the nutrient agar was inoculated into a 10 mL nutrient broth (seed culture; Oxoid, ThermoFisher Scientific, London, UK) contained in a 100-mL Erlenmeyer flask, incubated at 30 °C and 200 rpm for two days. An aliquot (1 mL) of the obtained seed culture was used to inoculate the 50 mL medium used for the main culture of study isolate contained in a 250 mL Erlenmeyer flask (main culture), incubated at 30 °C and 200 rpm for 48 h. Then centrifugation was carried out at 5000 rpm for 10 min, the sediment was re-suspended in 10 mL phosphate buffered salts solution, and transferred to a 50 mL beaker. The cells were then lysed via sonication using a probe sonicator device adjusted at 70% amplitude as previously reported (Abbas et al. 2011b).
Primary fractionation of the crude cell lysate
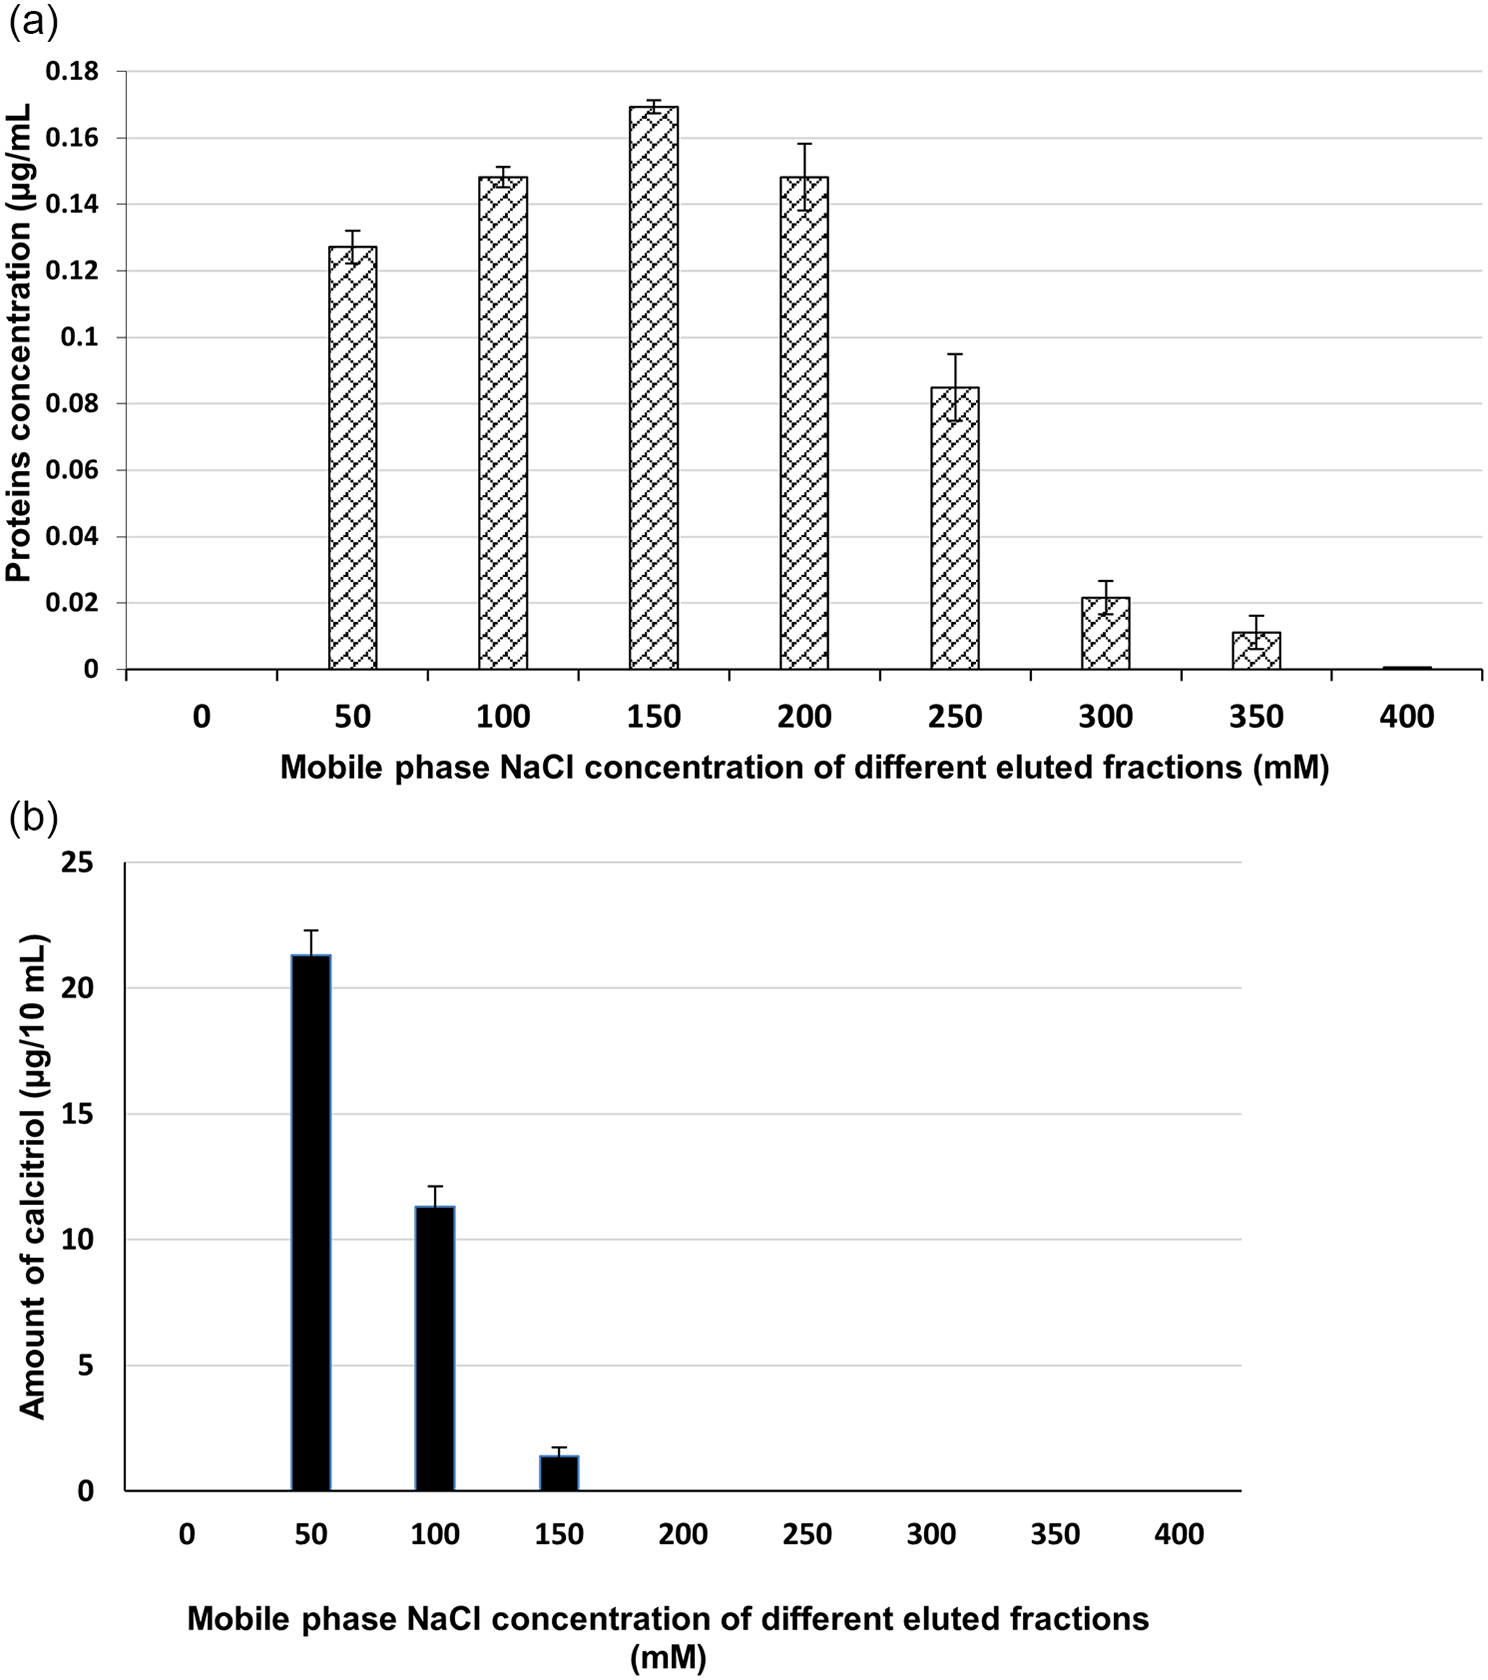
The resultant crude cell lysate suspension, produced above, was then freeze-dried at -50˚C using a laboratory scale freeze-dryer (CoolSafe 55, ScanLaf A/S, Lynge, Denmark) under vacuum at 30 (psi) for 48 h. The powder obtained was dissolved in not more than 2 mL 20 mM Tris-HCl buffer and subjected to fractionation via column chromatography using DEAE–Sepharose CL-6B as a stationary phase and different concentrations (0-400 mM) of NaCl in 20 mM Tris-HCl (pH 7.4), as the mobile phase (Sawada et al. 2004).
The column chromatography process was as follows: stationary phase (50 g) was soaked in 50 mL 20 mM Tris-HCl buffer (pH 7.4) for 24 h, for equilibration. The soaked stationary phase was then packed in a glass column (2 cm inner diameter by 30 cm length) and column conditioning was carried out with 20 mM Tris-HCl (pH 7.4). The sample solution was applied onto the column bed and elution was started using 50 mL of 20 mM Tris-HCl (pH 7.4, containing no NaCl), at a flow rate of 1mL/min. The eluate was collected in a 100-mL Erlenmeyer flask. The elution process was then continued using 50 mL of subsequently increasing concentration of NaCl in 20 mM Tris-HCl (50, 100, 150, 200, 250, 300, 350, and 400 mM NaCl). The eluates obtained for the corresponding NaCl concentrations were separately collected in 100-mL Erlenmeyer flasks.
Determination of the effect of ammonium sulfate on vitamin D3 bioconversion activity of eluted fractions
Proteins were recovered from the collected fractions by the addition of ammonium sulfate at 40% w/v saturation and equilibration for 30 min at 4 °C (Andriani et al. 2012), subsequent centrifugation at 6000 rpm for 10 min, and collection of the residue. The protein residue of each fraction was suspended in 10 mL phosphate buffered salts solution, contained in a 100-mL Erlenmeyer flask, inoculated with 10 mg vitamin D3, dissolved in 250 µL 96% ethanol and incubatd at 28 °C for 6 h. The reaction mixtures were extracted and analyzed, for calcitriol production, using HPLC as previously reported (Abbas et al. 2023b).
Determination of the effect of ammonium sulfate on vitamin D3 bioconversion activity of eluted fractions
This was carried out by pooling the fractions with main vitamin D3 bioconversion activities into one fraction (100 mL) which was then divided into four aliquots (each of about 25 mL). Protein contents of these aliquots were recovered, by ammonium sulfate precipitation, and treated for testing their vitamin D3 bioconversion activities, as previously described, except that:
(і) One aliquot coded A, was subjected to no ammonium sulfate addition.
(іі) The three remaining aliquots, coded A2%, A5%, and A10%, were subjected to ammonium sulfate additions at 2, 5, and 10% w/v concentrations, respectively.
The results obtained were recorded and compared.
Secondary fractionation
The concentrations of NaCl, in the mobile phase, that eluted fractions with main vitamin D3 bioconversion activities were determined. After that, re-fractionation of the crude cell lysate of the study isolate was carried out as previously described, but using mobile phase volumes with NaCl concentrations, corresponding to those of eluted fractions having main vitamin D3 bioconversion activities, as follows:
(i)
An 80 mL volume of mobile phase, with NaCl concentration corresponding to the lowest concentration that eluted fraction with main vitamin D3 bioconversion activity, was applied as multiple aliquots (each of 10 mL).
(ii)
A 10 mL volume of mobile phase, with NaCl concentration corresponding to the highest concentration that eluted fraction with main vitamin D3 bioconversion activity, was applied once as a single aliquot.
(iii)
A 10 mL volume of mobile phase, with NaCl concentration corresponding to that in between the lowest and highest concentrations that eluted fractions with main vitamin D3 bioconversion activities, was applied once as a single aliquot.
Studying the effect of some factors on vitamin D3 bioconversion by the chromatographic active fraction
In this experiment, the mobile phase volume required for the complete elution of vitamin D3 bioconversion active protein, as determined previously, was subjected to stepwise addition in the form of 10 mL aliquots. Each aliquot was added near finishing the volume of the proceeding one. The eluates, obtained at the end of the applied addition regimen, were collected as a single fraction, (chromatographic active fraction). This fraction was subjected to bioconversion activity measurements, under different reaction conditions.
Effect of different pH values
The chromatographic active fraction was tested for its vitamin D3 bioconversion activity,, under different pH values including 6, 7, 7.5, and 8.5 as previously described by Abbas et al. (2023). The results were compared to those obtained at the pH value 7.8. This experiment was done in triplicate and both the mean and standard deviations were calculated.
Effect of different reaction temperatures
The chromatographic active fraction was tested for its vitamin D3 bioconversion activity, as previously described, under different temperature values bracketing the used temperature value (28 °C). These included 25, 30, and 37 °C. The results were compared to those obtained at 28 °C. This experiment was done in triplicate and both the mean and standard deviations were calculated.
Effect of different reaction times
The bioconversion reaction was carried out for 6 h. Other reaction times were tested, including 3, 9, and 12 h. The experiments were completed as previously described and the results were compared to those obtained at 6 h. This experiment was done in triplicate and both the mean and standard deviations were calculated.
Extraction of vitamin D3 and calcitriol
The extraction process was carried out as previously reported (Bligh and Dyer 1959), and (Abbas et al. 2011b). This experiment was done in triplicate and both the mean and standard deviations were calculated.
High-performance liquid chromatography
The condition and the methods of HPLC analysis was carried out as previously reported (Abbas et al. 2023).
Measurement of protein concentration
The total protein concentrations, in different experiments, were measured using the Bradford assay (Bradford 1976), using the available commercial reagent (Sigma-Aldrich, St Louis, MO, USA) and following the manufacturer’s manual. The protein concentration was calculated as previously reported (Bradford 1976).
Statistical analysis
Statistical analysis presented as mean ± Standard Deviation (S.D.) through the use of Excel Microsoft Office 365.


留言 (0)