
記住我


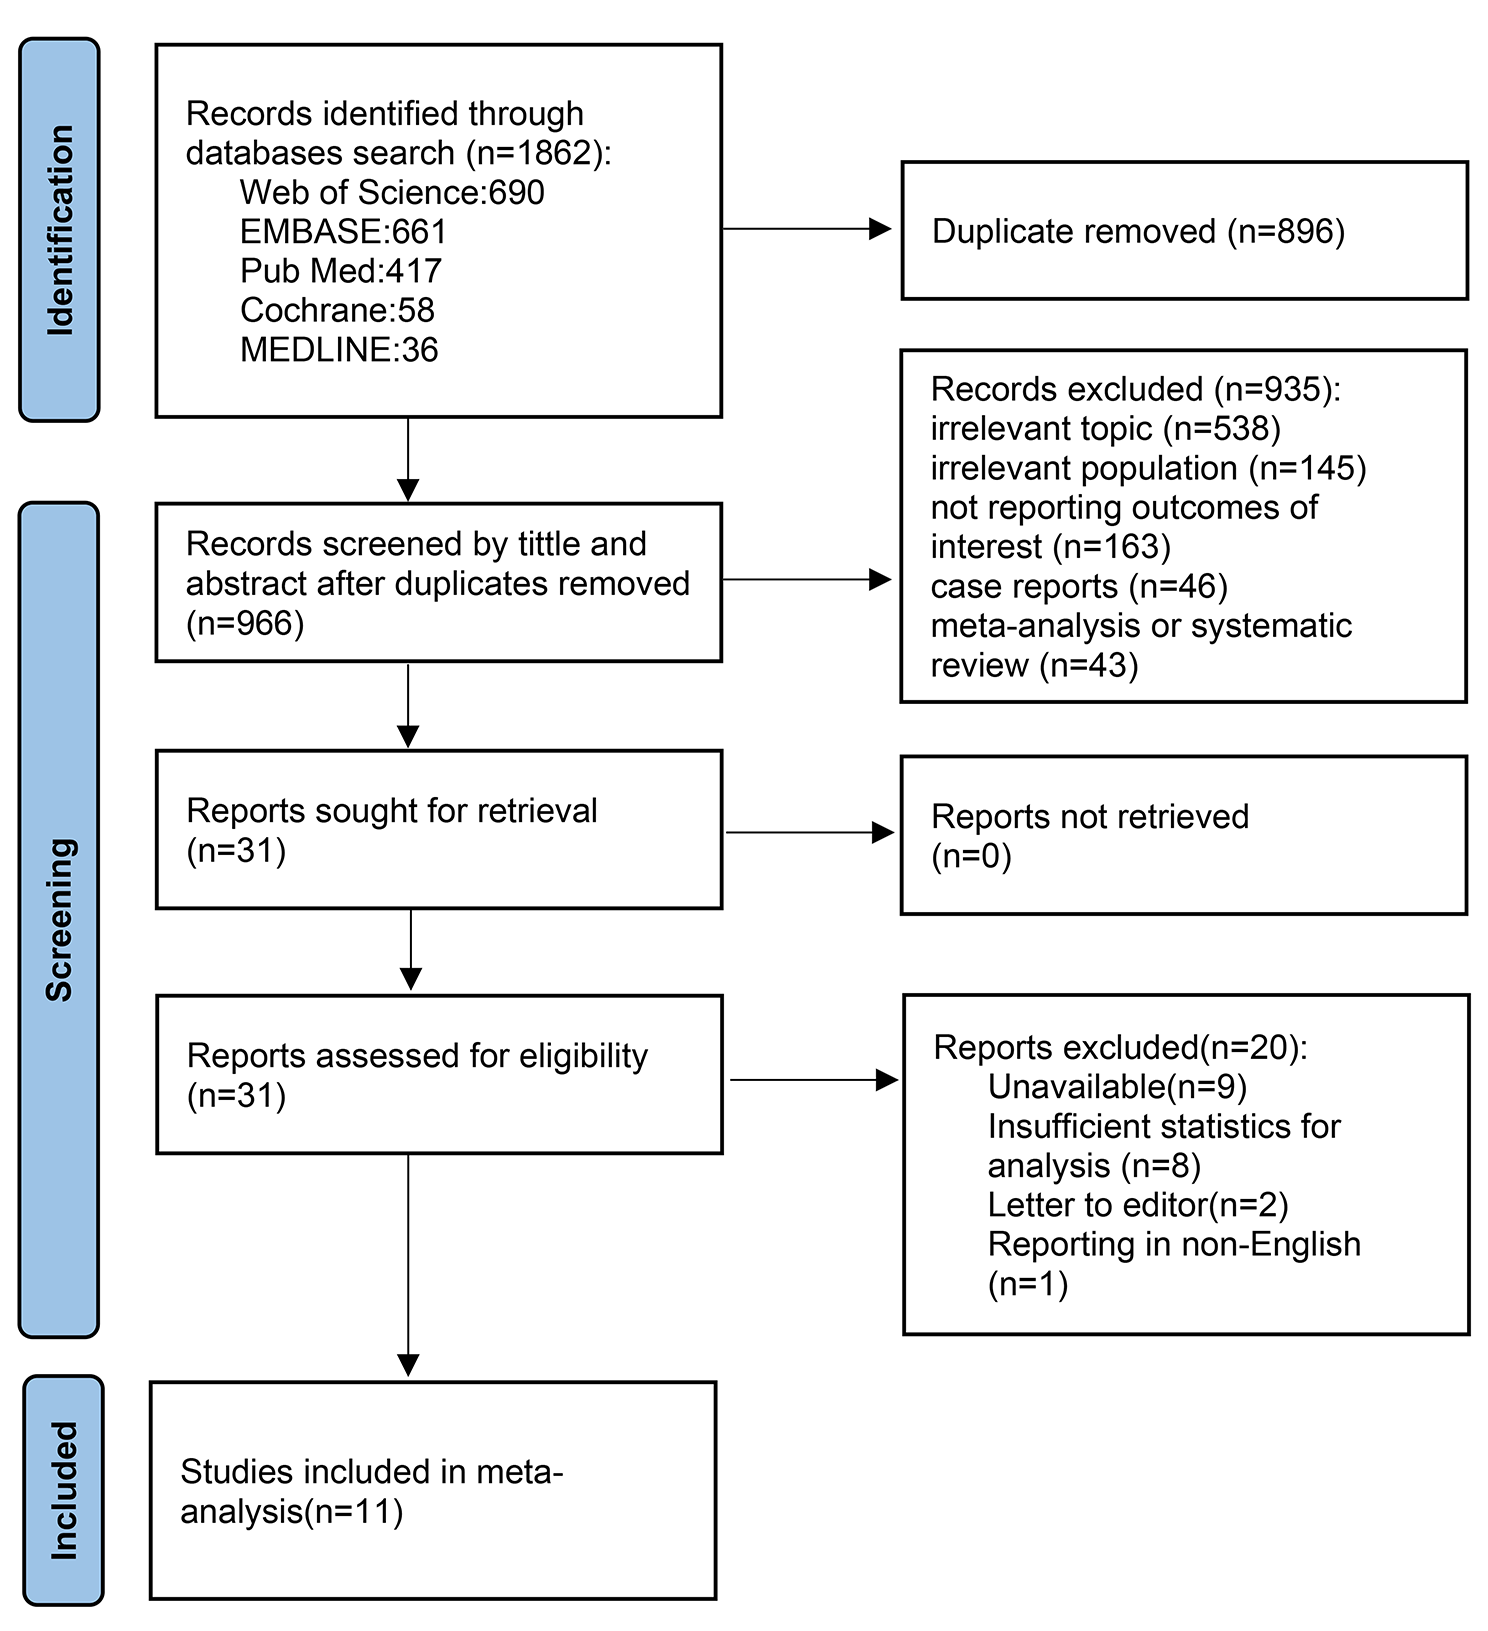


The search resulted in a total of 2465 references, with 1179 records filtered for duplication using Covidence. Manual identification then uncovered an additional eight duplicates. After reviewing titles and abstracts, 163 citations were considered for full-text article examination. Of these, 149 studies were excluded for various reasons, including non-English language (n = 9), incorrect setting (n = 6), incorrect outcomes (n = 3), outcomes for deep locations unspecified (18), incorrect intervention (n = 5), incorrect study design (n = 25), less than 10 patients (n = 9), incorrect patient population (n = 6), subgroup of a published study (n = 3), overlapping studies from the same institution (n = 35), abstracts, presentations, editorials, comments (n = 28). Additionally, two duplicates were identified. Regarding overlapping data, when multiple publications originated from the same cohort, we included the dataset from the largest cohort. Finally, 14 studies eligible for at least one analysis were chosen in the current study [1, 7, 8, 11, 12, 15, 17, 19,20,21,22,23, 25, 27]. The updated PRISMA flow diagram (Fig. 1) illustrates the study selection process.
Fig. 1
PRISMA flow chart of study selection process
Study, patient, and ICM characteristicsOut of the 14 studies incorporated into the analysis, 12 were retrospective cohorts, one was a case-control study, and one was a prospective clinical observation trial. Notably, 12 studies were conducted at single-center institutions, with the remaining two being multicenter studies. Patients were treated between 1987 and 2021 at a diverse array of institutions throughout the world. The analysis included a total of 850 patients with 855 ICMs who underwent single-fraction SRS. The mean age ranged from 36.6 to 43.1 years (median: 39.5 - 43.7). Among the 14 studies, 13 reported sex information for 640 patients, revealing that 324 (50.6%) were male. Of 855 deeply located ICMs, the brainstem was the most common location (67%), followed by basal ganglia and thalamus (31.2%), cerebellar peduncles (0.23%), and unspecified locations (1.5%). (Table 1)
Table 1 Baseline characteristics of 850 patientsSRS dosimetric parametersThe mean target volume varied from 0.282 to 3.2 cm3 (median range: 0.24 - 1.6 cm3). Among the different technologies used, the Gamma Knife was employed in 13 out of 14 studies and LINAC in 1 studies. No proton studies met the eligibility criteria. The mean margin dose ranged from 11 to 14.8 Gy (median range: 12 - 15 Gy) in a single fraction, and the mean isodose line ranged from 50 to 62.14% (median: 50%). The mean follow-up duration spanned from 38.9 to 111.72 months (median range: 32 - 121.9 months) from the time of SRS (Table 1).
Annual hemorrhage rateIn comparing the pre-SRS annual hemorrhage rate to the total post-SRS follow-up period annual hemorrhage rate for deep-seated locations, the pooled risk ratio (RR) was 0.13 (95% confidence interval [CI], 0.11–0.16; P <0.0001, Fig. 2A). There was low heterogeneity among the included studies (p=0.14, I2 = 30%). In particular, when considering the 9 studies reported comparison of pre- SRS and total post-SRS annual hemorrhage rate of brainstem alone, the pooled RR was 0.13 (95% confidence interval [CI], 0.10–0.17; p <0.0001; heterogeneity, p =0.65, I2 = 0%, eFigure 2). The funnel plot revealed no apparent publication bias (eFigure 3), and Egger’s regression results indicated absence of statistically significant publication bias (t = -0.39, df = 12, p-value = 0.7051).
Fig 2
Forest plots of annual hemorrhage rate comparing pre-SRS and total post-SRS (A), pre-SRS and first 2 years post-SRS (B), pre-SRS and after 2 years post-SRS (C), and first 2 years post SRS and after 2 years post-SRS (D)
When comparing the pre-SRS hemorrhage rate to the first 2 years post-SRS rate for deep-seated locations, the pooled RR was 0.22 (95% CI, 0.18–0.28; P <0.0001, Fig. 2B). There was moderate heterogeneity among the included studies (p=0.03, I2 = 39%). In comparing the pre-SRS annual hemorrhage rate to the first 2 years post-SRS follow-up period annual hemorrhage rate for brainstem alone, the pooled RR was 0.19 (95% confidence interval [CI], 0.14–0.27; P <0.0001; heterogeneity, p =0.50, I2 = 0%, eFigure 4). Visual examination of the funnel plot suggested no potential publication bias (eFigure 5), and the results of Egger’s regression confirmed the absence of publication bias (t = -1.62, df = 12, p-value = 0.1304).
When comparing the pre-SRS hemorrhage rate to the post-SRS rate after 2 years for deep-seated locations, the pooled RR was 0.07 (95% CI, 0.05–0.09; P <0.0001, Fig. 2C). Notably, there was no significant heterogeneity among the included studies (p=0.99, I2 = 0%). In particular, when considering the pre- SRS and total post-SRS annual hemorrhage rate of brainstem alone, the pooled RR was 0.07 (95% confidence interval [CI], 0.05–0.10; p <0.0001; heterogeneity, p =0.96, I2 = 0%, eFigure 6). Visual examination of the funnel plot suggested absence of potential publication bias (eFigure 7), and the results of Egger’s regression confirmed the absence of publication bias (t = -0.12, df = 12, p-value = 0.9051).
Finally, there was a significant difference in the annual hemorrhage rate between the first 2 years post-SRS and after 2 years post-SRS rate for deep-seated locations (RR = 0.34; 95% CI, 0.24 – 0.48; P < 0.00001, Fig. 2D). Notably, there was no significant heterogeneity among the included studies (p=0.44, I2 = 0%). Furthermore, there is significant difference in the annual hemorrhage rate between the first 2 years post-SRS and after 2 years post-SRS rate of brainstem alone (RR = 0.37; 95% CI, 0.23 – 0.59; P < 0.00001; heterogeneity, p =0.35, I2 = 10%, eFigure 8). Visual examination of the funnel plot suggested no potential publication bias (eFigure 9), which was confirmed with Egger’s regression (t = 0.30, df = 12, p-value = 0.7706).
Lesion volume changes and radiation-induced changesOf ten studies assessing ICM volume changes, including 461 patients, 204 individuals demonstrated a reduction in lesion volume, accounting for 44.25% (Table 2). Stability in ICM volume was observed in 170 cases out of 303 patients across eight studies, yielding a pooled stable volume of 56.1%. Conversely, an increase in ICM volume (most studies reported as uncertain whether it resulted from true lesion progression or pseudo-progression due to radiation-induced changes or hemorrhage) was noted in 7 patients out of 303 across eight studies, constituting a rate of 2.3%.
Table 2 Lesion volume changes of the deep-seated intracranial cavernous malformations after SRSThe pooled proportion of patients who developed symptomatic RIC was 9% (95% CI, 7–11). There was no significant heterogeneity among the studies (I2 = 14%; P = 0.3; Publication bias, Egger test, P = 0.0011) (e10). Subgroup meta-analysis estimated the proportion of patients who developed symptomatic RIC as 8% (95% CI, 6–11; I2 = 33%) in the studies having a marginal dose of ≤13 Gy compared with 11% (95% CI, 7–15; I2 = 0%) in those having a marginal dose of >13 Gy (eFigure 11). The overall estimate of the proportion of patients who developed permanent AREs was 3% (95% CI, 0–1.9%). There was no significant heterogeneity among the studies (I2 = 0%; P = 0.97; publication bias, Egger test, P = 0.0007) (eFigure 12). The predominant imaging finding was perilesional edema, present in 7.2% (30 out of 418 patients) across ten studies. One case of cyst formation out of 549 patients (0.2%) was reported in 9 out of 14 studies. (eTable 2)
留言 (0)