See the Supplementary Methods for additional details throughout.
Data curationRound 1 CuSOD
UniProt74 sequences containing exactly one Sod_Cu Pfam75 domain were downloaded. Hmmsearch (Hmmer, http://hmmer.org/; ref. 76) identified the Sod_Cu domain envelopes. Sequences were truncated to remove extraneous sequences beyond the bounds of the Sod_Cu match. Additional quality filtering was performed. Sequence duplicates were removed using CD-HIT77 at an identity threshold of 80%, and 80% and 20% were randomly sorted into a ‘training’ and a ‘test’ set, respectively. A training MSA was generated by an iterative process using MUSCLE (v3.8)78.
Round 1 MDH
All UniProt sequences containing an Ldh_1_N Pfam domain followed by an Ldh_1_C domain were downloaded. LDH and MDH enzymes, based on enzyme commission number79, 1.1.1.27 for LDH and 1.1.1.37 for MDH, were downloaded from SwissProt. MUSCLE and hmmbuild were used to build profile hidden Markov models of both sets. Hmmsearch was used to score each UniProt Ldh_1_N/Ldh_1_C sequence against the MDH and LDH profiles and sequences that had a stronger match to the MDH profile were retained. Additional processing was performed exactly as with the round 1 CuSOD data curation.
Quantification of domain architectures
See the Supplementary Methods.
Round 2 CuSOD pretest
UniProt CuSOD proteins were obtained as described above (round 1 CuSOD). The kingdom of origin for each sequence was obtained from the UniProt annotation. Transmembrane domains and signal peptides were predicted using Phobius66. Sequences with transmembrane domains were discarded. Signal peptides were removed from sequences predicted to contain them. A set of 14 representative CuSOD and 2 FeSOD proteins were manually selected for experimental screening, including eukaryotic, viral and bacterial proteins predicted to not contain signal peptides, and bacterial proteins with predicted signal peptides removed.
Rounds 2 and 3 CuSOD
All eukaryotic transcriptomes available from the NCBI Transcriptome Shotgun Assembly (TSA) sequence database80 were downloaded. Transdecoder (https://github.com/TransDecoder/TransDecoder) was used to extract the protein sequences from transcriptomes. Hmmsearch76 was used to identify proteins with exactly one Sod_Cu domain. This set of proteins was combined with the list of eukaryotic and viral CuSOD proteins from UniProt. Additional quality filtering was performed. Sequences that were more than 85% identical (based on usearch81 search_global) to a sequence screened in a previous round were discarded. The remaining sequences were deduplicated at 90% using CD-HIT and then split 90% and 10% into training and test groups, respectively. A training MSA was generated.
Rounds 2 and 3 MDH
Hmmsearch76 was used to search Mgnify82 for sequences containing exactly one Ldh_1_C and one Ldh_1_N domain. The list of Mgnify proteins was added to the list of UniProt (curation described above). Additional quality filtering was performed. Sequences were deduplicated at 90% using CD-HIT. Sequences with identity greater than 85%, based on usearch search_global, to a sequence experimentally screened in round 1 were discarded. The remaining sequences were split into training (90%) and test (10%) sets. A training MSA was generated.
Phylogenetic trees
Trees were constructed using FastTree from MSAs generated by MAFFT83. Trees were rooted and the midpoint was rendered using ETE3 (ref. 84).
Chorismate mutase and lysozymes
See the Supplementary Methods.
Generative modelsESM-MSA-1b sampling
Sequences were generated by iterative masking and sampling using the ESM-MSA-1b model48. ESM-MSA-1b is a neural network model trained to fill in the wild-type amino acids in masked positions of a protein MSA. The model can be used to generate new sequences by running MSA masking and prediction iteratively, each time replacing the wild-type amino acids at the masked positions with an amino acid drawn from the probability distribution returned by the model. The use of masked language models to generate new sequences was first proposed by Wang and Cho50, and the strategy has been applied to protein sequences in at least three prior works22,49,85.
See the Supplementary Methods for more detail on the parameters used.
ProteinGAN
Generative adversarial models were trained using the training sets for CuSOD and MDH. Then, for each family, sequences were generated by sampling vectors from the latent space using a truncated normal distribution. For rounds 1 and 2, 10,048 sequences were generated for each family. For round 3, 560,016 and 160,064 sequences were generated for CuSOD and MDH, respectively.
Ancestral sequence reconstruction
Maximum-likelihood trees were generated from the training set reference MSAs using FastTree86. Ancestral sequence reconstructions were generated from the trees using the joint reconstruction function of the GRASP28 command line tool. Metrics were calculated, and candidates were selected from the entire set of reconstructed sequences.
ProGen
See the Supplementary Methods.
Computational metricsAlphaFold2
AlphaFold2 (ref. 44) was used to predict the structures of test sequences and all generated sequences that passed the first filtering step.
Phobius
The jphobius66 (https://phobius.sbc.su.se/data.html) executable was used to predict the presence of signal peptides or transmembrane domains.
ESM-1v and CARP-640M
Scores calculated from the ESM-1v39 and CARP-640M68 models were the average of the log probabilities of the amino acid in each position. Without masking, this calculation can be done with a single forward pass over each sequence. With partial masking, it can be done in a number of passes equal to one per masked_fraction.
ESM-MSA
Scores from the ESM-MSA-1b48 model were calculated in a manner similar to that for ESM-1v scores, using the average log probability across the whole sequence. The metric was calculated using phmmer76 to find the 31 closest training sequences to each query, align the 32 sequences with MAFFT and calculate the average log probabilities from six passes with a masking interval of six.
ProteinMPNN, ESM-IF and MIF-ST
The proteinMPNN45 and ESM-IF46 scores are the average log likelihood of the query residues using the AlphaFold2-predicted structure. The MIF-ST47 score was calculated using the extract_mif.py script from the protein sequence models repository (https://github.com/microsoft/protein-sequence-models).
Rosetta-relax
The Rosetta (v2020.08.61146)43 relax program was used to relax the AlphaFold2 structures.
Distance to the closest training sequence
The most similar training sequence was found using ggsearch36 from the FASTA package87, the BLOSUM62 scoring matrix and a gap open penalty of 10 and gap extend penalty of 2. The Hamming distance was then calculated from the gapped alignment between the query and the top hit sequences. Identity was calculated as 1 − Hamming_distance.
BLOSUM62 and PFASUM15 mutant position mean
The closest training sequence was found using ggsearch36 as described above. From the alignment to the closest training sequence, the mean BLOSUM62 score37 across all mismatched positions was calculated, ignoring positions where either the query or the reference had a gap. We also calculated the alignments and scores using an alternative matrix, the PFASUM15 matrix67.
Longest repeat
Scores were calculated for the longest single-amino acid repeat and the longest 2-mer, 3-mer and 4-mer repeat in each sequence. The scores were calculated as −1 ⨯ the number of repeat units. Therefore, the sequence AAAAAA would have a single-amino acid repeat score of −6, a 2-mer score of −3, a 3-mer score of −2 and a 4-mer score of −1. The sequence LALALALA would have a 1-mer score of −1, a 2-mer score of −4, a 3-mer score of −1 and a 4-mer score of −2.
SASA
SASA, polar SASA and apolar SASA were calculated from the AlphaFold2-predicted structures using the freesasa package (https://freesasa.github.io/). The percentage of polar SASA was calculated using the formula 100 ⨯ polar SASA/SASA.
Net charge, Abs(net charge) and charged fraction
Charges were calculated by summing the numbers of glutamate and aspartate residues and lysine and arginine residues for negative and positive charges, respectively.
Avg(phmmer top 30)
The phmmer top 30 average score was calculated by running a phmmer search of the experimentally tested sequences against the training sequences and averaging the scores of the top 30 hits.
Selection of sequences for in vitro assaysRound 1
The selected sequences had 70% and 80% identity to the closest training sequence and diverse scores on the ESM-1v metric.
Round 2 pretest
CuSOD sequences were selected on the basis of the kingdom of origin (eukaryotic, viral or bacterial) and the presence of Phobius-predicted signal peptides. Sequences with predicted signal peptides were truncated at the predicted signal peptide cleavage site. Two bacterial FeSOD proteins, both lacking a predicted signal peptide, and the previously characterized63E. coli FeSOD (as a positive control) were also assayed.
Round 2
The selected sequences had between 80% and 90% identity to the closest training set sequence and diverse scores on the ESM-1v and ESM-MSA metrics. Sequences were also filtered by manual inspection to remove those with large insertions or deletions compared to the closest reference sequences or long repeats, and a methionine was added to the start of a few of the sequences.
Round 3
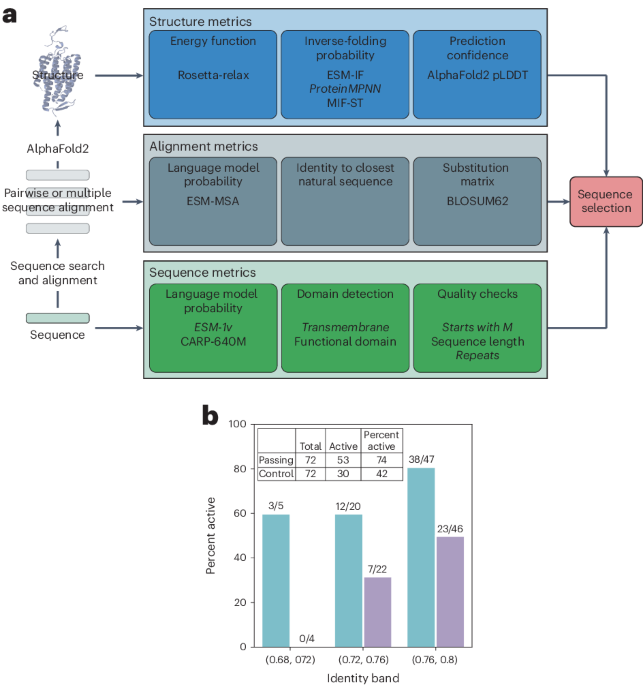
Sequences were selected on the basis of a series of filters. The first filter removed sequences having (1) less than 50% or greater than 80% identity to the closest training sequence; (2) an ESM-1v score below the top 10th percentile threshold compared to the test sequences; (3) no starting methionine; (4) a predicted transmembrane domain; and (5) a single-amino acid repeat longer than three amino acids or an amino acid pair repeat longer than four amino acids, as repeats were more common in ESM-MSA-generated sequences than in natural sequences (Supplementary Fig. 35). For each enzyme family, 200 ESM-MSA-generated sequences and 200 GAN-generated sequences were randomly selected from the sequences that passed the first filter, and their structures were predicted with AlphaFold2. ProteinMPNN scores were calculated for each structure, and the 40 sequences with the highest scores from each model−enzyme combination were retained. Of the top 40 sequences, 18 were randomly selected for expression and functional characterization. For each passing sequence that was selected for functional characterization, a corresponding control sequence was selected from the list of sequences that failed the sequence filter. Control sequences were identical to the closest training sequence within 1% of the passing sequence.
Newly generated ProGen lysozyme sequences
See the Supplementary Methods.
Experimental assaysBacterial strains, plasmids and growth conditions
E. coli BL21(DE3) was used as the host strain for MDH and SOD expression in this study. Cells were grown on LB medium at 37 °C and supplemented with 100 μg ml−1 ampicillin (cat. no.171254, Merck).
Sequences were optimized based on E. coli-preferred codons using the Twist Bioscience web interface (www.twistbioscience.com). A 30-bp sequence (TTTGTTTAACTTTAAGAAGGAGATATACAT) composed of ribosomal binding site sequences and a spacer were added at the 5′ terminus of all genes. Genes were ordered from Twist Bioscience as clones in pET-21(+) between the EcoRI and NotI sites.
The pET21b plasmid harboring the MDH4 gene from a previous study17 was used as a positive control for MDH enzymes. Human SOD1 (ref. 61) (hSOD, GenBank: NP_000445.1), Potentilla atrosanguinea CuSOD62 (paSOD, GenBank: AFN42318.1) and E. coli SOD63 (E.SOD, GenBank: NP_416173.1) were codon optimized, synthesized as described above and used as positive controls for SOD enzymes. Blank plasmid pET21b was used as a negative control for both MDH and SOD enzymes.
Plasmid construction for truncated control sequences
See the Supplementary Methods and Supplementary Table 7.
Competent cell preparation and plasmid transformation
Competent cells of E. coli BL21(DE3) were prepared using the calcium chloride method88.
See the Supplementary Methods for details.
Protein expression and purification
Protein expression was achieved by diluting the overnight cultures 1:30 into 2.5 ml autoinduction Terrific Broth (TB) medium including trace elements (cat. no. AIMTB0210, Formedium) and supplemented with 100 µg ml−1 ampicillin in a 24-well format. All cells were cultivated in 24-well plates in an Eppendorf ThermoMixer C. For MDH expression, cells were grown for 4 h at 37 °C, followed by overnight growth at 16 °C while shaking at 200 rpm. For SOD expression, cells were grown for 4 h at 37 °C, followed by another 3 h at 25 °C with shaking at 200 rpm.
Cells were collected by centrifugation at 3,000g for 10 min. Cell pellets were suspended in 200 μl BugBuster reagent (cat. no. 70584, Merck) supplemented with 1 μl 2,000 U ml−1 DNase I (cat. no. 79254, Qiagen) and incubated at 37 °C with shaking at 200 rpm for 30 min. After incubation, 10-μl mixtures were aliquoted and kept in −20 °C as the total protein (T) sample for gel electrophoresis. The mixture was centrifuged at maximum speed for 10 min and the pellets were discarded. Then, 10 μl of the supernatant was aliquoted and kept at −20 °C as the soluble protein (S) sample for gel electrophoresis. The supernatants were used for protein purification using the following procedures.
Talon resins (cat. no. 635653, Takara Bio) were washed twice with a binding buffer (50 mM NaH2PO4, 300 mM NaCl, 10 mM imidazole, pH 7.4) and then suspended in the same volume of binding buffer as the resin bed amount. Talon resin (50 µl) was loaded into Pierce microspin columns (cat. no. 89879, ThermoFisher). Each supernatant sample was added to the loaded column and incubated at 4 °C for 30 min in a thermomixer.
The columns were then centrifuged at 20g for 30 s and the flow waste was discarded. Resins were washed with 600 µl of wash buffer three times (50 mM NaH2PO4, 300 mM NaCl, 20 mM imidazole, pH 7.4) and centrifuged at 20g for 30 s each time. Finally, the resins were incubated with 100 µl of elution buffer at 4 °C for 30 min in a thermomixer and proteins were then eluted with centrifugation at 20g for 1 min. Another 100 µl of elution buffer was added to repeat the elution steps, and the two portions of elutions were individually mixed. The two eluate fractions were then combined and transferred to a 96-well desalting plate (cat. no. 89807, Thermo Scientific), which was pre-equilibrated with the sample buffer (50 mM NaH2PO4, 300 mM NaCl, pH 7.4). Protein samples were kept at −80 °C after adding 1⨯ protein-stabilizing cocktail (cat. no. 89806, Thermo Scientific). Then, 10 μl of the proteins was aliquoted and kept at −20 °C as the purified protein (P) sample for gel electrophoresis.
For enzymes from round 2 and round 3 and the truncated enzymes from the round 2 pretest, protein concentrations were measured by Qubit Protein Assay (cat. no. Q33211, Thermo Scientific).
Gel electrophoresis
Total, soluble and purified proteins of each sample were mixed with 1⨯ loading buffer (4⨯ loading buffer recipe: 0.2 M Tris-HCl, 0.4 M DTT, 277 mM SDS, 6 mM bromophenol blue, 4.3 M glycerol) and then heated at 85 °C for 5 min in a PCR cycler. Denatured proteins were analyzed by SDS–PAGE with precast gels (cat. no. WG1403A, Thermo Scientific), followed by Coomassie staining with InstantBlue (cat. no. ISB1L-53, Kem-en-tec). Spectra multicolor broad-range protein ladder (cat. no. 26634, Thermo Scientific) was also loaded to analyze the protein sizes.
Enzymatic assay
To test for MDH activity, 2 μl or 100 μg ml−1 of purified protein in round 1 was added to a reaction mixture containing approximately 1.5 mM NADH (cat. no. 10128023001, Merck), 2.0 mM oxaloacetic acid (cat. no. O4126, Sigma) and 20 mM HEPES buffer (pH 7.4). Assays were performed in triplicate in a 96-well format. All components were added using multichannel pipettes to avoid the reaction time lag of each well. The final reaction volume was 100 µl, and the reaction was carried out at room temperature in a transparent 96-well microplate (cat. no. 0020821, Sarstedt). MDH activity was measured in triplicate by following NADH oxidation to NAD+, with an absorbance reading at 340 nm performed in kinetics mode for 15 min in a BMG Labtech SPECTROstar nano spectrophotometer. Unspecific oxidation of NADH was monitored in the no-substrate controls, and these values were subtracted from the other samples. Conversion from absorption values to NADH concentration was carried out using Beer−Lambert law c = A/(d ⨯ ε), in which the extinction coefficient ε value is 6.22 mM−1 cm−1, and the path length for 100 μl in a 96-well plate (d) is 0.29 cm. For samples that did not show any catalytic activities, a tenfold volume, which is 20 μl of purified proteins, was used to perform the assay for a second time.
For MDH in round 2 and round 3, 20 μg ml−1 enzymes together with the positive-control MDH4 were used in the assay as described above for quantitative comparison of catalytic activities, excerpt for samples 1564 and 1546 from round 2, for which the concentration of 0.2 μg ml−1 was used due to low protein yields.
SOD activity was measured with a SOD assay kit (cat. no. 19160, Sigma) in a 96-well format, and all components were added using multichannel pipettes to avoid the reaction time lag of each well. For SOD from round 1, an aliquot (2 µl) of purified protein was added to each well containing 98 µl working solution. Assays of each sample were performed in triplicate and in one ‘No XO’ well. xanthine oxidase working solution (10 μl) was added to each well at the end, except for the ‘No XO’ wells. ‘No SOD’ and ‘blank’ assays were also performed in triplicate. ‘No SOD’ wells contained 10 µl dilution buffer, 80 µl working solution and 10 μl xanthine oxidase working solution, while ‘blank’ wells contained 20 µl dilution buffer and 80 µl working solution. Plates were incubated in the plate reader, which was preset at 37 °C. Absorbance at 450 nm was measured in the kinetics mode for 30 min. For proteins that did not show any catalytic activity, a tenfold volume of 20 μl of purified proteins was used to perform the assay a second time.
For SOD from round 2 and round 3, 5 μg ml−1 of enzymes were used in the assay as described above for quantitative comparison of catalytic activity.
To assay the truncated proteins, 85 μg ml−1 of all samples were used in the enzymatic assay.
For details on the lysozyme assays see the Supplementary Methods.
Data analysis
For MDH, the absorbance value was plotted over time. The absorbance values of all samples at the endpoint of the assay were compared to the negative control by t-test analysis. Samples were considered active if the end absorbance value was significantly lower than that of the negative control, P ≤ 0.05.
For SOD, enzyme activity was measured as the percentage inhibition of the rate of WST-1 formazan formation and calculated using the following equation with absorbance value at 20 min. The inhibition rate was compared to the negative control by the t-test, and those with activity significantly higher than the negative control were considered active with P ≤ 0.05.
SOD activity (inhibition rate %) = ((A − B) − (C − D))/(A − B) ⨯ 100, where A is the absorbance value of the ‘no SOD’ control, B is the absorbance value of the blank, C is the absorbance value of the sample and D is the absorbance value of the ‘no XO’.
Assay data were analyzed using GraphPad Prism v8.0.0 for Windows, GraphPad Software (www.graphpad.com).
Semiquantitative comparisons of enzyme activities
Data from round 3 enzyme assays using 20 µg ml−1 MDH or 5 µg ml−1 SOD, as described above, were used for semiquantitative comparisons of enzyme-specific activity (Fig. 3d).
For MDH, MDH4 was used as a wild-type positive control, and for SOD, hSOD, paSOD and E.SOD were used as wild-type positive controls.
For MDH, absorbance at 340 nm was converted to NADH concentration and the average difference in the concentration between the 0 and 90 s time points of the assay was used as a measure of enzyme activity. Some enzymes, including the MDH4 control, converted substrate very quickly, such that most of the substrate was converted before the first time point. Therefore, we replaced any values below 275 µM at time 0 with the mean value from the negative control. Values were averaged over three technical replicates and divided by the average of the MDH4 samples.
For SOD, the inhibition rate (%), calculated as described above, was used as a measure of enzyme activity. Values were averaged over three technical replicates and divided by the average of the hSOD, paSOD and E.SOD samples.
Reporting summary
Further information on research design is available in the Nature Portfolio Reporting Summary linked to this article.


留言 (0)