
記住我


132 patients were included (131 females and 1 male). The median age was 56 years (range 28–91 years).
All patients were ECOG performance status (PS) 0-3 (PS0; 39, PS1; 76, PS2; 16, PS3;1).
75% of patients (99/132) had visceral metastases including 24 patients with central nervous system (CNS) disease and 61 patients with liver metastases (Table 1).
Table 1 Patient characteristics of the study population.SG treatment was administered as 2nd line treatment for 37 patients (28%); 3rd line for 41 patients (31%) and 41% of patients had received 3 or more prior lines of chemotherapy. The median number of prior lines of treatment was 2 (Table 2).
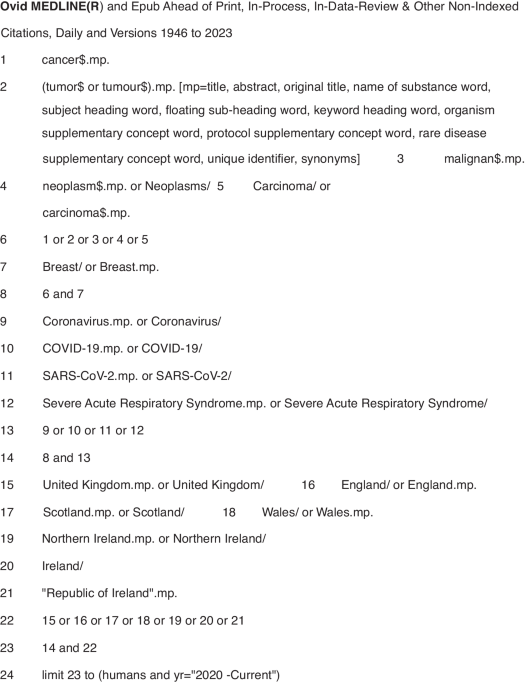
Table 2 Number of prior treatment lines in the metastatic setting of patients included.Survival analysisSurvival analysis included 126 patients; 6 patients were excluded due to incomplete data. The mPFS was 5.2 months (95% CI 4.5–6.6, Fig. 1a) and the mOS was 8.7 months (95% CI 6.8–NA, Fig. 1b). The mPFS and mOS were significantly different between patients who were PS 0, PS1 and PS2/3 (p = 0.0027 and p = 0.0015 respectively). The mPFS was 7.0 months (95% CI 5.3–7.9) for PS0 patients, 5.1 months (95% CI 4.2–6.0) for PS1 patients and 3.1 months (95% CI 0.5-6.4) for PS 2/3 patients. The mOS was 11.2 months (95% CI 6.8-NA) for PS0 patients; 8.7 months (95% CI 6.8–NA) for PS 1 patients and 4.0 months (95% CI 1.2–7.8) for PS2/3 patients (Fig. 2a, b).
Fig. 1: Overall survival of study population.
a Kaplan–Meier curve of the progression-free survival of study population. b Kaplan–Meier curve of the overall survival of study population.
Fig. 2: Subgroup analysis of survival by ECOG performance status.
a Kaplan–Meier curves of the overall survival of ECOG PS 0, ECOG PS 1 and ECOG PS 2 or 3 patients. b Kaplan–Meier curves of the progression-free survival of ECOG PS 0, ECOG PS 1 and ECOG PS 2 or 3 patients.
The mPFS for patients who received 1 or 2 prior treatment lines in the metastatic setting prior to SG was 5.3 months (95% CI 4.4–7.0); the mOS was not reached for this cohort. The mPFS and mOS for patients who received 3 or more prior treatment lines were 5.0 months (95% CI 3.7–6.4) and 8.7 months (95% CI 6.8–11.2) respectively.
There was no significant difference in mPFS (p = 0.21) or mOS (p = 0.37) between patients who received 1-2 versus 3 or more prior lines of systemic anti-cancer therapy (SACT) (Fig. 3a, b).
Fig. 3: Subgroup analysis of survival by number of treatment lines.
a Kaplan–Meier curves of the overall survival of patients who received 1–2 and 3 or more prior lines of treatment in the metastatic setting. b Kaplan–Meier curves of the progression-free survival of patients who received 1–2 and 3 or more prior lines of treatment in the metastatic setting.
Toxicity analysisThe most common adverse events (AEs) were fatigue (all grade; 82%, G3/4; 14%), neutropenia (all grade; 55%, G3/4; 29%), diarrhoea (all grade; 58%, G3/4, 15%), and nausea (all grade; 38%, G3/4; 3%) (Table 3). SG dose reduction was required in 54% of patients due to adverse events (AEs) and 5% (7/132 patients) stopped SG due to toxicity. The median dose reduction (DR) was 20.3%. 9% of patients (12/132) started treatment at a dose reduction (DR range 10–40%), 31 patients required DR from cycle 2, 9 patients from cycle 3, and 10 patients from cycle 4 or later. The cycle of DR was not specified for 5 patients.
Table 3 Summary of adverse events experienced by population (n = 132).Subgroup analysis of patients with CNS diseaseIn our cohort 18% of patients (24/132) had brain metastasis. 8 of these patients were diagnosed with brain metastasis while on treatment with SG. Patients with CNS disease had a mPFS of 5.1 months (95% CI 1.6-6.6); mOS was not reached. The median age for patients with CNS disease was 53 years and the median number of prior treatment lines in the metastatic setting was 2.
Patients with CNS disease who did not receive radiotherapy (RT) at any point (n = 12) had a mOS of 2.5 months (95% CI 1.7–NA). 12/24 patients with CNS disease were treated with RT to the CNS before or during treatment with SG. Patients treated with RT had a significantly longer mOS than those not treated with RT (p = 0.0025). 13/24 patients with brain metastasis remained on treatment long enough to have brain imaging to assess disease response. 5/13 had a partial response, 1 patient had stable disease and 7 patients had progressive disease. SG ability to cross the blood brain barrier is challenging to dissect from our data as systemic treatment overlapped with radiotherapy in 50% of patients. Furthermore, unlike in the trial setting not all patients had baseline brain imaging to ascertain if CNS disease was present at time of starting SG. A brain staging scan for patients with CNS who did not receive RT was available for 3 patients, all of which reported progressive disease.
留言 (0)