
記住我

The distribution of techniques employed by the 25 participating centers in the study is as follows: Among them, 7 centers preferred the 3D-CRT technique for pediatric patients, whereas 6 centers utilized it for adult patients. IMRT was the preferred technique for 4 centers in pediatric patients and 3 centers in adult patients. VMAT was employed by 9 centers for pediatric patients and 11 centers for adult patients. Additionally, 5 centers utilizing Tomotherapy employed the helical IMRT technique for both pediatric and adult patients. The planning DVH comparison results for pediatric and adult patients, obtained using the Proknow software, are presented in two distinct groups.
Pediatric patientFor all techniques employed, including 3D-CRT, IMRT, VMAT, and Tomotherapy, the percentage volumes of PTV_brain, PTV_spine, and PTV_total receiving 95% (34.2 Gy) of the prescribed dose demonstrated V95 values exceeding 98%. The results were consistently similar across the different techniques. Notably, the proton technique achieved precisely 100% V95 for PTV_brain, PTV_spine, and PTV_total, indicating optimal coverage of the target volumes with the prescribed dose. The median (min–max) volume of PTV_brain receiving the full prescribed dose (V100) was highest with the 3D-CRT technique, measuring 96.8 (46.3–99.5). It was followed by the IMRT and VMAT techniques. On the other hand, the lowest V100 value was obtained with tomotherapy, which recorded 86.9 (58.9–95.4). Notably, the 3D-CRT technique exhibited the highest user-based variation in terms of PTV_brain coverage.
For PTV_spinal, the highest median (min–max) V100 value was achieved with the IMRT technique, measuring 95.6 (83.6–98.6). In contrast, tomotherapy, VMAT, and the 3D-CRT technique resulted in lower V100 values, with respective values of 90 (72.9–95.2) for tomotherapy.
Regarding PTV_total, the IMRT technique showed the highest median (min–max) V100 value of 96.6 (69.3–98.7). It was followed by the 3D-CRT and VMAT techniques, while the tomotherapy technique yielded the lowest V100 value of 87.8 (58.0–95.3).
Using the proton technique, V100 values for brain, spine, and total PTV were found to be greater than 97%. The tomotherapy technique exhibited the closest Dmean doses to the ideal values for all PTV target volumes. On the other hand, the 3D-CRT technique yielded the farthest Dmean results for PTV_brain, PTV_spine, and PTV_total. The 3D-CRT technique produced the highest maximum dose values within the PTVs compared to other techniques. In terms of dose distribution conformity (CI results) for pediatric patients, the tomotherapy technique demonstrated the closest adherence to the ideal values for PTV_brain and PTV_spine, while the VMAT technique showed closer conformity for PTV_total.
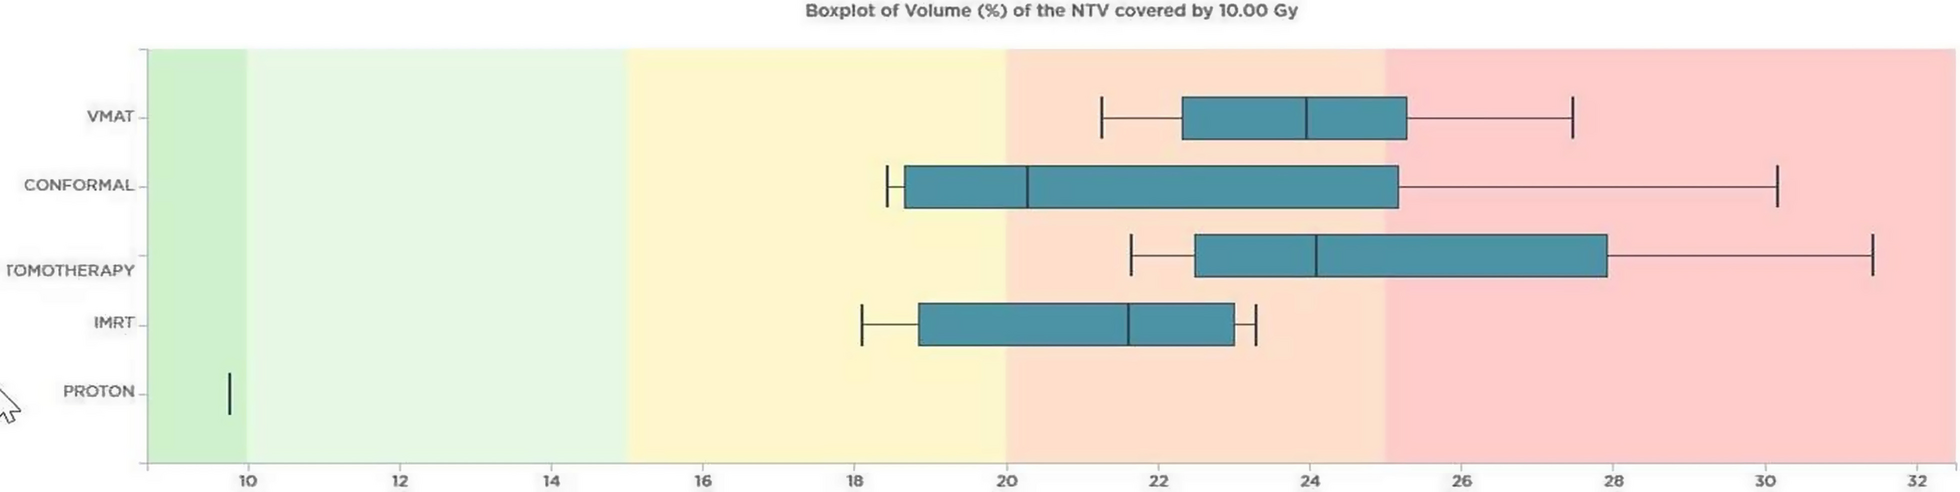
For dose distribution homogeneity (HI index results), the tomotherapy technique outperformed other techniques, providing superior homogeneity for PTV_brain, PTV_spine, and PTV_total. When evaluating the DVH parameters of the 10 Gy volume of healthy tissue outside the PTV in pediatric patients, the 3D-CRT technique exhibited the lowest volume ratio. It was followed by IMRT, VMAT, and Tomotherapy. The rankings for the volumes of normal tissue receiving lower doses (V5Gy and V2Gy) were also consistent with this order. Notably, the results obtained with the proton technique showed significantly lower volumes compared to the other techniques. In Fig. 1, the variation in the volume of healthy tissue receiving 10 Gy across different techniques reveals a notable difference. Specifically, proton therapy exhibited the lowest percentage at 9.76%, differing with other techniques where the lowest was 18.1%, observed in VMAT.
Fig. 1
The normal tissue volumes of pediatric patient receiving 10 Gy are shown according to the techniques. It is seen that the lowest normal tissue volume was obtained by 3D-CRT, IMRT, VMAT and Tomotherapy techniques, respectively. It is noteworthy that it is 9.76% with the proton technique
Table 1 presents the results of DVH parameters for PTV V95, V100, Dmean, Dmax, CI, HI, NTV V2, V5, and V10 Gy median (min–max) for pediatric patients.
Table 1 Median (min–max) dose values of PTV_brain, PTV_spinal, and PTV_total coverage, Dmean, Dmax, CI, and HIFigure 2 presents a comparison of the Dmean doses of OARs by analyzing the DVH parameters of the techniques used in Turkey and the Emory Proton Center for the pediatric patient. The 3D-CRT technique yielded the highest mean doses for the heart, thyroid gland, left and right parotids, esophagus, and left and right eyes and lenses. On the other hand, the IMRT technique achieved the lowest mean doses, which were closest to the ideal, for the heart, left and right kidneys, left parotid, and left and right eyes and lenses. Tomotherapy resulted in the lowest Dmean doses for the thyroid gland, L and R lungs, and R parotid in total lungs, followed by the VMAT technique. Although the proton technique showed higher doses for the left and right eyes, lenses, and parotids compared to other techniques, these doses remained within acceptable tolerance values. Moreover, the proton technique resulted in significantly lower doses for the heart, left and right kidneys, thyroid, and lungs compared to other techniques.
Fig. 2
Comparison of OAR mean doses of pediatric patients with 3D-CRT, IMRT, VMAT, tomotherapy techniques. The treatment plans used in our country and proton center. Error bars show the range maximum and minimum
Figure 3 shows that D1cc doses in all OARs, the highest 1 cc doses were found in the 3D CRT technique. When the IMRT technique was applied, the lowest doses of 1 cc were obtained in the Kidney L and R, the lowest doses were obtained in the L and R parotids, L and R eyes with Tomotherapy, and the lowest doses were obtained in the heart, thyroid and esophagus with Proton.
Fig. 3
Comparison of OAR 0.1 cc doses of pediatric patients with 3D-CRT, IMRT, VMAT, tomotherapy techniques. The treatment plans used in our country and proton center. Error bars show the range maximum and minimum
The dose distribution of the 10 Gy volume in pediatric patients on the axial and sagittal planes for five techniques is illustrated in Fig. 4A–J.
Fig. 4
The dose distribution of the 10 Gy volume in the pediatric patient for five techniques. On the body axial and sagital plane was evaluated: sagital plane A 3D-CRT, B IMRT, C VMAT, D tomotherapy, E proton, axial plane F 3D-CRT, G IMRT, H VMAT, I tomotherapy and J proton
Adult patientPTV_brain, PTV_spine, and PTV_total received 95% (34.2 Gy) of the prescription dose, and all techniques achieved V95 > 99%, indicating similar results. Notably, the proton technique achieved 100% V95 for brain, spine, and total PTV.
PTV_brain V100 median (min–max) volume that received the full prescribed dose was obtained by 3D-CRT technique 99.3 (97.3–99.9). This was followed by IMRT and VMAT, while the lowest value was obtained with tomotherapy 92.4 (55.7–95.7). The Tomotherapy technique was found to be the technique with the highest user-based variation in terms of PTV_brain coverage. For PTV_spine, V100 median (min–max) was obtained with the highest Tomotherapy technique 99.6 (97.1–100), respectively, VMAT IMRT and 3D-CRT technique plan result was the lowest 97.1 (87.74–99.7). The 3D-CRT technique was found to be the technique with the highest user-based variation in terms of PTV_spine coverage. for PTV_total V100 median (min–max) results were the highest value by 3D-CRT technique 94.9 (90.6–98.5), followed IMRT and VMAT, and the lowest value was obtained with tomotherapy technique 91.8 (56.5–95.3). With the proton technique, V100 values for brain, spine and total PTV were found to be > 98%. Regarding the Dmean value, the techniques of Tomotherapy, VMAT, IMRT, and 3D-CRT were found to be closest to the ideal value for PTV_brain. Similarly, for PTV_spine and PTV_total, the techniques of Tomotherapy, VMAT, IMRT, and 3D-CRT were ranked in order of being closest to the ideal value. For all PTV volumes, the tomotherapy technique demonstrated Dmean doses that were closest to the ideal values, while the 3D-CRT technique exhibited the furthest results from the ideal for PTV_brain, PTV_spine, and PTV_total. Furthermore, the 3D-CRT technique yielded the highest maximum dose values among all PTVs.
The CI values of PTV volumes were found to be similar in Tomotherapy and VMAT results. In terms of dose distribution homogeneity index (HI), the tomotherapy technique was found to be superior to others, achieving superior results for PTV_brain, spine, and total in adult patients.
The volume ratios of healthy normal tissue receiving a dose of 10 Gy outside the PTV were compared among different techniques. The 3D-CRT technique had the lowest volume ratio, followed by VMAT, IMRT, and tomotherapy techniques, respectively. The lowest volume of healthy normal tissue receiving 10 Gy was found to be 15% for other techniques, while it was only 6.81% for the proton technique. Figure 5 illustrates the variations in volume ratios of normal tissue receiving 10 Gy in the adult patient across different techniques.
Fig. 5
The volumes of normal tissue receiving 10 Gy in adult patient are shown according to techniques. Presented based on the different techniques employed. The results indicate that the 3D-CRT, VMAT, IMRT, and tomotherapy techniques yielded progressively lower volumes of normal tissue. Notably, the proton technique resulted in the smallest volume, measuring 6.81%
The volume ratios of normal tissue volume receiving 2 Gy and 5 Gy were examined. The 3D-CRT technique had the lowest volume ratio, followed by IMRT, VMAT, and tomotherapy techniques, respectively. Table 2 presents the median (min–max) results for adult patients for PTV V95, V100, Dmean, Dmax, CI, HI, NTV V2, V5, and V10. DVH parameters were analyzed for all techniques for adult patients, and the Dmean doses of the OARs were compared.
Table 2 Median (min–max) dose values of PTV_brain, PTV_spinal, and PTV_total coverage, Dmean, Dmax, CI, and HIThe highest Dmean doses were observed in the plans using the 3D-CRT technique for the heart, thyroid gland, L and R parotid gland, esophagus, L and R eyes, and R lens. On the other hand, the lowest Dmean doses for L and R lung, total lung, right and left kidneys were obtained with the 3D-CRT technique. The tomotherapy technique yielded the lowest OAR Dmean doses, which were closest to the proton technique results, for the L kidney and thyroid gland. In terms of specific organs, the IMRT technique resulted in the lowest doses for the heart, R kidney, L and R parotid gland, esophagus, L and R eyes, and lenses.
The results comparing the Dmean doses of OARs by examining the DVH parameters for each technique in adult patients are presented in Fig. 6.
Fig. 6
Comparison of OAR mean doses of adult patients with 3D-CRT, IMRT, VMAT, tomotherapy techniques. The treatment plans used in our country and proton center. Error bars show the range maximum and minimum
The analysis of the proton technique revealed that while the doses to the L and R eyes appeared higher compared to the IMRT, VMAT, and Tomotherapy techniques, they remained within acceptable tolerance levels. Conversely, notable reductions in dose were observed for the heart, L and R kidneys, thyroid, L and R parotids, esophagus, and lung when utilizing the proton technique.
Figure 7 illustrates that the D1cc doses in all OARs for adult patient indicate the highest 1 cc doses in the 3D CRT technique. In contrast, the lowest 1 cc doses for the eyes (both left and right), heart, left and right kidneys, thyroid, as well as the left and right parotid glands and esophagus, were achieved with the proton technique.
Fig. 7
Comparison of OAR 0.1 cc doses of adult patients with 3D-CRT, IMRT, VMAT, tomotherapy techniques. The treatment plans used in our country and proton center. Error bars show the range maximum and minimum
In the plans generated using the 3D-CRT technique, it has been noted that the maximum dose values exceed the acceptable limits, ranging from 115 to 125% as a result of normalization performed to increase the coverage.
留言 (0)