
記住我

For each institution (IA and IB) 30 patients (60 in total) treated with prostate only radiotherapy during the period of 1st April– 30th June 2017 were randomly selected, with 10 and 20 patients allocated to a calibration and validation dataset respectively. Patients with hip prosthesis were excluded. Across both institutions patients were treated following the hypo-fractionated CHHIP trial protocol [25]; a simultaneous integrated boost technique delivering 60 Gy in 20#. The clinical goals associated with this protocol are presented in Table 1.
Table 1 CHHIP trial based clinical planning goals for IA and IBPatients were planned on a CT scan of 2 mm slice thickness, with prostate and up to 2 cm of proximal seminal vesicles (sv) delineated as targets; and rectum, bladder, femoral heads (IB only) and bowel (IB only) delineated as organs at risk (OARs). As per the CHHIP protocol the following planning target volumes (PTV) were generated, with the PTV’s nominal prescription in Gy defined by the nomenclature’s suffix: prostate expanded by 5 mm (0 mm posteriorly) and 10 mm (5 mm posteriorly) to form PTV60 and PTV57.5 respectively; and prostate + sv expanded by 10 mm to form PTV48.
The clinically delivered treatment plans (VMATClinical) were generated by the institutions using RayStation v5 (RaySearch Laboratories, Stockholm). Treatments were delivered on a Varian TrueBeam STx (Varian Medical Systems, Palo Alto) and an Elekta Agility (Elekta Ltd, Crawley) linac for IA and IB respectively. Automated plans (VMATAuto) were generated at VCC using RayStation v4.99, a research release equivalent to v5. VMATAuto plans were generated using identical RayStation treatment planning machine models and arc configurations to VMATClinical (single 6MV 360° VMAT arc). For IB, VMATAuto and VMATClinical were normalised such that PTV60’s median dose equalled 60.0 Gy.
Pareto guided automated planningIn this study PGAP was performed using EdgeVcc: a PBAIO automated planning solution developed at VCC and implemented in RayStation using python scripting. Full details of this PGAP solution are presented by Wheeler et al. [23], with the following providing a summary of the key aspects.
Prior to automated planning a site specific ‘AutoPlan protocol’ is created and a set of planning goals defined (Table 2). Planning goals are split into 3 priority levels: critical normal tissue goals (P1), target goals (P2) and normal tissue goals (P3). P1 and P2 generally represent a clinical protocol’s mandatory dose constraints and P3 all other trade-offs which are to be minimised. This approach is analogous to using constraints and trade-offs in standard Pareto navigation applications. No weighting factors (WF) are specified by the user, instead they are generated through two processes. For P1 and P2, WF are defined by hard coded constants (1000 and 250 for P1 and P2 respectively). For P3, balancing competing trade-offs is complex and difficult to define a priori. In this case WF are derived through the Pareto navigation calibration process.
Table 2 Final planning goals and weighting factors for both institutionsCalibration is initially performed on a single patient. Firstly, a set of automated plans with differing P3 WF are generated using the PBAIO automated planning algorithms. These plans represent different AutoPlan calibration options, each with a different balancing of competing trade-offs that constitute a point on the Pareto front. The operator then navigates through these differently weighted P3 treatment options via a sliding interface. The clinically optimum position on the Pareto front, determined qualitatively by the operator, is selected and the WF associated with this navigated position stored in the AutoPlan Protocol. The result is a calibrated AutoPlan protocol, which is ready for testing or further refinement.
The PGAP solution is built on a PBAIO automated planning framework, where during optimisation the position and weight of P3 related optimisation objectives are iteratively updated. The position is adjusted to maintain a constant difference (δ) between the optimisation objective and its corresponding DVH parameter. For example, if a dose volume objective (DVO) of V23.4 Gy at 10.0% volume is defined and the resultant optimised dose yields a V23.4 Gy equalling 9.0%, the DVO volume target will be set to [9.0% - δ]. In terms of objective weight, this is dynamically updated such that the objective function’s value trends towards a target objective value. Utilising these two mechanisms within a PBAIO framework aims to both minimise OAR doses (via dynamic positioning) and ensure consistent trade-off balancing across all patients treated to the same clinical protocol (via dynamic weighting). This provides the potential for a Pareto navigation calibration on a single patient to yield a suitably calibrated AP solution for novel patients. In practice, especially for more complex sites with variable anatomy, it may be necessary to perform additional Pareto navigation on outlier patients (with weights typically averaged) to improve the solution’s robustness across the whole cohort.
In previous work, calibration via Pareto navigation was performed through sequential navigation of one trade-off (or Pareto dimension) at a time. In this regard a Pareto dataset (typically containing 5 plans) was generated with varying WF applied to the given trade-off and all other WF held constant (or set to zero if unnavigated). The process was repeated until all trade-offs were navigated. In this work we present a fully customisable interface (Fig. 1), where any number of dimensions can be navigated in parallel, thereby providing the opportunity for full Pareto navigation. Furthermore, dimensions are not limited to a planning goal’s WF, but rather any of its parameters, enabling navigation, for example, of individual P2 target values such as PTV min dose.
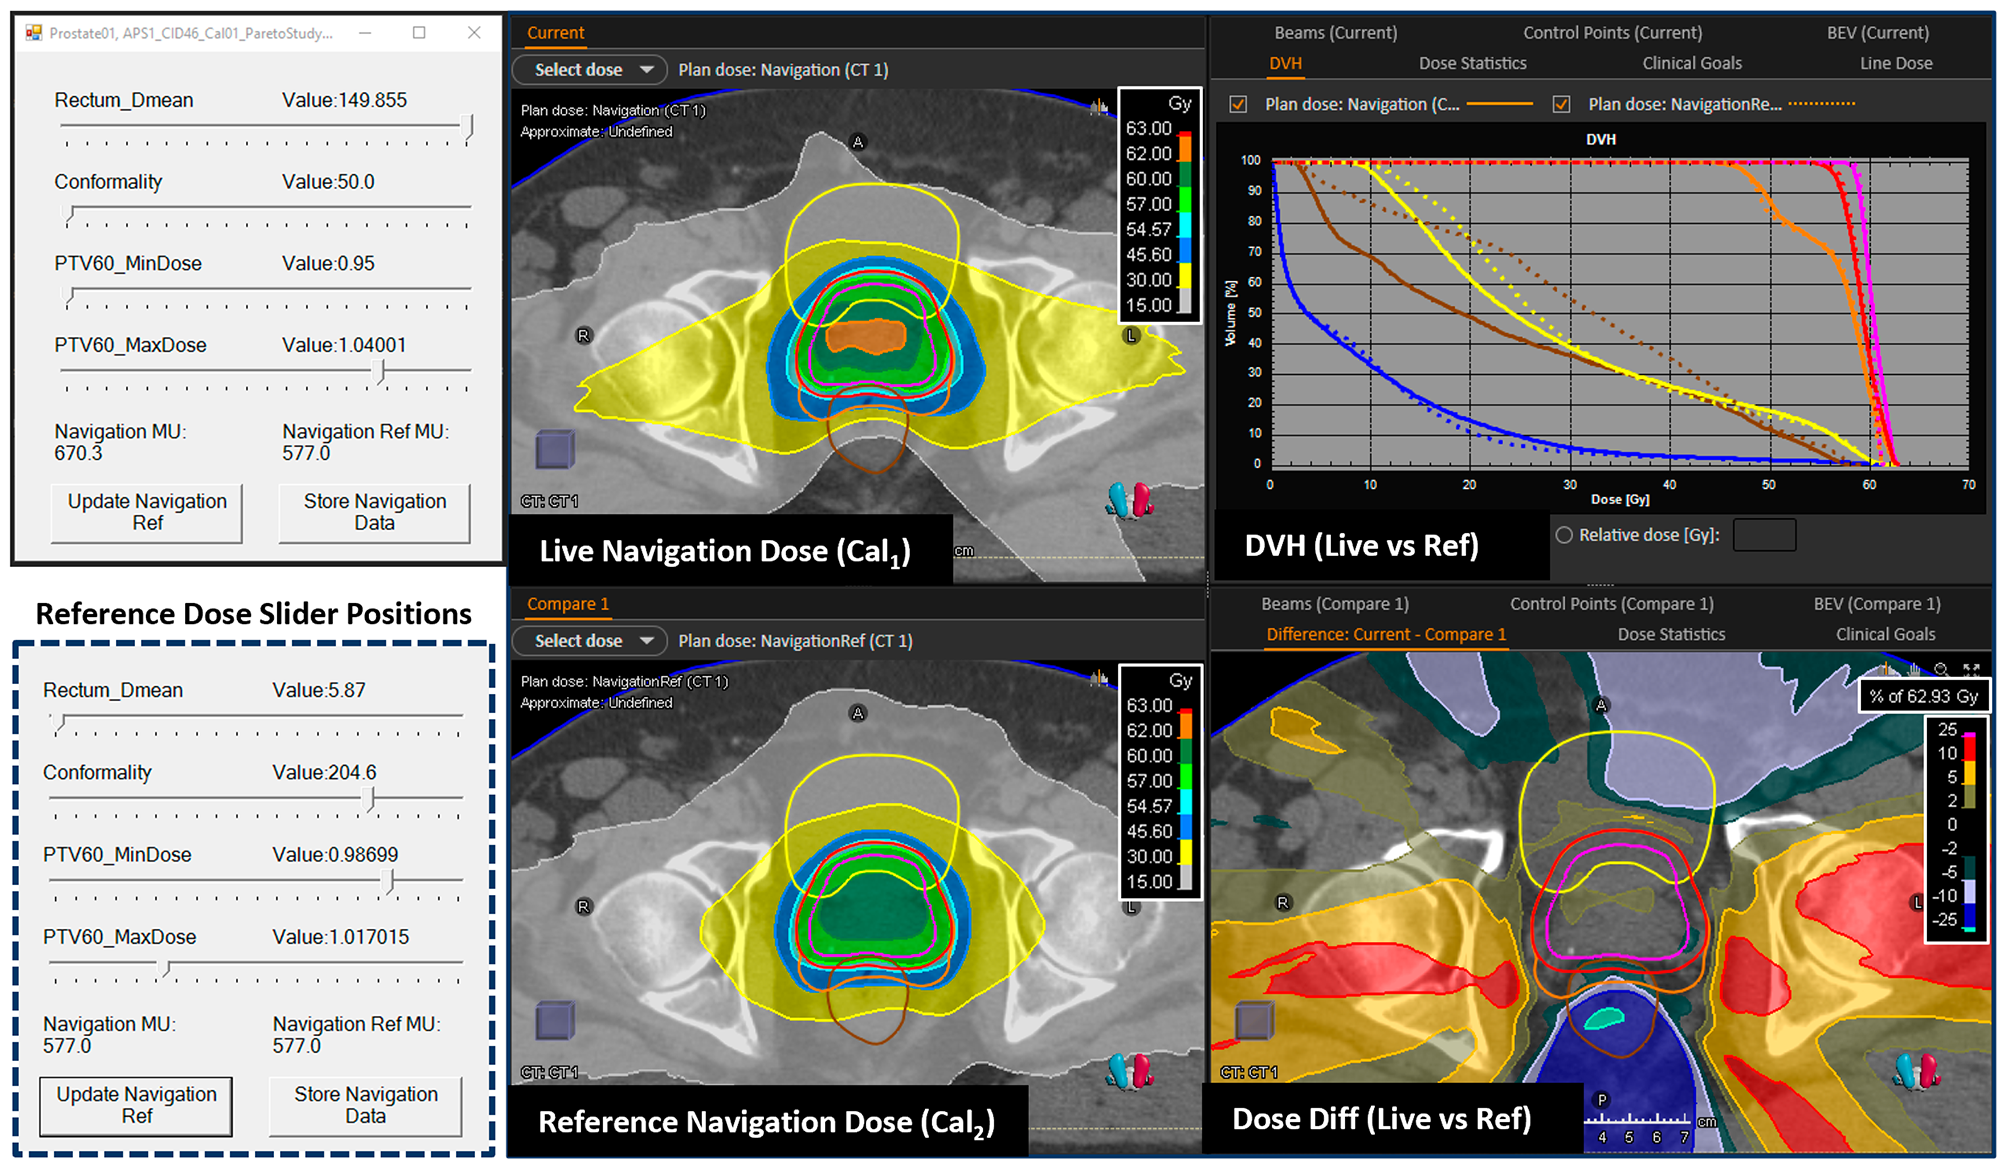
Fig. 1
Pareto navigation calibration interface. Navigation is performed using the slider bars (top left), with the dose distribution (top centre) and DVH (top right– solid line) updated in real time within RayStation’s evaluation module. During navigation the operator can set the navigated distribution as a reference distribution (bottom centre) and DVH (top right– dotted line) to aid in the decision making. In this example the navigated position represents a solution where the rectum is spared at the expense of homogeneity and conformality (Cal1) with the reference distribution representative of the final calibration for IA (Cal2). The corresponding Cal2 slider positions are provided for reference (bottom left) and isodose legends have been enhanced for clarity. ROIs: rectum (brown), bladder (yellow), external (blue), PTV60 (pink), PTV57.5 (red) and PTV48 (orange)
For a given navigation the operator defines (via a config file) the dimensions to be explored and for each dimension the trade-off parameter values to be sampled during creation of the Pareto surface. Typically 3–5 parameter values are specified for each dimension. To populate the Pareto navigation dataset, a fully segmented treatment plan is generated (using the PBAIO framework) for all possible parameter value permutations across the different dimensions. The dataset is navigated in ‘parameter space’ using a slider interface with the navigated dose distribution estimated though linear interpolation of the neighbouring discrete Pareto plans using the navigated parameter values as the interpolation coefficients (see Wheeler et al. [23]). Whilst the interface allows for any number of dimensions to be navigated in parallel, there are computational limitations as the number of plans in the navigation dataset increases to the power of the number of dimensions. Pareto navigation is therefore typically limited to < 5 dimensions, with additional navigations performed sequentially until all trade-offs have been navigated.
AutoPlan protocol calibrationSeparate calibrations for both IA and IB were performed by VCC using the institution’s calibration patient cohort. Planning goals (Table 2) were based on CHHIP clinical goals (Table 1) and during calibration the balancing of trade-offs was informed by the corresponding VMATClinical plan and collaborative discussions with the external institution.
Demonstrating the utility of PGAPTo demonstrate the potential utility of PGAP, using the calibrated IA protocol as a base, a multidimensional navigation consisting of the following four dimensions was generated for the first IA calibration patient: PTV60 Dmin (target parameter), PTV60 Dmax (target parameter), rectum Dmean (WF parameter) and external normal tissue fall off (WF parameter). Using the navigation interface two different calibrations were selected (Fig. 1): Cal1, where the rectum was spared at the expense of homogeneity and conformality, and Cal2, where parameter values were set to nominally equal the final calibrated IA protocol. For both Cal1 and Cal2 an automated plan was generated for all IA calibration patients. Pareto front representations of PTV60 homogeneity index (HIPTV60), PTV48 Paddick’s conformity index (CIPTV48) [26] and rectum DMean were generated to demonstrate the propagation of differing calibrations to novel patients. This evaluation was undertaken at VCC after the multi-institutional study proper using an upgraded version of RayStation (8b research).
Evaluative study designFor the evaluative study, VMATAuto plans were generated for all validation patients using the institution’s calibrated AutoPlan Protocol. Plan quality was quantitatively compared to VMATClinical using: CHHIP dose metrics; PTV D98%, D2%, HI and CI; and OAR mean doses. Higher prescription PTVs were subtracted from lower prescription PTVs when reporting D98%, D2% and HI. Differences were assessed for statistical significance using a two-sided Wilcoxon signed rank test. Statistical testing was not performed where, following omission of tied values (i.e. where metrics equalled zero for both VMATAuto and VMATClinical), sample size was < 10. In addition, a blind qualitative comparison of VMATAuto and VMATClinical was performed on-site at each external institution by a team consisting of a single oncologist and dosimetrist. During review the team would discuss the two plans under blind conditions and rank them in order of preference. Whilst the discussions were collaborative, it was permissible for the oncologist and dosimetrist to disagree on the final ranking.
留言 (0)