Patient cohort, dual-tracer protocol and PET/CT imaging
Our retrospective analysis included 32 patients with primary esophageal cancer who received PET/CT scans between May 2020 and May 2023 (for patient characteristics, see Table 1). Of these, 72% (23 patients) underwent single session/dual-tracer PET/CT protocol (both scans on the same day) while 9 patients received their FDG- and FAPI-46 PET/CTs on two different time points. All scans were performed for cancer staging prior to radiotherapy. Dual-tracer PET/CT imaging was carried out according to a previously published protocol [6] and it allows administering both PET tracers (FAPI-46 and FDG) in one appointment.
Table 1 Patient characteristicsThe acquisition of the PET/CT was in a supine position in craniocaudal direction, whole body, starting at the skull base until mid-thigh. The mean time interval between application of FDG and scanning was 64.8 ± 14.2 min. In case of dual-tracer PET/CT protocol, after completion of FDG-PET/CT scan with 234.9 ± 59.9 MBq (mean), we injected 182.3 ± 43.1 MBq FAPI-46 (mean). The subsequent dual-tracer PET/CT was performed 18 ± 22 min after injection. When FAPI-46 PET/CT was performed on a different day as the FDG-PET/CT, patients received 166.2 ± 36.4 MBq FAPI-46 and FAPI-46 PET/CT was performed 44.2 ± 22.6 min later (see Table 2). For improved subsequent radiotherapy planning and matching of the images, patients wore immobilization devices for head, arms, back and knees to ensure a good correlation between PET/CT and radiotherapy. Patients with high (cervical) esophageal cancer received a thermoplastic mask. PET/CT scans were evaluated by two independent reviewers (specialists for nuclear medicine). A correlation with the CT was performed to exclude unspecific findings.
Count rates (CR) and functional tumor volume (FTV) measurements
Volumes of interest (VOIs) were drawn around the primary tumor and, if present, the metastases, to determine the maximum count rates (CRmax) and/or peak count rates (CRpeak) of the lesions. Mean count rates (CRmean) of reference tissue (mediastinal blood pool and liver) were measured with VOIs of 1 cm diameter in the descending thoracic aorta (representing mediastinal blood pool) and VOIs of 2 cm diameter in the right liver lobe.
FTVs of tumors and metastasis were measured in the single- and dual-tracer PET/CT scans. FTVs were calculated in all PET scans using the SyngoVia workstation (Siemens, Erlangen, Germany), taking a fixed threshold of CR of 4.0 (FTV4.0) or a CR-adapted threshold (defindes as the 2.5-fold of CRmean in the bloodpool (BP) (= FTVBPadapted). The latter was necessary to compensate for increased CR values sometimes occurring in the reference and background tissue in patients with dual-tracer PET/CT. FTV-measurements were performed in the primary tumor (FTVtumor), in nodal/distant metastasis (FTVmetastasis) and, if present, in secondary tumors (FTV2nd_tumor, n = 3).
All clinical investigations were conducted according to Declaration of Helsinki principles. All procedures were performed in compliance with the regulations of the responsible local authorities and the local institutional review board waived the requirement for additional approval owing to the retrospective character of this study (23-1254-retro). All patients gave written informed consent to PET imaging.
Descriptive statistics were used to present patient characteristics and results. For statistical analysis, a Wilcoxon matched-pairs signed-rank test was performed to detect significant differences between continuous variables. A p-value of less than 0.05 (p < 0.05) was considered significant. To measure the strength of the correlation, Pearson’s correlation coefficient was used. All statistical analyses were performed using SPSS-Statistics v.28.0.1.1 (IBM, Armonk, NY, USA).
Target volume delineation
Varian medical systems (Siemens Healthineers, Erlangen, Germany) treatment planning system (TPS) ‘Eclipse’ was used for target volume delineation and matching of the present imaging. By ensuring that the positioning for scanning of all patients was the same as that used for subsequent radiotherapy, we were able to achieve exact matching of the images. Radiotherapy reference points were marked on the patients’ skin.
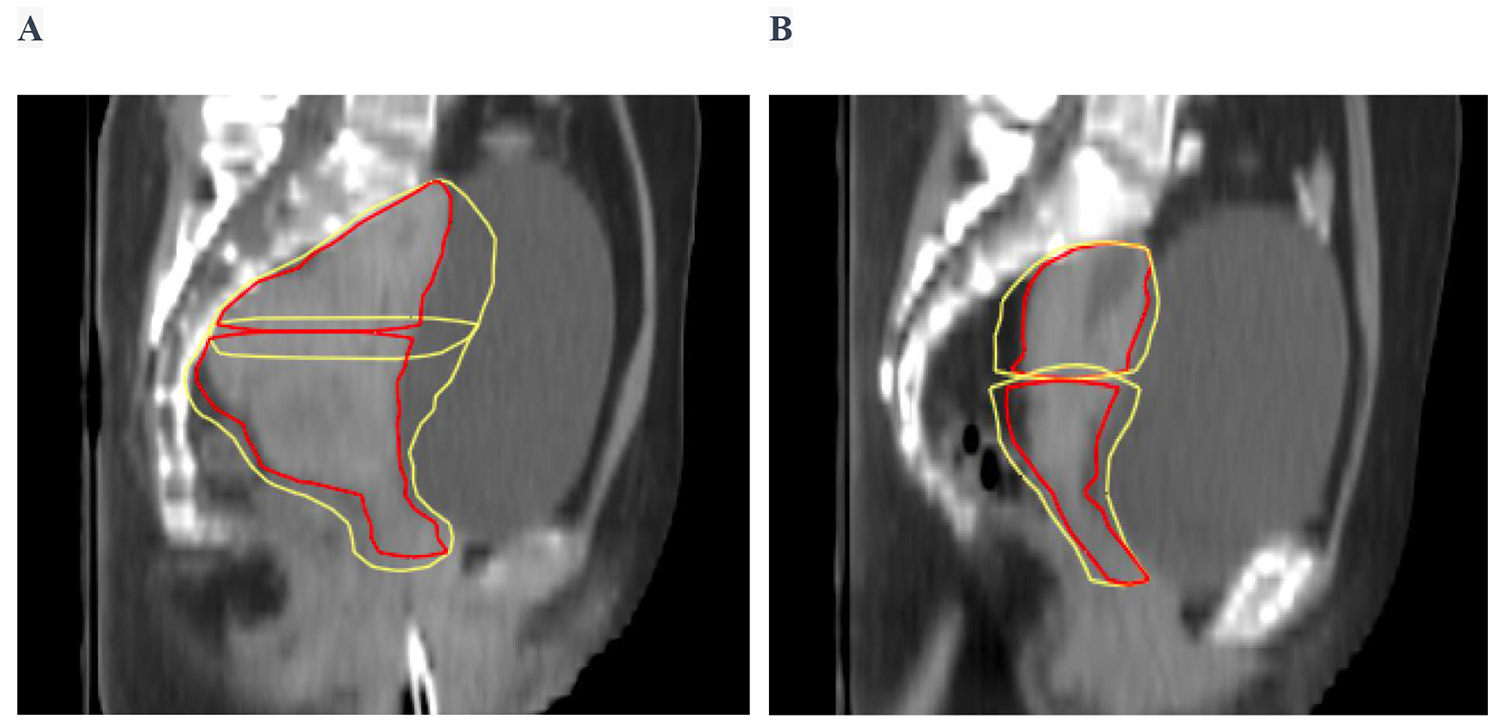
For comparison of target volume delineations, two GTVs were created independently. First, a GTV based on FDG PET/CT was created and second, a GTV based on either FAPI-46 PET/CT alone or on base of the combination of both scans (FAPI-46/dual-tracer PET/CT) was set up. For PET/CT based contouring, a window of SUVmax 0–5 was employed. GTVs for oesophageal cancer were contoured according to the practical guideline of the American expert consensus group for contouring of esophageal and gastroesophageal junction cancer [8] or according to the European target volume delineation atlas for the neoadjuvant radiation treatment [9] and approved by a group of board-certified radiation oncologists.
Potential pitfalls or known benign sites of FAPI-uptake were taken into consideration when interpreting discrepant tumor areas (dual-tracer or FAPI-46 + but FDG-). Moreover, lesions were correlated with CT-imaging in favour to confirm possible pathological findings of PET/CT scans and to safely ensure pathological interpretation of PET-positive lesions. Upstaging or treatment decisions were based on the collected information gained from all used diagnostic methods. Indeed, all such decisions were discussed in multidisciplinary meetings with medical oncologists, gastroenterologists, surgeons, physicians for nuclear medicine and radiation oncologists in consensus by taking the results of clinical examination, EUS, PET/CT imaging and CT imaging into consideration.
Tumor staging and change of treatment after PET
In esophageal cancer, endobronchial ultrasound examination (EUS) is the accepted standard to assess T-stage (depth of invasion), so it was not determined in the PET-scans. For N-staging, we first defined the pre-PET (CT-based) N-stage, then counted PET-positive lymph nodes in both FDG PET/CT and FAPI-46/dual-tracer PET/CT and classified them as following: 1–2 positive regional lymph nodes: cN1, 3–6 positive regional lymph nodes: cN2, > 7 positive regional lymph nodes: cN3, according to the 8th edition AJCC/UICC TNM-staging for esophageal cancer [10]. In M-staging, we defined a pretherapeutic M-stage and compared it to our findings in the PET scans (cM0: no distant metastasis, cM1a: distant lymph nodes (cervical/coeliac), cM1b all other distant metastasis) [10]. Findings with a potential impact on therapy regimen were discussed in the interdisciplinary tumor board meetings. Patients with lesions that remained unclear (e.g. one soft tissue metastasis in a patient’s gluteal muscle) had to receive a biopsy of the suspicious lesion. To better understand the impact of FAPI-46/dual-tracer PET/CT in radiotherapy (RT) planning, we categorized our findings into “minor change” meaning any change (usually enlargement) of RT-field after PET due to more lymph nodes or different lymph node regions that need to be covered by the RT field and “major changes”, meaning every change of treatment regimen (e.g. from neoadjuvant to definitive chemoradiation or from curative to palliative treatment).
Immunohistochemistry
From our cohort, biopsy specimens of the primary esophageal tumor (squamous cell carcinoma (SCC) and adenocarcinoma (AC)) were selected for further analysis. Whole slides were automatically stained with the Leica BOND-MAX (Leica Biosystems, Wetzlar, Germany) for FAP (Abcam, clone EPR20021) as previously described and whole slide images were digitized with the with the Aperio GT 450 DX (Leica Biosystems, Wetzlar, Germany). Analysis was carried out in QuPath v0.4.3 as previously described [11]. Tumor and tumor stromal areas were annotated. Positive cell detection was performed under the following settings: setup parameters: detection image optical density sum, requested pixel size 1 μm; nucleus parameters: background radius 8 μm, median filter radius 0 μm, sigma 2 μm, minimum area 12 µm2, maximum area 400 µm2; intensity parameters: threshold 0.1, max background intensity 2; and cell parameters: cell expansion 5 μm, cell nucleus included. Number of positive cells and H-Scores were calculated in QuPath for all available cases.


留言 (0)