
記住我


This retrospective study was approved by our institutional review board, which waived the requirement for written informed consent.
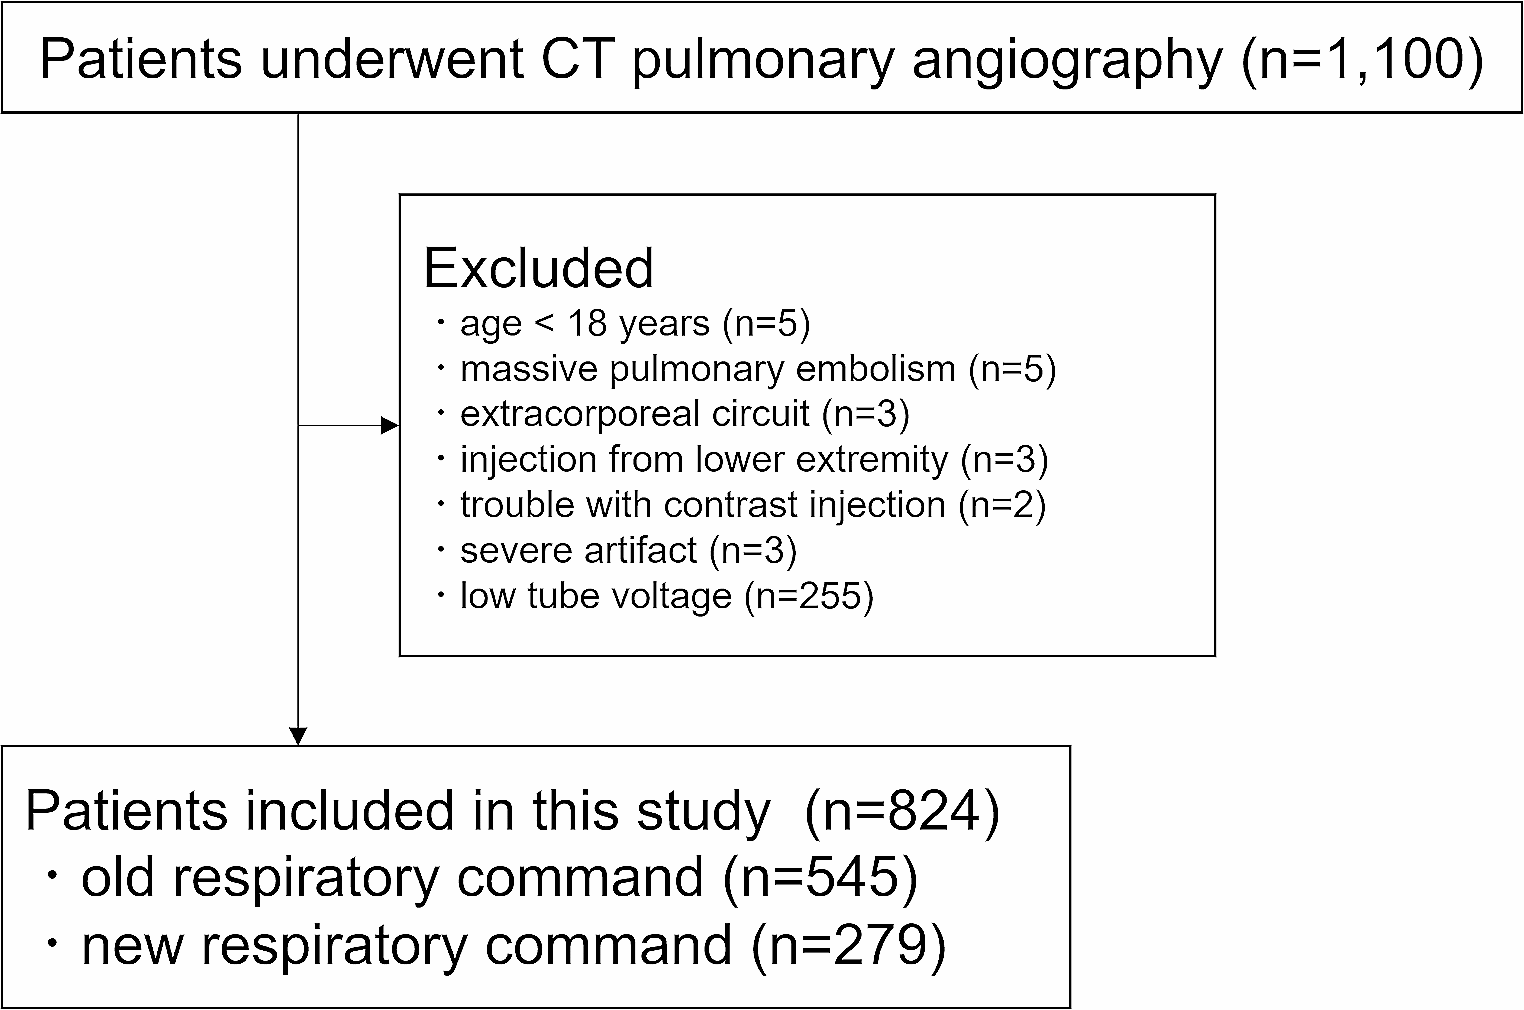
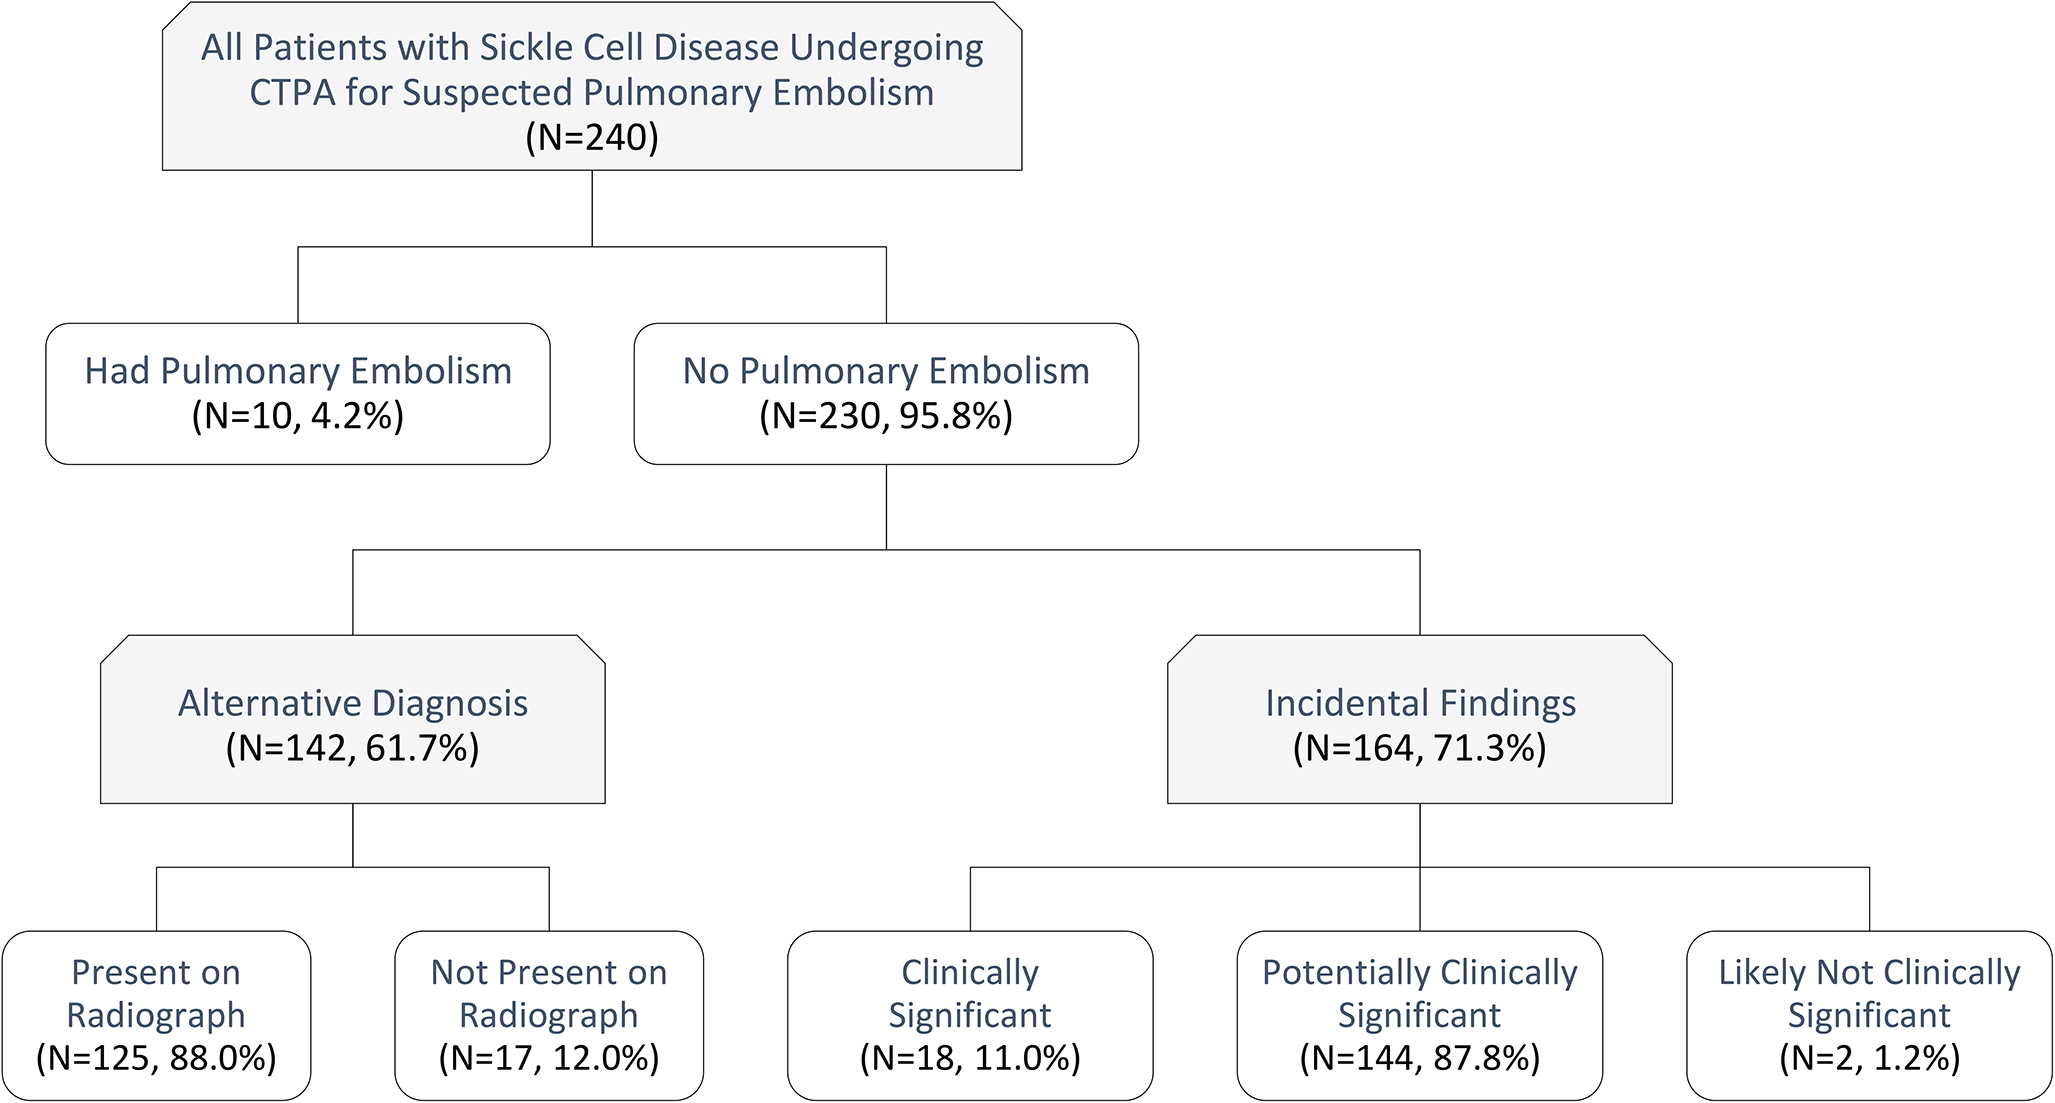
PatientsWe searched a picture archiving and communication system (Advantage Reporting Version 5.2.10.133 [J-MAC SYSTEM, Hokkaido, Japan]) for patients who had undergone CT between January 2021 and February 2023 by using the term of CT pulmonary angiography, pulmonary artery, and pulmonary embolism. Excluded patients were those : (a) aged < 18 years (n = 5), (b) with massive pulmonary embolism hindered measuring the CT attenuation of the pulmonary artery (n = 5), (c) on extracorporeal circuit (n = 3), (d) injected with contrast materials from the lower extremity (n = 3), (e) with trouble in a contrast injection maneuver (n = 2), (f) with severe artifacts (n = 3), and (g) who underwent CT examination with tube voltage of 100 kVp (single-energy CT pulmonary angiography was started to be scanned with 100 kVp from mid-2022) (n = 255). The inclusion and exclusion processes are illustrated in Fig. 1.
Fig. 1
Flowchart of the patient inclusion and exclusion processes
CT imagingThe patients underwent CT examinations using CT scanners from two vendors (Aqulion ONE and Aquilion Prime from Canon Medical Systems, Tochigi, Japan and Discovery CT 750 HD and Revolution CT from GE Medical Systems, WI, US). The tube voltage and current were as follows: fast kV switching dual-energy CT with 70 keV monochromatic image, which corresponds to a 120 kVp image [12], with noise index set at 11.4 (GE-CT [Revolution CT]); 120 kVp with noise index set at 11.36 (GE-CT [Discovery 750 HD]); and 120 kVp with automatic tube current modulation standard deviation set at 13.0 (Canon-CT [Aquilion ONE and Aquilion Prime]). The scan direction was cranio-caudal. CT images were reconstructed at a slice thickness/interval of 5 mm/5 mm for both Canon-CT and GE-CT. For clinical purpose, thinner slice thickness images (3 mm for Canon-CT and 2.5 mm for GE-CT) and thicker slice thickness images (5 mm for both Canon-CT and GE-CT) were reconstructed. However, to unify the slice thickness, we have chosen latter images for the main analyses.
The contrast material (600 mgI/kg) was injected from the right or left antecubital vein within 30 s using an automatic power injector. The flow rate, which was around 3 ml/s, was variable based on patient’s body weight. The intravenous catheter with gauge of 22G was used. The iodine density of contrast material (Iomeprol 350 mgI/mL [Bracco], iopamidol 370 mgI/mL [Bayer], Iohexol 350 mgI/mL [GE Healthcare], or Ioversol 320 mgI/mL [Guerbet]), which was determined based on patient’s body weight (320, 350, and 370 mgI/mL for those with < 48 kg, 49–63 kg, and > 64 kg, respectively in principle), was recorded. The scan begun 20 s after the start of contrast material injection.
At our institution, the respiratory command for CT pulmonary angiography was changed in January 2022. Before January 2022, the patients were scanned at the end-inspiratory level (old respiratory command). After January 2022, patients were given respiratory instructions before CT examination to maintain mid-inspiration levels during CT pulmonary angiography (new respiratory command).
Quantitative image analysisA radiologist (radiologist A) with 13 years of imaging experience placed circular regions of interest with diameters of approximately 10 mm on the main pulmonary artery and descending aorta. Subsequently, CT attenuation of the main pulmonary artery (CTMPA) and descending aorta (CTAORTA) was recorded. Because CT attenuation within the superior vena cava was highly heterogeneous, we did not measure them. To evaluate the reproducibility of the measurement, another radiologist (B, with imaging experience of 6 years) performed those measurement in randomly selected 25 patients. Following a previous report [13], patients with CTMPA < 200 Hounsfield unit (HU) and 150 HU were considered to have TIC and severe TIC, respectively. A radiologist measured the cardiothoracic ratio (CTR) on the scout images.
Qualitative image analysisThree radiologists (readers 1/2/3 with diagnostic imaging of 12/10/6 years, respectively) were involved in qualitative image analysis. Before this evaluation, radiologist A randomized all images. The three readers were blinded to the patient background and CT scanning information. They evaluated the quality of images using a four-point scale (1 = severe TIC and nondiagnostic, 2 = TIC degraded image quality although a diagnosis can eventually be made, 3 = TIC is slightly present but no significant reduction in the quality of the study, 4 = TIC is not visually apparent). To evaluate the interobserver agreement, scoring was also performed by another radiologist in randomly selected 75 patients. Therefore, 899 (= 824 + 75) patient data in total were evaluated by 3 radiologists (299–300 patient data by each radiologist).
Statistical analysesStatistical analyses were performed using R version 4.1.2 (https://r-project.org/). Nominal and continuous variables were compared using Fisher’s exact test and Student’s t-test (or one-way analysis of variance for multiple groups), respectively. Intraclass coefficient for CTMPA and CTAORTA was calculated. For ease, iodine density of contrast agent was dichotomized to ≤ 350 mgI/mL and > 350 mgI/mL in the analyses. P-values < 0.05 were considered to indicate statistically significant differences. Associations between age and CTR vs. CTMPA were assessed using Pearson’s correlation coefficients. To determine the combination of parameters associated with CTMPA and TIC incidence, multiple regression analysis and logistic regression analysis, respectively were performed. In these analyses, factors with p-values < 0.05 in univariable analyses were used as input data, and stepwise regression selection based on Akaike’s information criterion was performed. The qualitative image score was compared between old and new respiratory command with the Mann-Whitney U test. The interobserver agreement in the qualitative image analysis was calculated with the Cohen’s weighted kappa analysis.
留言 (0)