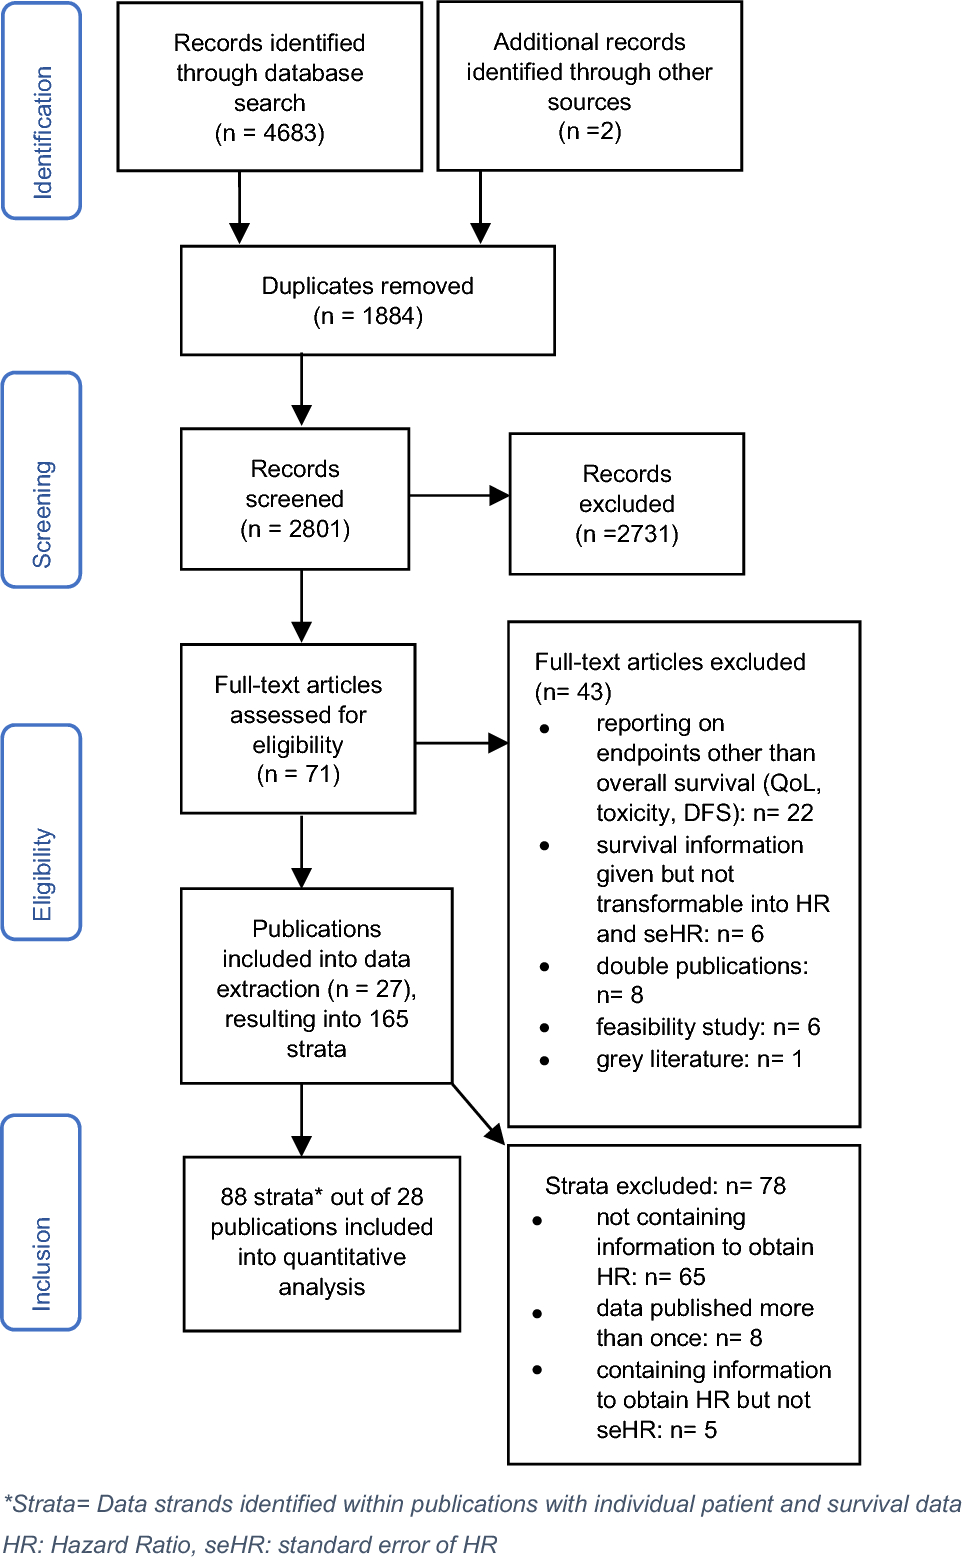
Samples collection
A total of 53 CC patients were included in this study. The tumor tissues and matched normal tissues were collected during surgery, and pathologically diagnosed. All the subjects did not accept preoperative treatments. The tissues were reserved at – 80 °C. This study was allowed by the Ethics Committee of the First Hospital of Hebei Medical University. All subjects have signed the written informed consent.
Cell culture
Human CC cell lines (SiHa and HeLa) and normal End1/E6E7 cells were purchased from Procell (Wuhan, China). End1/E6E7 cells were cultured in DMEM (Lonza, Basel, Switzerland), and CC cell lines were cultured in MEM medium (Lonza). All media were added with 10% FBS and 1% penicillin/streptomycin (Lonza), and maintained in 5% CO2 at 37 °C.
Quantitative real-time PCR (qRT-PCR)
Total RNA was extracted using the TRIzol reagent (Takara, Dalian, China), then cDNA was synthesized with HiScript III RT SuperMix (Vazyme, Nanjing, China), followed by qRT-PCR analysis with the SYBR Green Taq Mix (Takara) and specific primers (Table 1). The relative expression was calculated by the 2–ΔΔCT method with GAPDH and U6 as internal references.
Table 1 Primers sequences used for qRT-PCRWestern blotting
Total proteins were isolated using RIPA lysis buffer containing protease and phosphatase inhibitor cocktail (Beyotime, Beijing, China). The concentration of proteins was determined using a BCA assay, and then separated by 8% SDS-PAGE gel, followed by shifting to nitrocellulose membranes. Then MTDH (ab124789, 1:10,000), USP7 (1:2000, ab108931) and GAPDH (ab8245, 1:1000) (Abcam, Cambridge, MA, USA) were used to incubate with the membranes at 4 °C for 12 h, which were then probed with secondary antibodies (1:5000) (Abcam) for 2 h at 37 °C. Finally, protein blots were assayed using the ECL Reagent Kit (Invitrogen, Carlsbad, CA, USA).
Cell transfection
The small interference RNA (siRNA) targeting MTDH or USP7 (si-MTDH or si-USP7) or the short hairpin RNA (shRNA) targeting USP7 (sh-USP7) were designed by GenePharma with nontargeted siRNAs or shRNAs as the negative control (si-NC or sh-NC). MTDH-overexpression plasmids (MTDH) were established by cloning full-length of MTDH into pcDNA3.1 plasmids (GenePharma), and the empty pcDNA3.1 plasmids were used as the negative control (pcDNA). The transient transfection was performed using the Lipofectamine 3000 (Invitrogen).
5-Ethynyl-2ʹ-deoxyuridine (EdU) assay
SiHa and HeLa cells were reacted with 50 μM EdU solution (RiboBio, Guangdong, China) for 3 h. After fixation and permeabilization, cells were dyed with 1 × Apollo® reaction cocktail for 30 min. Cell nuclei were stained with 1 µg/mL DAPI for 10 min. Lastly, EdU-positive cells were assessed using a fluorescent microscope.
Flow cytometry
After being re-suspended in 500 µL binding buffer, SiHa and HeLa cells were double-dyed with 10 µL Annexin V-FITC and 10 µL propidium iodide (PI) (BD Biosciences) for 15 min avoiding light. Finally, apoptotic cells were counted using the flow cytometer.
Transwell assay
Transwell plates (8-µm pore size; Corning, Inc., Corning, NY, USA) were adopted for cell migration and invasion analyses. For invasion assay, the bottom of the upper chamber of Transwell plates was pre-coated with 60 μL Matrigel (diluted with serum-free medium). About 1 × 10⁵/mL SiHa and HeLa cells were inoculated into the upper chambers with 500 μL complete medium in the bottom chambers. Twenty 4 h later, cells migrated and invaded into the lower compartment were stained with crystal violet, and then counted with a microscope.
Tube formation assay
Per well of 96-well plates was pre-coated with 50 µL chilled Matrigel for 30 min. Then about 100 µL conditioned medium (CM) of SiHa and HeLa cells with indicated transfection was collected and transferred into each well. Thereafter, HUVECs (1 × 10⁴/well) were added into each well and incubated for 6 h. Finally, the tubular branches were photographed and manually counted.
Macrophage polarization analysis
THP-1 cells were stimulated by 100 ng/mL phorbol 12-myristate 13-acetate (PMA; Abcam) for 24 h, and then underwent indicated transfection, 48 h later, cells were re-suspended in flow cytometry buffer and stained for 30 min at 4 °C with anti-CD11b and anti-CD206 antibody away from light. Lastly, CD11b + /CD206 + cells were analyzed on the flow cytometer and FlowJo software.
After PMA stimulation and indicated transfection, THP-1 cells were harvested and levels of IL-10 and TGF-β1 were detected by qRT-PCR as described above.
Co-immunoprecipitation (Co-IP) assay
Cells were lysed in 500 mL co-IP buffer (50 mM Tris pH 7.5, 150 mM NaCl, 5 mM EDTA, 1–2% Nonidet P-40, and protease inhibitor cocktail), then the protein was separated on a Bolt 8%% Gel. Next, proteins were incubated with anti-USP7 or anti-IgG and 100 μL protein A + G agarose beads at 4 °C for 4 h. After washing, protein bounds were detected by western blotting.
In vivo assay
The sh-NC or sh-USP7 was cloned into lentiviral plasmids, and then transfected into 293T cell. 48 h later, the supernatants of 293T cells were collected and lentiviral particles were obtained by ultracentrifugation. The lentiviral particles carrying sh-NC or sh-USP7 were used to infect SiHa cells in DMEM with 8 µg/mL polybrene and 10% FBS for 12 h. Finally, SiHa cells were collected, and about 2 × 10⁵ SiHa cells were subcutaneously inoculated into BALB/c nude mice (4–5 weeks old, n = 18, Slaike Jingda Laboratory, Hunan, China). Mice were divided into three groups: sh-NC, sh-USP7, or sh-USP7 + MTDH groups. In sh-USP7 + MTDH groups, mice were intratumorly injected with MTDH plasmids and Lipofectamine at 3 sites of the xenograft tumor every 3 days when the tumor volume reached about 100 mm3. Tumor volume was calculated following the formula: volume = 0.4 × length × width2. At day 28, all mice were killed, tumors were isolated for weighing, and then collected for western blotting as described above, or fixed in formalin for immunohistochemistry (IHC) analysis using the Ki67 antibody (Abcam, ab15580).
Statistical analysis
The data were manifested as the mean ± standard deviation (SD). The normal distribution was determined by a Kolmogorov–Smirnov test, if not normally distributed, by Mann–Whitney test for comparison. One-way or two-way analysis of variance (multiple groups) and Student’s t test (two groups) were used for comparison in different groups as appropriate. The correlation was assessed using Pearson correlation coefficient. P < 0.05 was considered statistically significant.


留言 (0)