Sample 1. Child service social workersProcedure and sample
Sample 1 were collected as part of the “Oslo Workplace Aggression Survey” (OWAS), a collaborative project between the National Institute of Occupational Health in Norway (STAMI) and the vice mayor of education and child services in Oslo municipality. The survey was conducted electronically in March 2020. All employees (N = 1,264) working full or part time in the child welfare service in Oslo municipality received an email with an invitation to participate in a survey in which the employees were asked to fill in an anonymous self-reporting questionnaire. As all employees in the organization were invited to participate, the sampling approach can be described as a probability procedure. To ensure anonymity, the researchers were not informed about any identifying information. The Regional Committees for Medical and Health Research Ethics in Norway (REC South East) approved the project, including the procedure for informed consent (project number 28,496). In line with the General Data Protection Regulation (GDPR), STAMI acquired permission from the Norwegian Agency for Shared Services in Education and Research (SIKT; approval: 226,309) to process the personal data in this project for research purposes.
A total of 678 questionnaires were returned, yielding a response rate of 53.6%. The sample consisted of 74.4% women and 25.6% men. The mean age was 39 years (SD = 10.91). A total of 82.4% worked in a full-time position, 10.4% in a part-time position, while 6.6% were on-call staff. 0.6% were on temporary leave. Altogether 16.6% of the respondents had some sort of formal leadership responsibility.
Inventories
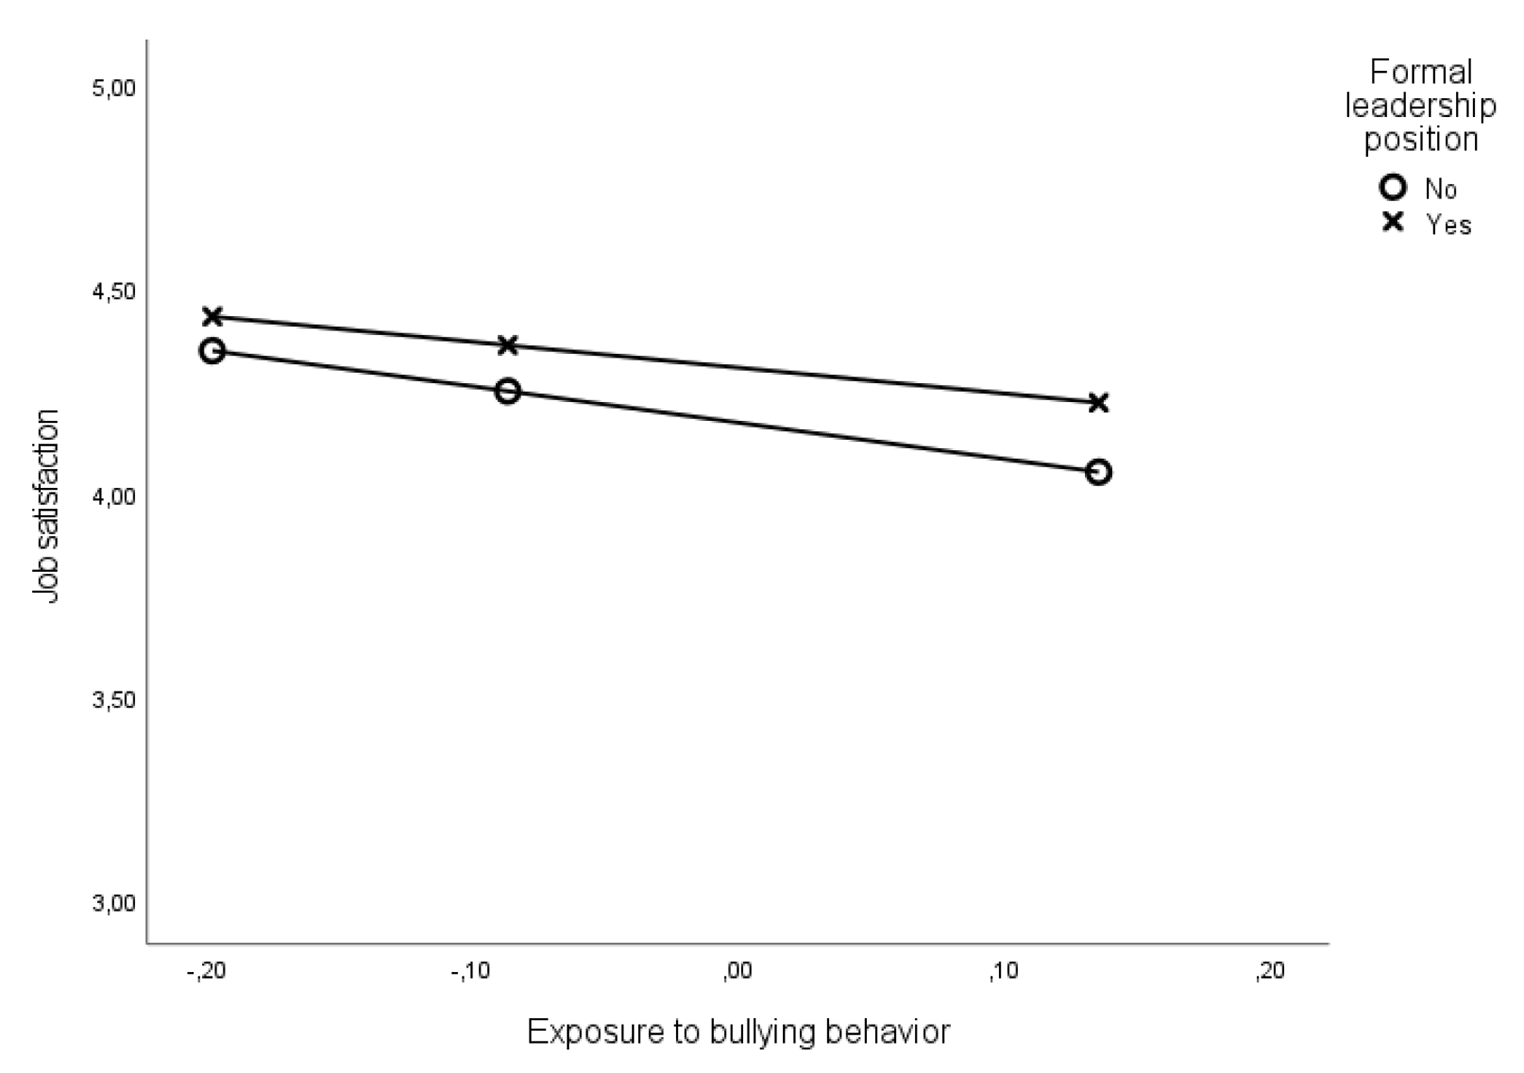
Formal position as a supervisor was assessed with a single item: “Do you have leadership responsibility at your workplace?” Response categories were: “no”, “yes, with professional responsibilities”, “yes with personnel responsibilities”, and “yes with professional and personnel responsibilities”. To retain statistical power, the three latter categories were classified into a single “Formal leadership” category.
Victimization from workplace bullying was measured with the single item self-labeling method (Einarsen and Skogstad 1996). After being presented with the following definition: “Bullying (harassment, badgering, niggling, freezing out, offending someone) is a problem in some workplaces and for some workers. To label something bullying it must occur repeatedly over a period of time, and the person confronted has to have difficulties defending himself/herself. It is not bullying if two parties of approximately equal “strength” are in conflict or the incident is an isolated event,” respondents were asked “Have you been subjected to bullying at the workplace during the last 6 months?”. The response categories were “no,” “rarely,” “now and then,” “once a week,” and “several times a week.” In line with previous research using this indicator of exposure to bullying (Nielsen et al. 2021), positive responses, i.e., “rarely” to “several times a week” were recoded into a single “self-labeling” category. Due to the relatively low prevalence of self-labeled bullying in the current study it was not possible to set a stricter threshold for self-labeling. Note that the reported prevalence rate is in line with previous research from Norway (Nielsen et al. 2009).
The nine-items Short Negative Acts Questionnaire (S-NAQ) was used to measure exposure to specific bullying behaviors at the workplace (Einarsen et al. 2009; Notelaers et al. 2018). The respondents were asked how often they had experienced negative behaviors such as being withheld information, being excluded or humiliated and being given unmanageable workloads, during the last 6 months, with response categories on a 5-point frequency scale ranging from 1 = “never,” 2 = “occasionally,” 3 = “monthly,” 4 = “weekly,” to 5 = “daily”. The S-NAQ had a Cronbach’s alpha value of 0.85 in the present study.
As the S-NAQ does not measure power imbalance explicitly, power relation between target and perpetrator as seen from the target’s perspective was assessed with a three-item scale developed as an add-on to the S-NAQ (Nielsen et al. 2022). An example item is “If you have been exposed to one or more of the behaviors in the list above, did you experience it as difficult to defend yourself against this treatment?”. Response alternatives were “never,” “sometimes,” “once in a while,” “often,” and “every time.” Higher scores indicate that the target is in power imbalance with the perpetrator. Cronbach’s alpha for the power relation scale was 0.91.
Job satisfaction was measured with the short version of The Job Satisfaction Scale (Brayfield and Rothe 1951) as presented by Hetland et al. (2008). Example items are: “I feel fairly satisfied with my present job” and “most days I am enthusiastic about my work”. Responses were given on a 5-point Likert scale where 1= “strongly disagree’” and 5= “strongly agree”. Cronbach alpha in study was 0.87.
Symptoms of depression during the last week were measured by 10 items from the Hopkins Symptom Checklist (HSCL-25). The HSCL is a valid and reliable self-administered instrument measuring mental distress (anxiety, depression) in population surveys (Derogatis et al. 1974). Earlier comparisons show that shorter versions perform as well as the more extensive versions of the inventory (Strand et al. 2003). Responses were given on a four-point scale, ranging from “1 = not at all” to “4 = extremely”. Example items are “Feeling no interest in things” and “Feeling hopeless about the future”. Cronbach’s alpha for this scale was 0.87.
Sample 2. Nationally representative probability sampleSample and procedure
This two-wave prospective study used a nationally probability sample of 5,000 employees that was drawn from The Norwegian Central Employee Register by Statistics Norway. This is the official register of all Norwegian employees, as reported by employers. The inclusion criteria were adult employees employed in a Norwegian enterprise. In Norway, most finish their primary and secondary education the year they turn 18, and a worker may start drawing retirement pension from the month after turning 62 years. To obtain a sample of adult employees and to be able to retain the full sample at both baseline and follow-up, only employees born between 1955 and 1997 were invited to the survey. Questionnaires were distributed in spring 2015. The overall response rate was 32%. In total, 1,608 of the questionnaires returned at baseline were satisfactorily completed. The survey and procedure for informed consent had approval from the “Regional Committee for Medical Research Ethics for Eastern Norway” (approval 2014/1725). All respondents provided informed consent to participate in the survey and the responses were treated anonymously. At T1, the study sample consisted of more women (52%) than men (48%). The mean age was 45.19 (SD = 10.04) years with a range from 21 to 61. In total, 53% were married, 26% were common-law partners, 14% were unmarried, and 7% were widowed, separated, or divorced. Altogether 9% had primary school as the highest educational level, 31% had high school, 32% had lower-level university, while 28% were graduates or postgraduates. The average job tenure was 11.3 years. 36% of the participants had a leadership role that included personnel responsibilities.
Using the same procedure and questionnaire as the T1-assessment, the follow-up data (T2) was collected six months later. The time-lag was based on previous prospective studies documenting longitudinal associations between work stressors and turnover intentions with similar time-lags (Kelloway et al. 1999; Nohe and Sonntag 2014). This period seems long enough to measure possible changes in individual scores, and not too long regarding non-response. To be able to examine changes in study variables over time, only those who participated at the baseline assessment were invited to participate at T2. Altogether 1149 respondents (72%) responded at T2. Attrition analyses showed that the T2 respondents (M = 46.75; SD = 18.85) were significantly (t = 4.57; df = 1603, p < .001) older than non-respondents (M = 42.49; SD = 10.45). There were no differences in the distribution of gender (X2 = 1.31; df = 1; p > .05) or formal leadership responsibility (X2 = 1.94; df = 1; p > .05). There were no significant differences in the main study variables at T1 between responders and non-responders at T2. These findings indicate that the study cohort is representative for the overall sample.
Inventories
Formal position as a supervisor was assessed by a single item question asking, “Do you have position as a supervisor?” Response categories were “no” and “yes.” Power imbalance was not assessed in Study 2. Otherwise, Study 2 used the same measurement instruments as included in Study 1. Cronbach’s alpha values were satisfactory for the S-NAQ (T1:0.81; T2: 0.87), Job satisfaction scale (T1: 0.81; T2: 0.80), and HSCL_Depression (T1: 0.86; T2: 0.86).
Statistical analyses
Statistical analyses were conducted using IBM SPSS Statistics 28.01 and the Process 4.2 macro script for SPSS (Hayes 2013). The prevalence of self-labeled exposure to bullying use was assessed with frequency analyses and chi-square tests. Differences in the levels of exposure to bullying behavior and power imbalance between formal leaders and non-leaders were tested using t-tests and supplementary regression analyses that adjusted for age and gender (Study 1 and 2) and number of employees at worksite (Study 2). Differences in the magnitude of the association between exposure to bullying behaviors and outcome variables were determined by means of two-way interaction analyses in cross-sectional and prospective data. Continuous scale variables were centered in the analyses. Level of significance was p < .05.


留言 (0)