
記住我


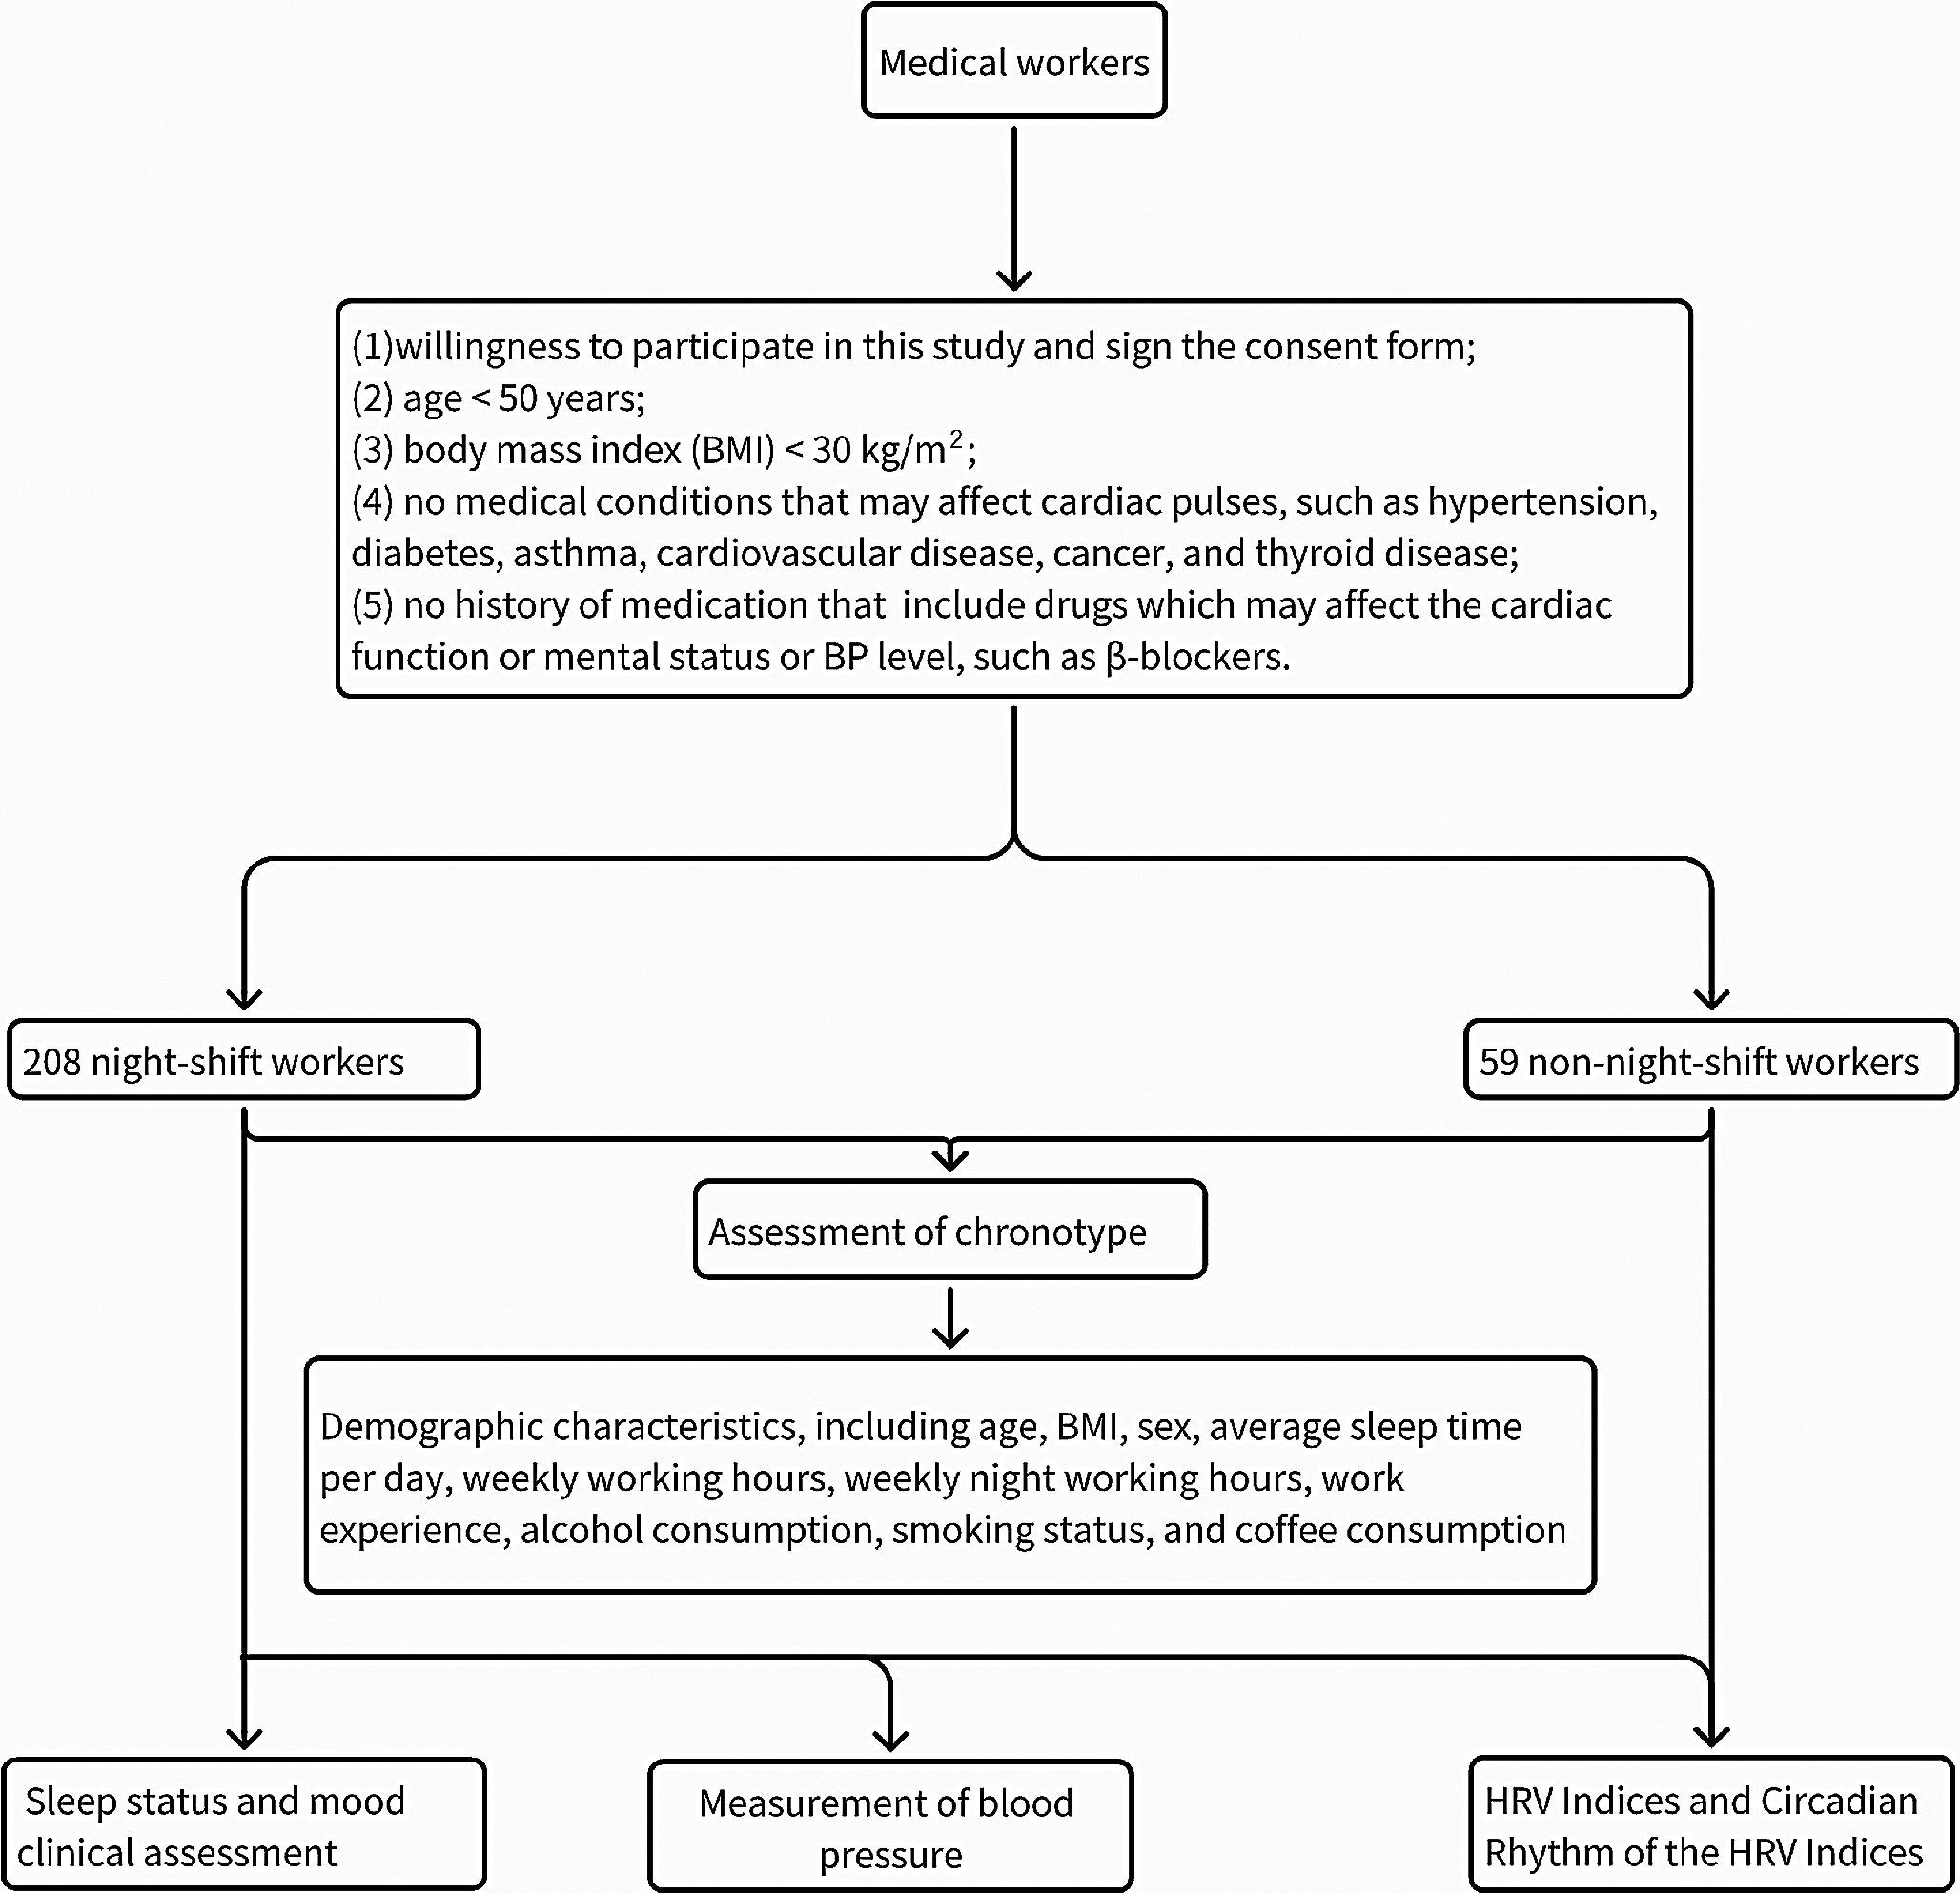
A cohort study was conducted between 2017 and 2019 in a northern Taiwan shipyard, focusing on 180 workers involved in tungsten inert gas welding, a dominant welding method at the company (Chuang et al. 2018) (Fig. 2a). Over three visits, we accumulated a total of 262 measurements. On the first visit, 82 subjects were enrolled in the study. On the second visit, 76 subjects were enrolled, 24 subjects were followed-up, but 51 subjects from the first visit withdrew. On the study's third visit, 22 subjects were enrolled, 51 subjects were followed-up, and seven of 51 subjects returned after withdrawing in 2018. We employed a non-random sampling strategy based on voluntary participation but aimed to achieve a representative sample. We included individuals aged between 20 and 70 years to concentrate on those actively participating in shipyard work and to minimize the confounding effects of age-related health issues. We excluded participants who had experienced acute health exacerbations in the month preceding the study to eliminate the influence of recent acute health events on the data. Additionally, individuals diagnosed with specific pulmonary conditions, including tuberculosis, pulmonary infections, and lung cancers, as well as those with cardiovascular diseases and diabetes, were excluded. The low incidence of tuberculosis in Taiwan (State of Health 2023) highlights the rigor of our pulmonary condition exclusion criteria. Although our previous study identified a 12.6% prevalence of COPD among welding workers, none of the participants in the current study were diagnosed with COPD, ensuring that our findings focus specifically on the impacts of occupational exposures.
Fig. 2
a Flowchart of the study of biomarkers for lung function declines due to exposure to metal fume particular matter with an aerodynamic diameter of < 2.5 µm (PM2.5) in 3 years of follow-up of shipyard workers (n = 262). b Illustration of the experimental procedures for personal PM2.5 assessment, lung function, and biomarker collection
Experimental designFigure 2b outlines the study's experimental procedures. On Monday mornings, each worker was equipped with a personal PM2.5 sampler for an 8-h exposure assessment, aligning with a typical workday. The timing for urine sample collection was carefully chosen to capture potential biomarker shifts due to workplace exposure: one sample was taken at the beginning of the workday (08:00 Monday morning; pre-exposure) and another at the start of the following workday (08:00 Tuesday morning; post-exposure). In contrast, plasma samples were only collected post-exposure, at the start of the following workday (Tuesday morning), to capture physiological responses that require a longer time frame to manifest compared to urinary biomarkers. All urine and plasma samples were stored at -80 °C until analysis. A lung function test was measured in each subject on Tuesday morning (post-exposure) during the study periods. Workers' baseline characteristics were gathered through a questionnaire assessing age, sex, BMI, smoking status, alcohol consumption, and dust mask usage. The rationale behind the chosen timing and methods was to create a comprehensive snapshot of both immediate and delayed physiological responses to welding exposure, thus enabling a robust evaluation of the associated health risks.
Personal PM2.5 assessmentThe procedure for the personal PM2.5 assessment was reported previously (Chuang et al. 2018). A model 200 Personal Environmental Monitor (PEM) equipped with an AirChek® XR5000 air sampling pump (SKC, Eighty-Four, PA, USA) was used to consecutively sample PM2.5 for 8 h (09:00 ~ 17:00, Monday) at a flow rate of 2 L/min. The sampler was used to collect PM2.5 onto a Teflon filter substrate (37 mm, pore size: 2-m, Pall, Ann Arbor, MI, USA) in the breathing zone. Sampling procedures and quality control procedures were performed according to guidelines of the United States Environmental Protection Agency (USEPA) method IP-10A.
Lung functionThe lung function test was performed using a Chestgraph (Chest, HI-701, Japan) according to American Thoracic Society/European Respiratory Society guidelines (Miller et al. 2005). Forced vital capacity (FVC), FEV1, FEV1/FVC ratio, peak expiratory flow (PEF), forced expiratory flow at 25% of the FVC (FEF25%), forced expiratory flow at 50% of the FVC (FEF50%), and forced expiratory flow at 75% of the FVC (FEF75%) were measured in each subject on Tuesday morning (post-exposure) during the study periods. To ensure accurate and consistent measurements, the equipment underwent routine calibration and maintenance checks as per manufacturer guidelines.
Urinary and plasma biomarkersPlasma and urinary levels of α1-antitrypsin, ITIH4, and 8-isoprostane were quantified using enzyme-linked immunosorbent assays (ELISAs) from R&D Systems and Cayman. Standard curves were constructed for each biomarker based on serial dilutions of known concentrations, and quality control samples were interspersed within each assay plate to assess reproducibility and accuracy. Experiments adhered to the manufacturer-provided guidelines, and all assays were conducted in duplicate. Urinary biomarker concentrations were adjusted for urinary creatinine (µg/g) to account for variations in urinary output.
Urinary metal concentrationsUrinary metal analyses were conducted using inductively coupled plasma-mass spectrometry (ICP-MS; Agilent 7500, CA, USA) according to a previous study (Chuang et al. 2015). Urine samples were digested with nitric acid using a MARS 5 microwave (CEM, NC, USA). In total, nine metals were selected for analysis, including Cr, Mn, cobalt (Co), Ni, zinc (Zn), cadmium (Cd), copper (Cu), iron (Fe), and vanadium (V), with median coefficients of variation within 5–10%. Analyses were conducted for each target metal when the calibration curve was at its lowest concentration. The method detection limit was determined by multiplying the standard deviation (SD) by three times the magnitude of each urinary metal. Limits of detection (LODs) were 0.005, 0.0018, 0.0003, 0.0108, 0.0679, 0.0007, 0.007, 0.0886, and 0.001 ppb for Cr, Mn, Co, Ni, Zn, Cd, Cu, Fe, and V, respectively. Values below the LOD were replaced by \(\frac}\). Urinary metal values were normalized by urinary creatinine (µg/g) (Table S1). All urinary metal analyses were performed on post-exposure samples to better evaluate occupational exposure.
Statistical analysisThe winsorization approach was used to minimize the effects of severe outliers outside the 10th and 90th percentiles (Tsai et al. 2012). Then, normality of the dependent variables was assessed using the Shapiro–Wilk test due to its effectiveness in smaller sample sizes. A paired t-test was used to assess changes in different urinary biomarker levels due to exposure to PM2.5. Delta (∆) urine levels of biomarkers were defined as post-exposure minus pre-exposure urinary levels. A correlation analysis was conducted using Pearson's correlation coefficients to determine relationships among PM2.5, urinary metals, α1-antitrypsin, ITIH4, and 8-isoprostane. Linear mixed-effect models adjusted for age, smoking, and welding duration were used to determine associations of independent variables with dependent variables as follows: (1) PM2.5 with plasma, ∆ urine, and post-urinary biomarkers (α1-antitrypsin, ITIH4, and 8-isoprostane), and lung function, (2) urinary metals with biomarkers and lung function, and (3) biomarkers with lung function. Regarding the unbalanced repeated measures in our data, we applied a linear mixed-effects model. The model incorporates both fixed effects—such as age, smoking status, and duration of welding exposure—and random effects, specifically the participant ID codes, to adjust for within-subject correlations across different time points. Age, smoking, and welding duration were selected based on existing literature that supports their impact on the health, especially lung function, of welders (Venkatesan 2023; Yawn et al. 2021). The assumptions of the model, including linearity, independence, and homoscedasticity, were verified prior to the analyses. All of the statistical analyses in this study were conducted with R software (vers. 4.2.1 for macOS). The plm package was used for unbalanced panel data analysis (Croissant and Millo 2008). All statistical analyses were conducted at a significance level of p < 0.05.
留言 (0)