
記住我


In an effort to combat climate change, countries are seeking to decarbonise their economies, and the healthcare sector has emerged as a central target of improvement.1 2 Any patient interaction with the healthcare system generates a carbon footprint. Healthcare is one of the largest sources of greenhouse gas (GHG) emissions in the public sector, with a carbon footprint equivalent to 4.4% of global net GHG emissions.2 In 2020, the UK National Health Service established an ambitious goal of 80% reduction in its carbon footprint by 2036‒2039, with the aim of achieving a ‘net zero’ carbon footprint by 2045.3 The Sustainable Healthcare Coalition (SHC) in the UK supports this effort with its stepwise process of computing the carbon impact of numerous diverse activities associated with healthcare services to estimate the overall carbon footprint for a specific care pathway or patient population. This calculation affords policymakers and healthcare providers (HCPs), among others, the opportunity to understand and consider sustainability profiles when developing new models of care and clinical practice improvements that can support environmental targets.4 Understanding the carbon footprint of treatment interventions may assist in identifying practical strategies to reduce GHG emissions via patient-centric principles of improved disease management.
Despite advances in evidence-based treatments, asthma control remains suboptimal across all disease severities.5 6 In the UK and Europe, approximately 50% of patients experience uncontrolled asthma.7 Poorly controlled asthma is associated with a risk of avoidable asthma-related mortality and exacerbations,8 9 resulting in significant healthcare resource utilisation (HCRU).10 The environmental impact of asthma care, particularly poor disease control, has not been fully evaluated, with most of the attention directed towards the global warming potential (GWP) of the hydrofluoroalkane (HFA) propellants, which atomise the preventer medication in pressurised metered-dose inhalers (pMDIs).11–13 Patients with poorly controlled asthma incur greater asthma-related costs than those with well-controlled asthma.14 15 Intuitively, the same may hold true for the carbon impact of asthma care, where poorly controlled disease is recognised as associated with a higher carbon footprint. One manifestation of inadequate asthma control is the increased use of short-acting β2-agonist (SABA) reliever therapy.16 SABAs provide immediate bronchodilation but lack anti-inflammatory activity and, therefore, contribute little to achieving asthma control.17 Furthermore, SABA prescriptions of ≥3 canisters/year are associated with an increased risk of exacerbations, asthma-related mortality18 19 and incremental HCRU.18 Together, these factors imply that poorly controlled asthma and the consequent rise in exacerbations may increase the carbon footprint of asthma care in terms of increased HCRU and the requirement for additional pharmacotherapy. The environmental impact of this unmet need may be better understood by estimating the carbon footprint of managing poorly controlled asthma.
This study, which is part of the healthCARe-Based envirONmental cost of treatment (CARBON) programme,20 is the first to quantify asthma care-based GHG emissions as illustrated by UK prescribing practices and HCRU, with the specific objective of estimating GHG emissions related to the management of well-controlled versus poorly controlled asthma.
MethodsThis retrospective, cohort study, based on the SABA use IN Asthma (SABINA) I UK study,18 extracted routinely collected, anonymised pseudonymised primary care data from the Clinical Practice Research Datalink (CPRD GOLD).21 Linked data on mortality from the Office for National Statistics (ONS),22 socioeconomic status (SES) from the Index of Multiple Deprivation (IMD 2015 in quintiles at practice level)23 and secondary care from Hospital Episode Statistics (HES)24 were provided by CPRD for patients residing in England (online supplemental methods).
Study populationPatients (aged ≥12 years) with a validated record of a current asthma diagnosis, current asthma (Read code25 within 3 years of study entry) and registered in CPRD GOLD English general practice between 1 January 2008 and 31 December 2019 were included in the analysis (online supplemental methods).
Study variablesAt baseline, defined as 12 months preceding the index date, patients were categorised based on their asthma control status as well-controlled (no asthma exacerbations and <3 SABA canister prescriptions/year) or poorly controlled (≥3 SABA canister prescriptions/year or ≥1 asthma exacerbation). The index date was defined as the latest date of any of the following: 13th birthday; start date of the study period; the date 12 months after the general practitioner (GP) commenced up-to-standard or research-quality data; the date 12 months after continuous CPRD GOLD record availability or the date 12 months after the first asthma Read code. Exacerbations were defined as a temporary worsening of asthma requiring a short course of oral corticosteroids (OCS), an emergency department (ED) visit or hospitalisation.26 To balance differences between actuation counts across inhalers, the SABA canister cut-off was converted to 600 actuations/year according to the 200 actuations that would be expected in a SABA pMDI—the predominant device type prescribed for SABA in the UK.27
Patient demographics captured age; sex; SES (IMD1 (least deprived) to IMD5 (most deprived23)) and comorbidities, including anxiety, atopy, chronic obstructive pulmonary disease (COPD), gastro-oesophageal reflux disease (GORD), pneumonia, diabetes, osteoporosis and depression.
Asthma severity was determined based on treatments proposed in the 2016 Scottish Intercollegiate Guidelines Network (SIGN)/British Thoracic Society (BTS) guidelines.28
All asthma medication prescriptions (SABA, inhaled corticosteroids (ICS), ICS/long-acting β2-agonist (LABA), ICS/LABA/long-acting muscarinic antagonist (LAMA), leukotriene receptor antagonist (LTRA), maintenance OCS (with a daily dose <10 mg), theophylline, aminophylline and biologics) were evaluated at baseline. A cut-off of 10 mg was considered for maintenance OCS based on clinical experience and studies conducted in the UK that estimated the median daily dose of maintenance OCS for severe asthma to be 10‒15 mg/day across several specialist centres.29 30
Asthma exacerbations, medication prescriptions and HCRU were evaluated during the postindex follow-up period. Asthma-related HCRU included primary care or GP visits (overall and within 10 days of hospitalisation or an ED visit), outpatient visits (overall and within 10 days of hospitalisation or an ED visit), inpatient visits or hospitalisation and ED visits. Exacerbation-related HCRU included inpatient hospitalisations, ED visits and a GP-prescribed short course of OCS. Routine HCRU included asthma-related GP and outpatient visits (online supplemental methods).
GHG emissions, measured as carbon dioxide equivalent (CO2e (95% CI)), were assessed during follow-up years (online supplemental methods). The quantification of GHG emissions associated with all asthma medications were based on the quantity and type of medications prescribed/possessed (as a surrogate for use) and the CO2e emission value for each asthma treatment. The carbon footprint of all inhaled treatments, as well as oral and injectable medications (SABA, ICS, ICS/LABA, ICS/LABA/LAMA, LAMA, LABA, LABA/LAMA, LTRA, maintenance OCS (with a daily dose <10 mg), theophylline, aminophylline and biologics), were quantified using the SimaPro software modelling resource, and energy consumption data, Ecoinvent datasets and certified published studies, together with modelled estimates12 31 32 and internal data, and are listed in online supplemental table S1. Calculations for the carbon footprint considered emissions from the entire life cycle of all asthma medications, including the manufacture and transport of the inhaler device (eg, pMDI or dry powder inhaler (DPI)), drug, propellants (for pMDIs) and end-of-life disposal of inhalers. As commonly practised,33 34 product life cycle assessments were carried out using GWP values of HFAs for a 100-year time period obtained from the Intergovernmental Panel on Climate Change Fifth Assessment Report.35 GHG emissions associated with various HCRU components, including all healthcare visit types (GP visits, outpatient visits, ED visits and inpatient hospitalisation) were estimated by applying the methodology and data obtained from the SHC Care Pathway Guidance4 and related assumptions (online supplemental table S2). Primary care/GP visits were identified in the CPRD with asthma Read codes,25 while asthma-related outpatient (specialist) visits were identified in the HES data with specialist code 340 (which identified respiratory medicine) and International Classification of Diseases 10th Revision codes, where available.
Since CO2e emissions associated with different types of HCRU can vary considerably, we conducted a post hoc sensitivity analysis to demonstrate the potential range of asthma care-related GHG emissions, HCRU CO2e at 0.1× and 10× of SHC values.
Statistical analysisMean (SD) and median (minimum, maximum) were used to describe continuous variables. Categorical data were expressed as numbers and percentages.
Overall GHG emissions, including emissions related to all asthma medication prescriptions and HCRU, were calculated as total annual measure and per 10 000 person-years (per capita) to facilitate comparison across groups. These values were also scaled up to the national UK asthma population of 5.4 million.36 To assess whether GHG emissions varied based on follow-up year, we also quantified these measures for the second and third years of follow-up.
GHG emissions during the first year of follow-up were stratified by baseline variables, including asthma control and BTS treatment steps (online supplemental table S3). Excess GHG emissions due to suboptimal asthma control included emissions from ≥3 SABA canister prescriptions/year, exacerbations and any GP and outpatient visits within 10 days of hospitalisation or an ED visit.
As a sensitivity analysis, multivariable HCRU incidence rates—adjusted for prespecified covariates (sex, age, anxiety, atopy, COPD, GORD, pneumonia, depression, SABA canister count, SES and proportion of days covered by ICS prescriptions)—were quantified using a negative binomial regression model and multiplied with the relevant CO2e emission values to quantify total GHG emissions. These covariates were selected a priori based on literature and modelling data from the SABINA I study.18
ResultsOf the 236 506 patients analysed, 47.3% were categorised as having poorly controlled asthma (table 1). At baseline, patients with poorly controlled asthma versus those with well-controlled asthma received a greater number of prescriptions for SABA, ICS monotherapy and ICS/LABA. Demographics and baseline clinical characteristics stratified by BTS steps are provided in online supplemental table S4.
Table 1Demographics and baseline clinical characteristics stratified by asthma control in UK patients with asthma
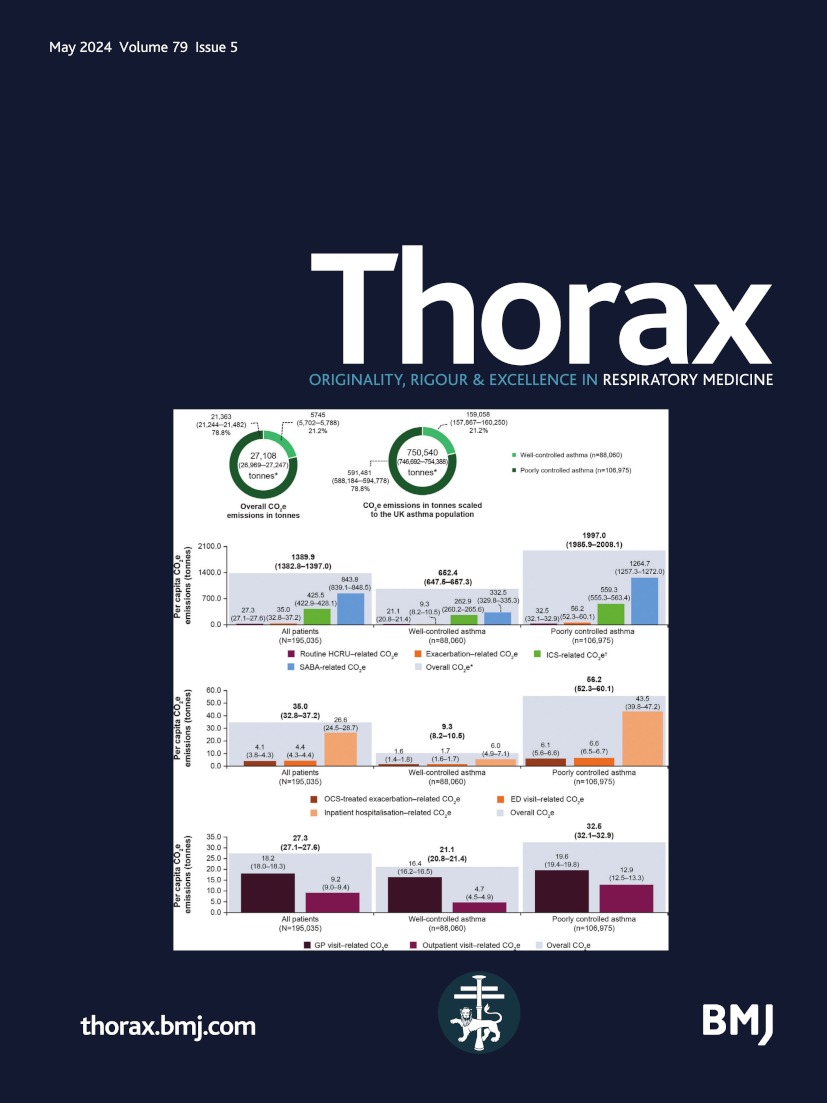
GHG emissions during the follow-up periodOverall GHG emissions attributed to asthma care were 27 108 tonnes CO2e (range: (0.1×) 26 084‒(10×) 37 343 tonnes CO2e; 95% CI 26 969 to 27 247), with poorly controlled asthma (21 363 tonnes CO2e; range: (0.1×) 20 568‒(10×) 29 315 tonnes CO2e; 95% CI 21 244 to 21 482) associated with higher emissions versus well-controlled asthma (5745 tonnes CO2e; range: (0.1×) 5517‒(10×) 8028 tonnes CO2e; 95% CI 5702 to 5788; figure 1A). Poorly controlled asthma was associated with 3.1-fold higher per capita GHG emissions than well-controlled asthma (1997 (95% CI 1985.9 to 2008.1) vs 652.4 (95% CI 647.5 to 657.3) tonnes CO2e/10 000 person-years). SABA relievers accounted for 60.7% of the per capita GHG emissions, with smaller contributions from other pharmacotherapies, exacerbations and routine HCRU (figure 1B). For all components, GHG emissions were greater for poorly controlled asthma. SABA relievers contributed 1264.7 (95% CI 1257.3 to 1272.0) vs 332.5 (95% CI 329.8 to 335.3) tonnes CO2e/10 000 person-years in poorly controlled versus well-controlled asthma, respectively. Inpatient hospitalisations accounted for the highest per capita exacerbation-related GHG emissions, followed by ED visits and short courses of OCS (figure 1C). For routine HCRU, GP visits accounted for higher per capita GHG emissions than outpatient visits (figure 1D). Overall per capita GHG emissions increased with greater asthma severity, with emissions being greater in poorly controlled versus well-controlled asthma across all BTS steps (0‒4; online supplemental figure S1A).
 Figure 1
 Greenhouse gas emissions during the first year of follow-up stratified by asthma control in UK patients with asthma. (A) Overall CO2e emissions in tonnes and CO2e emissions in tonnes scaled to the UK asthma population. (B) Overall CO2e emissions per capita. (C) Exacerbation-related CO2e emissions per capita. (D) Routine HCRU-related CO2e emissions per capita. Estimates are subject to rounding. Values in parentheses represent 95% CI unless otherwise stated. *Includes emissions from other asthma medications, including LABA, LAMA, LABA/LAMA, LTRA, OCS maintenance, theophylline, aminophylline and biologics. †ICS-related CO2e emissions include all ICS-containing therapies (ICS, ICS/LABA or ICS/LABA/LAMA in combination or as separate inhalers). CO2e, carbon dioxide equivalent; ED, emergency department; GP, general practitioner; HCRU, healthcare resource utilisation; ICS, inhaled corticosteroid; LABA, long-acting β2-agonist; LAMA, long-acting muscarinic antagonist; LTRA, leukotriene receptor antagonist; OCS, oral corticosteroid; per capita, per 10 000 person-years; SABA, short-acting β2-agonist.
Scaled to the UK asthma population, overall emissions were equivalent to 750 540 tonnes CO2e (range: (0.1×) 722 202‒(10×) 1 033 921 tonnes CO2e; 95% CI 746 692 to 754 388), with poorly controlled asthma as the major contributor (figure 1A).
Similar findings were observed in the second and third years of follow-up (online supplemental figures S1C,D, S2 and S3). In a sensitivity analysis, modelling HCRU incidence rates adjusted for prespecified covariates did not substantially alter the GHG emissions observed (online supplemental figure S4).
Excess GHG emissions during the first year of follow-upExcess GHG emissions due to suboptimal asthma control, defined as ≥3 SABA canisters and exacerbation-related care, accounted for 12 085 tonnes CO2e overall (range: (0.1×) 11 533‒(10×) 17 602 tonnes CO2e; 95% CI 11 979 to 12 191), with poorly controlled asthma (10 975 tonnes CO2e; range: (0.1×) 10 485‒(10×) 15 873 tonnes CO2e; 95% CI 10 880 to 11 070) associated with higher emissions versus well-controlled asthma (1110 tonnes CO2e; range: (0.1×) 1048‒(10×) 1729 tonnes CO2e; 95% CI 1087 to 1133; figure 2A). Poorly controlled asthma was associated with 8.1-fold higher per capita excess GHG emissions than well-controlled asthma (1026.0 (95% CI 1017.1 to 1034.9) vs 126.0 (95% CI 123.4 to 128.7) tonnes CO2e/10 000 person-years). SABA relievers accounted for 94.3% of the per capita excess emissions, with poorly controlled asthma and well-controlled asthma contributing 969.0 (95% CI 961.6 to 976.4) and 116.6 (95% CI 114.3 to 118.9) tonnes CO2e/10 000 person-years, respectively (figure 2B). Inpatient hospitalisations accounted for the highest per capita exacerbation-related excess GHG emissions (figure 2C). Per capita routine HCRU-related excess GHG emissions were 8.7-fold higher in poorly controlled asthma versus well-controlled asthma (figure 2D). Across disease severities, poorly controlled asthma was associated with greater excess emissions than well-controlled asthma (BTS steps 0–4; online supplemental figure S1B).
 Figure 2
 Excess greenhouse gas emissions due to suboptimal asthma control during the first year of follow-up stratified by asthma control in UK patients with asthma. (A) Overall excess CO2e emissions in tonnes and excess CO2e emissions in tonnes scaled to the UK asthma population. (B) Overall excess CO2e emissions per capita. (C) Exacerbation-related excess CO2e emissions per capita. (D) Routine HCRU-related excess CO2e emissions per capita. Estimates are subject to rounding. Values in parentheses represent 95% CI unless otherwise stated. CO2e, carbon dioxide equivalent; ED, emergency department; GP, general practitioner; HCRU, healthcare resource utilisation; OCS, oral corticosteroid; per capita, per 10 000 person-years; SABA, short-acting β2-agonist.
Scaled to the national level, excess GHG emissions of 334 604 tonnes CO2e (range: (0.1×) 319 329‒(10×) 487 351 tonnes CO2e; 95% CI 331 670 to 337 537) were observed, with poorly controlled asthma contributing to 90.8% of these emissions (figure 2A).
GHG emissions during the first year of follow-up stratified by medication use, SES and care pathwayWhen stratified by SABA prescriptions (0 to >12 SABA canisters), per capita GHG emissions increased with higher SABA canister counts (online supplemental table S5). High SABA use of 3‒12 canisters/year accounted for 58.3% of overall GHG emissions (figure 3A). High SABA use of >12 canisters/year contributed most to per capita GHG emissions versus high SABA use of 3‒12 canisters/year and optimal SABA use (figure 3B). Across prescription volumes, SABA relievers contributed most to per capita GHG emissions, with smaller fractions from ICS use, exacerbations and routine HCRU (figure 3B). Inpatient hospitalisations accounted for the highest per capita exacerbation-related GHG emissions (figure 3C). For routine HCRU, the majority of per capita GHG emissions were contributed by GP visits for optimal SABA use and high SABA use of 3‒12 canisters/year (figure 3D).
 Figure 3
 Greenhouse gas emissions during the first year of follow-up stratified by SABA use groups in UK patients with asthma. (A) Overall CO2e emissions in tonnes and CO2e emissions in tonnes scaled to the UK asthma population. (B) Overall CO2e emissions per capita. (C) Exacerbation-related CO2e emissions per capita. (D) Routine HCRU-related CO2e emissions per capita. Estimates are subject to rounding. Values in parentheses represent 95% CI unless otherwise stated. *ICS-related CO2e emissions include all ICS-containing therapies (ICS, ICS/LABA or ICS/LABA/LAMA in combination or as separate inhalers). †Includes emissions from other asthma medications, including LABA, LAMA, LABA/LAMA, LTRA, OCS maintenance, theophylline, aminophylline and biologics. CO2e, carbon dioxide equivalent; ED, emergency department; GP, general practitioner; HCRU, healthcare resource utilisation; ICS, inhaled corticosteroid; LABA, long-acting β2-agonist; LAMA, long-acting muscarinic antagonist; LTRA, leukotriene receptor antagonist; OCS, oral corticosteroid; per capita, per 10 000 person-years; SABA, short-acting β2-agonist.
Stratification by SES indicated that per capita GHG emissions increased from least deprived (IMD1) to most deprived (IMD5) areas of the UK (figure 4A). Regardless of SES, SABA use and ICS use contributed most to overall GHG emissions (figure 4B). Although GHG emissions were not notably different across IMD groups, they were highest in the most deprived areas. Per capita exacerbation-related GHG emissions were lowest in IMD1 and highest in IMD5 (figure 4C). Per capita routine HCRU-related GHG emissions were lowest in IMD5 and highest in IMD4 (figure 4D).
 Figure 4
 Greenhouse gas emissions during the first year of follow-up stratified by SES (based on IMD) in UK patients with asthma. (A) Overall CO2e emissions in tonnes and CO2e emissions in tonnes scaled to the UK asthma population. (B) Overall CO2e emissions per capita. (C) Exacerbation-related CO2e emissions per capita. (D) Routine HCRU-related CO2e emissions per capita. Estimates are subject to rounding. Values in parentheses represent 95% CI unless otherwise stated. *ICS-related CO2e emissions include all ICS-containing therapies (ICS, ICS/LABA or ICS/LABA/LAMA in combination or as separate inhalers). †Includes emissions from other asthma medications, including LAMA, LABA, LABA/LAMA, LTRA, OCS maintenance, theophylline, aminophylline and biologics. CO2e, carbon dioxide equivalent; ED, emergency department; GP, general practitioner; HCRU, healthcare resource utilisation; ICS, inhaled corticosteroid; IMD, Index of Multiple Deprivation; LABA, long-acting β2-agonist; LAMA, long-acting muscarinic antagonist; LTRA, leukotriene receptor antagonist; OCS, oral corticosteroid; per capita, per 10 000 person-years; SABA, short-acting β2-agonist; SES, socioeconomic status.
The GHG emissions stratified by ICS dose and care pathway are provided in online supplemental tables S6 and S7.
DiscussionIn this nationwide study, asthma care accounted for 750 540 (95% CI 746 692 to 754 388) tonnes CO2e annually when scaled to the UK asthma population, with poorly controlled asthma contributing nearly 80% of these emissions. At the national level, poorly controlled asthma was associated with excess GHG emissions of 303 874 (95% CI 301 239 to 306 509) tonnes CO2e annually, which was equivalent to emissions from >124 000 houses in the UK in 2020.37 38 Poorly controlled asthma was associated with approximately eightfold higher per capita excess GHG emissions versus well-controlled asthma. SABA relievers represented the largest contributors to per capita asthma-related GHG emissions, accounting for >60% of overall GHG emissions and >90% of excess GHG emissions. These findings indicate that efforts to improve asthma treatment practices to curtail high SABA use as part of an overall management strategy that seeks to implement evidence-based treatment recommendations and address other contributing factors to poor asthma control, such as suboptimal adherence to medication and poor inhaler technique,8 could result in substantial carbon savings. This concept of coupling optimised patient outcomes with environmental targets to decrease GHG emissions would enable healthcare systems to meet their carbon emission reduction goals and might also be extended to other chronic progressive diseases, particularly those associated with multimorbidities. Notably, in an attempt to balance environmental sustainability with respiratory healthcare, the European Respiratory Society in its recent position statement on asthma and the environment introduced the concept of the ‘green asthma patient’ and recommended that patients should be supported by greener healthcare regulations to make lifestyle changes and conscious choices to reduce the environmental impact of their treatment, without compromising their health.39
To our knowledge, no other study has attempted to quantify the carbon footprint of all aspects of asthma care, although the carbon footprint of healthcare systems has been estimated on a global40 as well as a country level.41–45 In the current study, routine HCRU and exacerbations contributed to overall GHG emissions, although in comparatively lower proportions than inhaled asthma pharmacotherapies. Poorly controlled asthma generated higher emissions associated with routine HCRU and exacerbations than well-controlled asthma. Inpatient hospitalisations contributed most to exacerbation-related emissions. Per capita GHG emissions associated with routine HCRU and exacerbations were higher among patients seen in both primary and specialty care settings versus primary care alone. Overall, these results align with previous research on asthma-related HCRU.10 46
In line with previous studies,47 48 higher asthma care-related GHG emissions were observed among residents of the most socioeconomically deprived areas of the UK. Although GHG emissions were not notably different across IMD groups, SABA and ICS use largely contributed to emissions, followed by exacerbations and routine HCRU. Therefore, targeted interventions designed to increase healthcare access for patients living in socioeconomically disadvantaged areas could promote improved clinical outcomes and deplete the carbon footprint of the UK health system.
Our study indicates that poorly controlled asthma contributes to a large proportion of asthma care-related GHG emissions, with SABA use emerging as the single largest contributor, irrespective of asthma control or SES. Since 2019, the Global Initiative for Asthma (GINA) no longer recommends SABA as the preferred reliever for acute asthma symptoms based on evidence of an increased risk of severe exacerbations and asthma-related mortality associated with SABA-only treatment.49 Adoption of GINA-guided treatment strategies could assist healthcare systems to decarbonise care pathways. In addition, self-management of asthma, supported by asthma action plans and regular clinical evaluations, is fundamental to asthma control and has been shown to reduce asthma symptoms and HCRU, including unscheduled primary care visits, ED visits and hospitalisations.50 Therefore, prioritising asthma care through early and accurate diagnosis; use of recommended effective therapies and process improvements in asthma management by clinicians, healthcare decision-makers and policymakers can foster better and sustained clinical outcomes and subsequently reduce excess GHG emissions.
The extraction of patient data from CPRD yielded results generalisable to the asthma population across the UK,51 and access to anonymised data routinely collected as part of patient care mitigated participation and recording biases. However, certain limitations must be acknowledged. In spite of using validated Read codes with a high positive predictive value25 to identify an asthma diagnosis, all patients with mild disease may not have been captured. However, given the lower carbon footprint at BTS step 0 (~10% of the scaled national value), the omission of some patients with mild disease is expected to minimally impact overall GHG emissions. Although CO2e emissions were stratified by ICS use and BTS treatment steps, this analysis did not account for potential confounding by ICS dose. While a reduction in SABA use may be accompanied by an increase in ICS uptake,52 the decline in SABA-related carbon emissions is unlikely to be accompanied by an equivalent increase in GHG emissions associated with ICS-containing medications. This may be explained by the fact that pMDIs, which are more commonly prescribed in the UK as reliever therapy than preventer therapy (>80% vs ~65%),27 have a considerably higher carbon footprint than DPIs (16.0–37.0 vs 0.8–2.0 kg CO2e per device),11 31 53 54 commonly used for ICS-containing medications. While it is a challenge to quantify differences in the carbon footprint associated with reliever and preventer inhaler use in a retrospective analysis, our findings indicate that curbing high SABA use may be accompanied by an overall reduction in asthma care-related carbon emissions. The CPRD provides nationally representative and comprehensive real-world data from GP practices across the UK55; however, some aspects of health may be recorded infrequently, and certain patient groups may not be captured.51 Due to a lack of alternative measures of asthma symptom control in the CPRD, poorly controlled disease was defined based on prescription of ≥3 SABA canisters/year or ≥1 asthma exacerbation at baseline. Since the carbon footprint of poorly controlled asthma was largely SABA-induced, high reliever use at baseline, as part of the definition for poorly controlled disease, may partially explain the increased GHG emissions observed during follow-up. Patients with severe asthma and chronic OCS use were excluded from the study due to the inherent challenges of documenting their complete treatment regimen in primary care records. These patients likely experience higher asthma exacerbation rates and HCRU; however, as they were <0.3% of the study population, their exclusion would not have substantially altered the results. Finally, results from this study were largely descriptive in nature. Additionally, allowances must be made for several uncertainties. Factors other than the level of asthma symptom control, such as high reliever prescribing patterns that have been observed in some primary care networks in the UK, may also have contributed to high SABA use.52 Prescription data may not reflect actual dispensing in the real world which may contribute to an overestimation of the carbon footprint from prescribed medication. However, once dispensed, the carbon impact of the inhaler device is already largely apparent regardless of inhaler use as manufacture and transport comprises the majority of the cradle-to-grave carbon footprint of inhaler devices.31 For a pMDI, the propellant contained within the inhaler will almost inevitably be released into the atmosphere, either through prescribed use or because patients commonly dispose of their dispensed inhalers (whether empty or not) in the general waste due to a lack of inhaler recycling schemes in the UK,31 where degradation of the canister will eventually result in the release of the contained propellant into the atmosphere, thereby contributing to global warming. Data on medication use during a hospital admission or an ED visit were not available. CO2e emissions were calculated by applying approximations based on published guidelines and estimates, which are susceptible to variability and tend to evolve over time. CO2e emissions were calculated for standard types of HCRU, which may have lower or higher CO2e emissions than asthma-related HCRU and may also vary between healthcare institutions given regional and local differences in routine clinical practice. These uncertainties were overcome, at least in part, by performing a sensitivity analysis to demonstrate the potential range of GHG emissions from 10-fold to one-tenth of current values. Finally, certain individual patients (in either the well-controlled or poorly controlled asthma groups) may have been classified differently, as evidenced by the fact that a small proportion of patients categorised as having well-controlled asthma at baseline experienced exacerbations during the first year of follow-up. Nevertheless, the definition of poorly controlled asthma used in this study reflects a level of SABA prescriptions that has clearly been associated with inadequate disease control and adverse outcomes.18 19
In conclusion, the present findings demonstrate that targeting improved asthma outcomes by mitigating the high burden of poorly controlled asthma may elicit significant declines in carbon emissions. HCPs and policymakers are in a unique position to assist in resolving the current climate emergency by improving the quality of treatment across asthma severities through actionable process improvements and policies to ensure broader access to guideline-directed controller therapies, with a view towards optimising patient-centric asthma care, curtailing high SABA use and minimising the risk of severe exacerbations.
留言 (0)