
記住我
In the present study, the claustrostriatal connectivity has been analyzed based on the results from retrograde tracer injections in post-commissural and pre-commissural putamen and in the caudate head in 4 Macaca mulatta. As in all these cases the labeled corticostriatal neurons largely involved frontal and parietal areas, the comparison with the claustrocortical connectivity was based on results from retrograde tracer injections in 18 additional macaques (9 Macaca fascicularis, 4 Macaca nemestrina, and 5 Macaca mulatta), mostly in prefrontal, frontal motor, and parietal areas. Table 1 summarizes the cases used in the present study. As most of these cases have been already used in previous studies focused on corticocortical or corticostriatal connectivity (see for references Table 1), in this section for the sake of clarity and consistency we reuse the description of authorizations, surgical procedures, brain perfusion, histological processing, and immunohistochemical procedures already provided in previous studies (Matelli et al. 1998; Luppino et al. 1993, 2001, 2003; Rozzi et al. 2006; Borra et al. 2008, 2010, 2011, 2019, 2022; Gerbella et al. 2010; 2013; Caminiti et al. 2021).
Table 1 Cases used in the present studyAnimal handling as well as surgical and experimental procedures complied with the European (directives 86/609/EEC, 2003/65/CE, and 2010/63/EU) and Italian (D.L. 116/92 and 26/2014) laws in force on the humane care and use of laboratory animals. All procedures were approved by the Veterinarian Animal Care and Use Committee of the University of Parma and of the University of Rome SAPIENZA and authorized by the Italian Ministry of Health.
Under general anesthesia (see previous studies indicated in Table 1 for the different protocols) and aseptic conditions, each animal was placed in a stereotaxic apparatus and an incision was made in the scalp. The skull was trephined to remove the bone and the dura was opened to expose a small cortical region. After the neural tracer injections, the dura flap was sutured, the bone replaced, and the superficial tissues sutured in layers. During surgery, hydration was maintained with saline, and heart rate, blood pressure, respiratory depth, and body temperature were continuously monitored. Upon recovery from anesthesia, the animals were returned to their home cages and closely observed. Dexamethasone and prophylactic broad-spectrum antibiotics were administered pre- and postoperatively, as were analgesics.
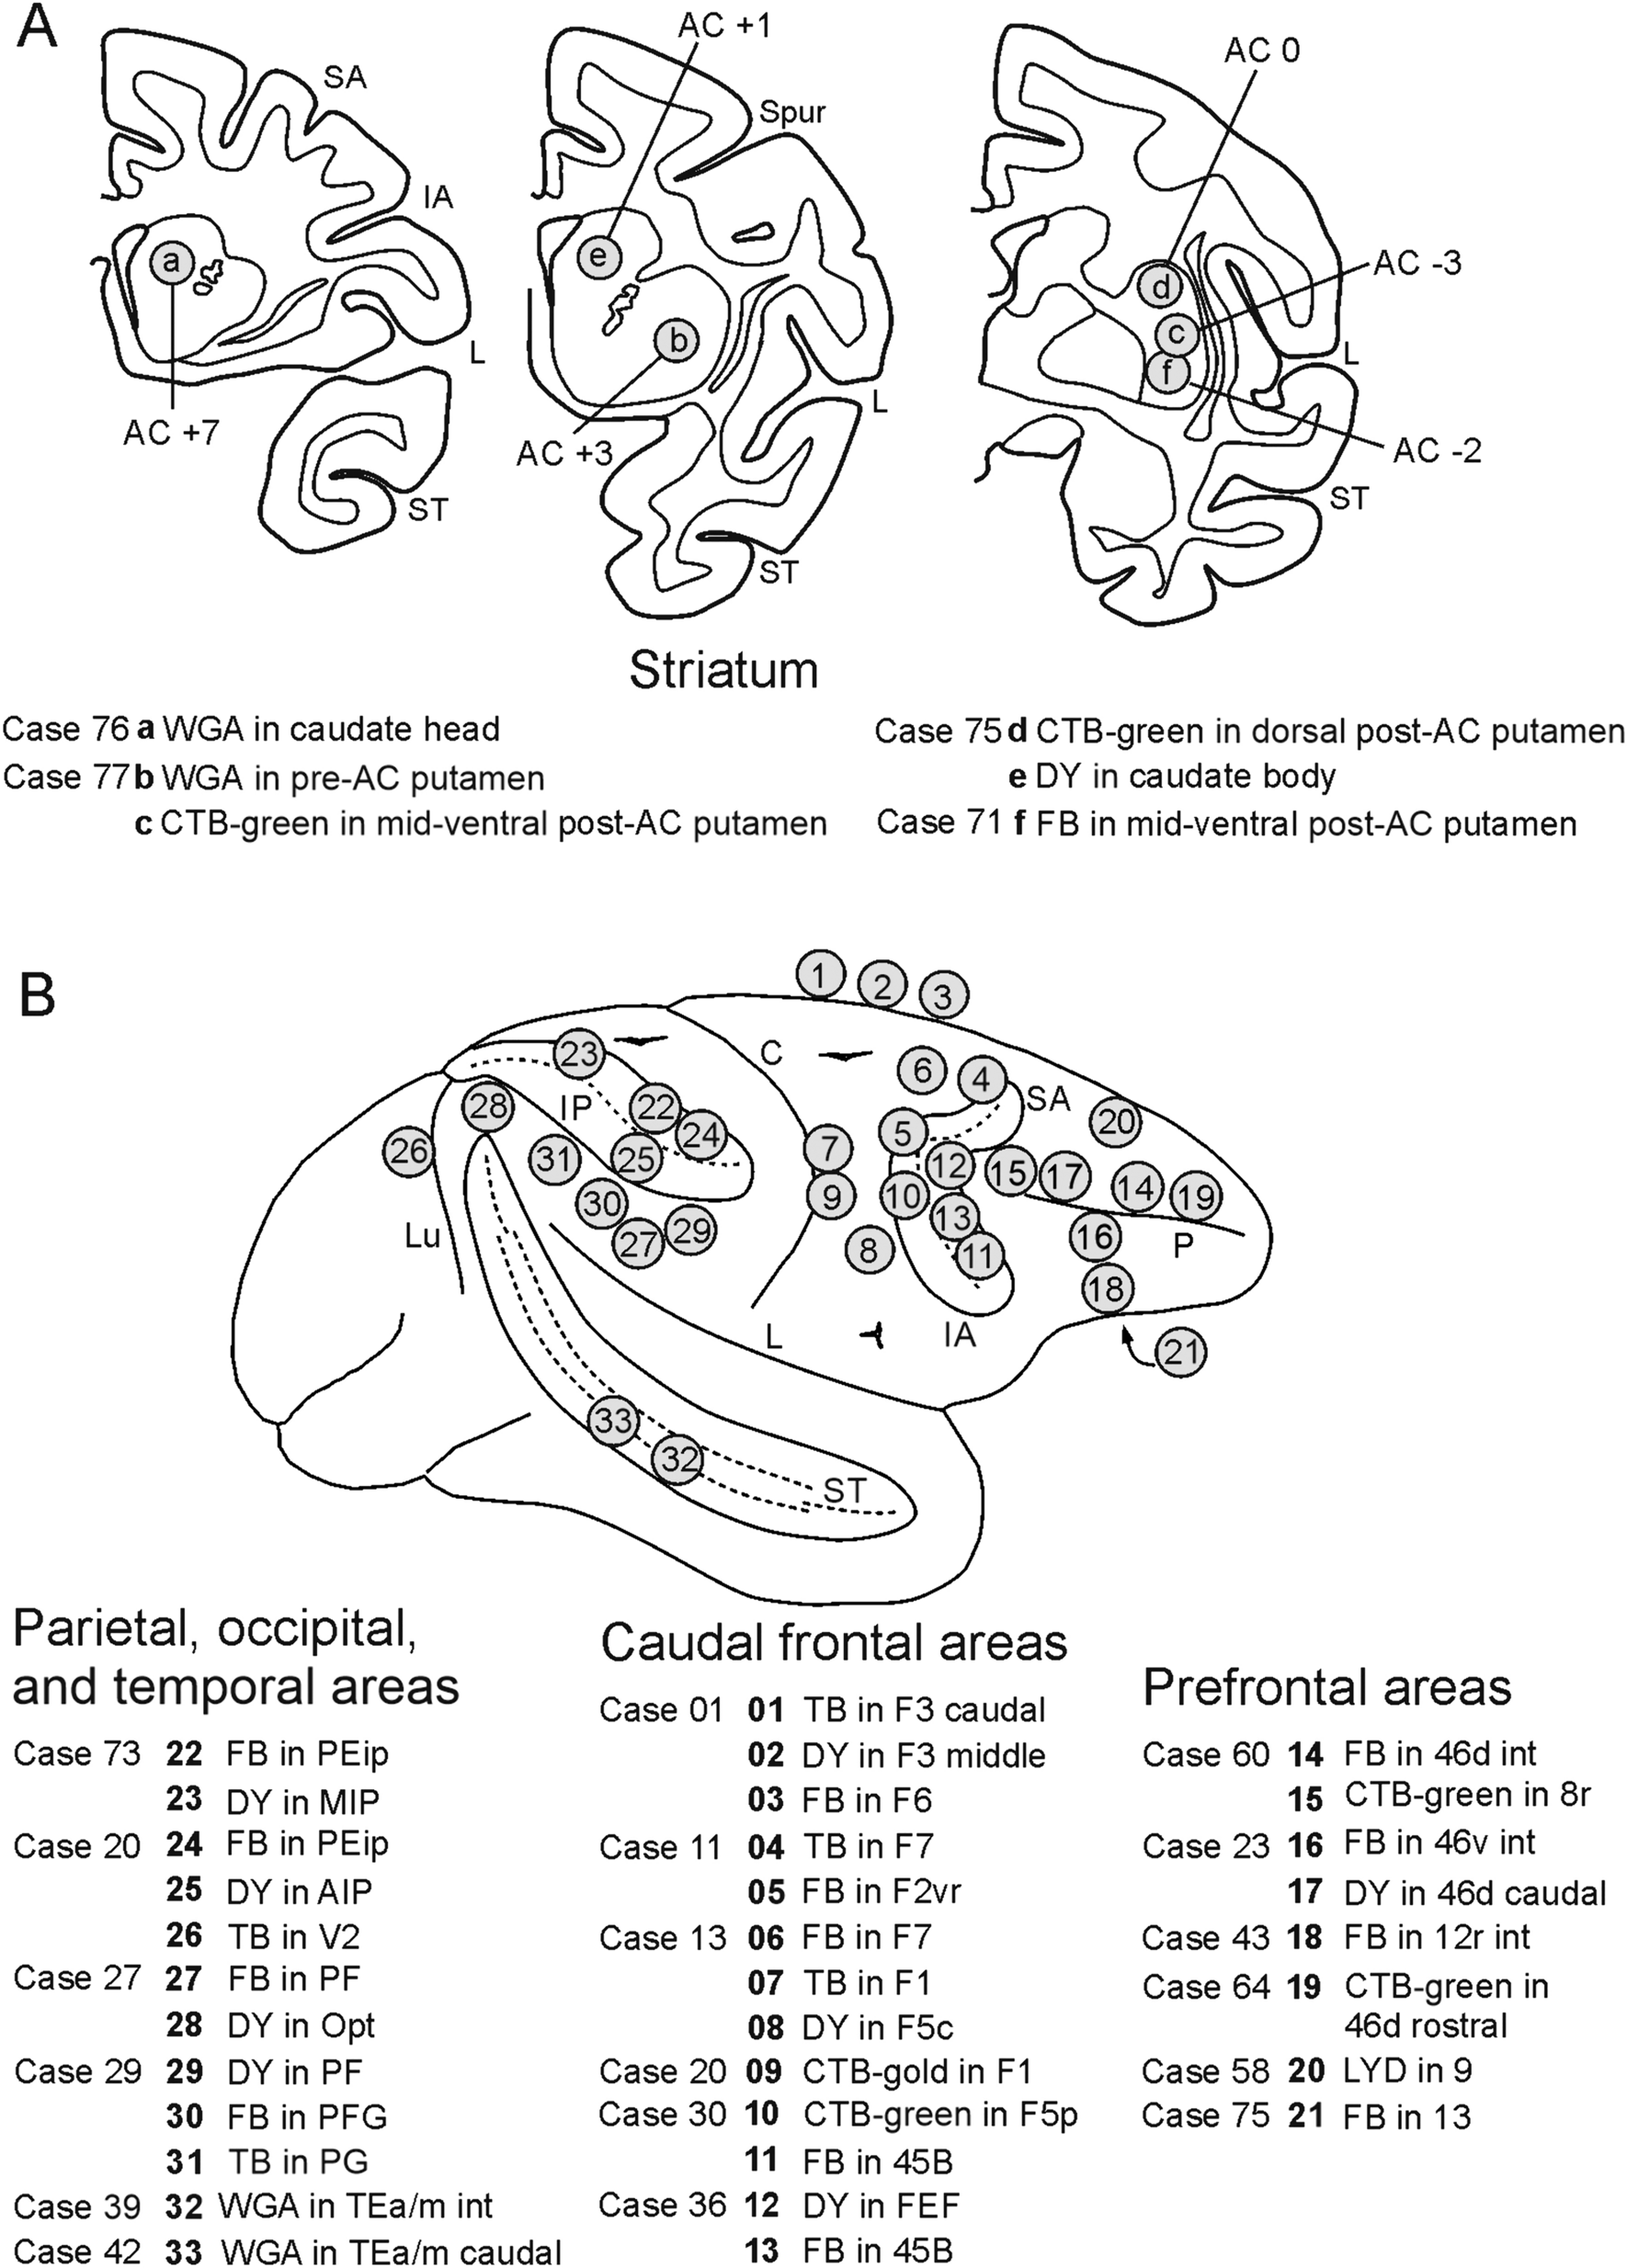
Tracer injections and histological proceduresOnce the appropriate site was chosen, the neural tracers Fast Blue (FB, 3% in distilled water, Dr Illing Plastics GmbH, Breuberg, Germany), Diamidino Yellow (DY, 2% in 0.2 M phosphate buffer at pH 7.2, Dr Illing Plastics), True Blue (TB, 5% in distilled water, EMS-POLYLOY GmbH, Gross-Umstadt, Germany), Wheat Germ Agglutinin (WGA; 4% in distilled water, Vector Laboratories, Burlingame, CA), Dextran conjugated with Lucifer Yellow (Lucifer Yellow Dextran, LYD, 10 000 MW, 10% 0.1 M phosphate buffer, pH 7.4; Invitrogen, Thermo Fisher Scientific, Waltham, MA) or with tetramethylrhodamine (Fluoro-Ruby, FR, 10% 0.1 M phosphate buffer, pH 7.4; Invitrogen), Cholera Toxin B subunit, gold conjugated (CTB gold, 0.5% in distilled water, LIST, Campbell, California), or conjugated with Alexa 488 (CTB green) or Alexa 594 (CTB red; 1% in 0.01 M phosphate-buffered saline at pH 7.4, Molecular Probes, Thermo Fisher Scientific), were slowly pressure-injected in the cases of striatal injections through a stainless steel 31 gauge beveled needle attached through a polyethylene tube to a Hamilton syringe (Hamilton Company, Reno NV), or in the cases of cortical injections through a glass micropipette (tip diameter: 50–100 μm) attached to a 5- or 10-μL Hamilton micro syringe, positioned with a stereotaxic holder. For all tracer injections in the striatum, the needle was lowered within a guiding tube to avoid tracer spillover in the white matter. Table 1 and Fig. 1 summarize the locations of the injections, the injected tracers, and the amounts injected.
Fig. 1
Location of the injection sites in the striatum and the cortex. A The location of the injection sites in the putamen and the caudate and their AP level is indicated in section drawings taken at three different rostrocaudal levels shown from caudal to rostral. B Summary view of the location of the cortical injection sites mapped onto a drawing of a template hemisphere. For the sake of simplicity, in this view only the injection sites of the cases shown in Figures 5, 6 and 7 are included. The arcuate, intraparietal, and superior temporal sulci are shown as “opened” to better show the location of the injection sites in the banks. C, central sulcus; IA, inferior arcuate sulcus; IP, intraparietal sulcus; L. lateral fissure; Lu, lunate sulcus; P. principal sulcus; SA, superior arcuate sulcus; Spur, spur of the arcuate sulcus; ST, superior temporal sulcus
After appropriate survival periods following the injections (48 h for WGA, 15–28 days for the other tracers), each animal was deeply anesthetized with an overdose of sodium thiopental and perfused through the left cardiac ventricle consecutively with saline (about 2 L in 10 min), 3.5% formaldehyde (5 L in 30 min), and 5% glycerol (3 L in 20 min), all prepared in 0.1 M phosphate buffer, pH 7.4. Each brain was then blocked coronally on a stereotaxic apparatus, removed from the skull, photographed, and placed in 10% buffered glycerol for 3 days and 20% buffered glycerol for 4 days. Finally, each brain was cut frozen into coronal sections of 60-μm or 50-μm (Cases 62, 71, 76 and 77) thickness.
In all cases in which fluorescent neural tracer were injected (FB, DY, TB, CTB-green, CTB-red), sections spaced 300 μm apart—that is one section in each repeating series of 6 in Cases 62, 71, 76, and 77 and one in series of 5 in the other cases—were mounted, air-dried, and quickly coverslipped for fluorescence microscopy. Other series of sections spaced 300 μm apart were processed for visualizing CTB green (Cases 64, 75, and 77), LYD (Cases 58 and 62), FR (Case 62) or WGA (Cases 39, 42, 76, and 77) with immunohistochemistry. As in all these cases, an additional injection of the (mostly) anterograde neural tracer biotinylated dextran-amine (BDA) was placed at the cortical level but not considered for the present study, to distinguish the BDA-labeling from the labeling of the other neural tracers visualized using biotinylated secondary antibodies, the sections were processed for the visualization of both BDA and FR, LYD, CTB green, or WGA, using the double labeling protocol described in detail in Gerbella et al. (2010, 2016). Briefly, the sections were first processed to visualize BDA, i.e., incubated overnight in the ABC solution (Vectastain ABC kit, PK-4000, Vector Laboratories) and then BDA was stained brown using 3,3′-diaminobenzidine (DAB, Sigma-Aldrich, St. Louis, MO). Then, the sections were incubated overnight in avidin–biotin blocking reagent (SP-2001, Vector Laboratories), and for 72 h at 4 °C in a primary antibody solution of rabbit anti-FR, or rabbit anti-LY (1:3000; Invitrogen), or rabbit anti-Alexa 488 (1:15,000, Thermo Fisher Scientific) in 0.5% Triton, 5% normal goat serum (Vector Laboratories) in PBS, or overnight at room temperature in a primary antibody solution of goat anti-WGA (1:2000; Vector Laboratories) in 0.3% Triton and 5% normal rabbit serum (Vector Laboratories) in PBS. The sections were then incubated for 1 h in biotinylated secondary antibody (1:200, Vector Laboratories) in 0.3% Triton, 5% normal goat serum (normal rabbit serum for WGA) in PBS. Finally, FR, LYD, CTB green, and WGA labeling was visualized using the Vectastain ABC kit and the Vector SG peroxidase substrate kit (SK-4700, Vector Laboratories) as a chromogen. With this procedure, BDA labeling was stained brown and the FR, LYD, or CTB green labeling was stained blue in the same tissue sections. In Case 30, CTB-green labeling was visualized only in fluorescence microscopy. In Case 20, CTB gold was revealed by the silver-intensification protocol described by Kritzer and Goldman-Rakic (1995).
In all cases, sections spaced 300 μm apart were stained with the Nissl method (0.1% thionin in 0.1 M acetate buffer, pH 3.7).
Data analysisAll the injection sites used in this study were completely confined to the target striatal nucleus (caudate or putamen) or to the thickness of cortical areas. Photomicrographs of the striatal tracer injections used in the present study are shown in Fig. 2. For the areal attribution of the injection sites and of the labeled corticostriatal neurons, the cortex was subdivided according to architectonic or connectional criteria described in detail in Caminiti et al. (2017).
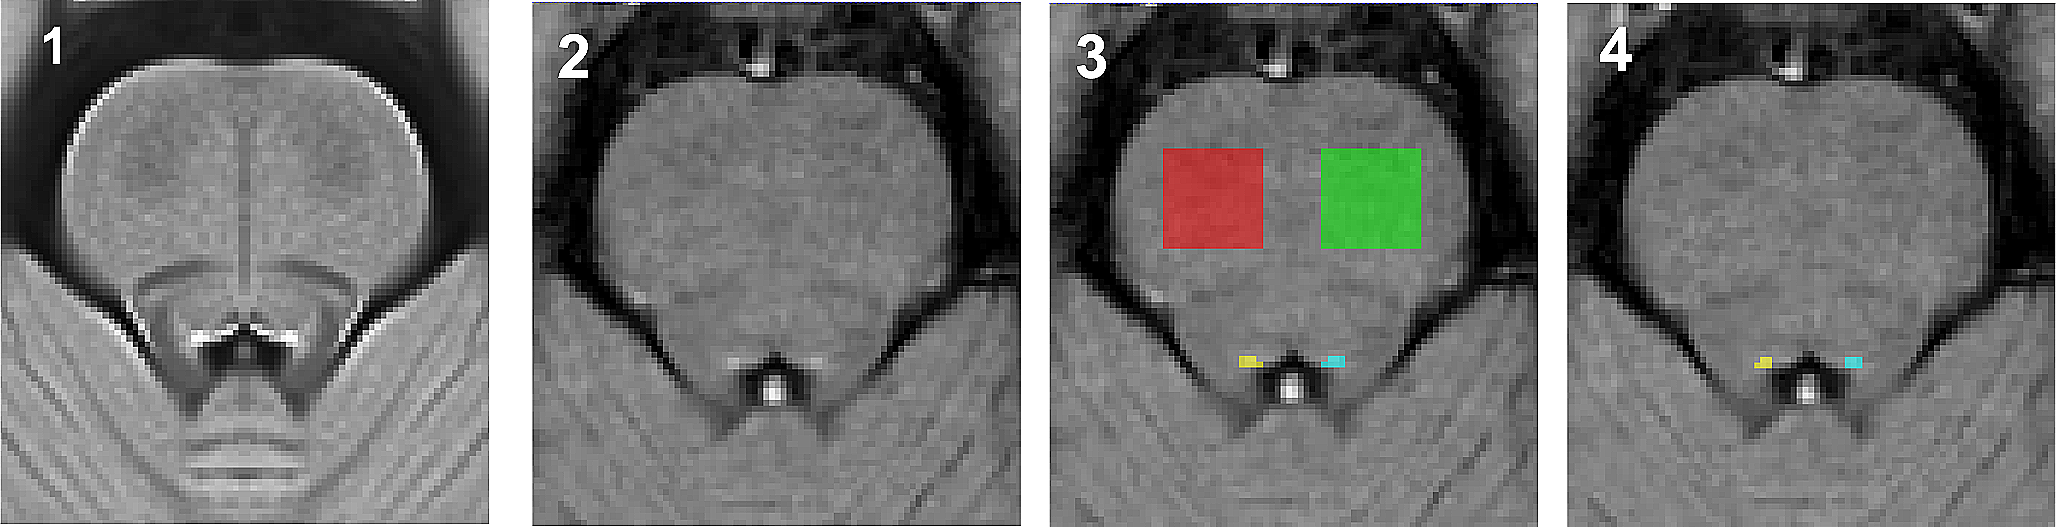
Fig. 2
Location of the injection sites in the striatum shown in drawings of coronal sections and in brightfield (for WGA injections) and epifluorescence (for CTB green, DY, and FB injections) photomicrographs. In the drawings, all injection sites except for WGA are depicted as a black zone corresponding to the core, surrounded by a gray zone, corresponding to the halo. WGA injection sites are depicted as a gray zone because of the poor definition of the core versus the halo. Calibration bars shown for the section drawing and the photomicrograph of Case 76 WGA apply to all section drawings and photomicrographs, respectively. Cd, caudate nucleus; Cla, claustrum; CTBg, CTB green; GP, globus pallidus. Other abbreviations as in Fig. 1
In the cases of striatal injections, the distribution of the corticostriatal labeled neurons was analyzed as described in detail in Borra et al. (2022). In all cases, the distribution of retrograde labeling in the ipsilateral claustrum was plotted in sections every 600 μm together with the claustral border, using a computer-based charting system. Data from individual sections were then imported into the 3-dimensional (3D) reconstruction software (Demelio et al. 2001) providing volumetric reconstructions of the monkey claustrum. This procedure is the same used for the visualization of the distribution of corticostriatal neurons in 3D reconstructions of the ipsilateral hemisphere. In most cases, sections through the contralateral claustrum have been examined to look for retrograde and/or anterograde labeling. This labeling was absent after the striatal neural tracer injections and negligible after the cortical injections.
In the cases in which the total number of cortical neurons labeled after striatal or cortical tracer injections was available, the weight of claustrostriatal and claustrocortical projections was expressed as percentage of labeled neurons found in the claustrum, relative to the overall cortical labeling.
To describe the location of the claustral labeling, the medial views of the 3D claustral reconstructions were subdivided into quadrants, similarly to Gamberini et al. (2017, 2021), as shown in Fig. 3. Specifically, each 3D reconstruction was inscribed into a trapezoid in which 3 sides were represented by the dorsal, anterior, and ventral border of the claustrum. The fourth side was parallel to the anterior one and placed in the caudal part of the 3D reconstruction just rostral to its rounded end. Then, two lines connecting the middle of opposite sides defined the quadrants. The claustral labeling was then analyzed in terms of percent distribution of the labeled cells in each quadrant.
Fig. 3
Subdivision of the claustrum into quadrants. A medial view of a 3D claustral reconstruction was inscribed into a trapezoid in which 3 sides are represented by the dorsal, anterior, and ventral border of the claustrum. The fourth side is parallel to the anterior one and placed in the caudal part of the 3D reconstruction, just rostral to its rounded end. The two lines connecting the middle of opposite sides define the quadrants
Furthermore, composite views of the overall distribution of the claustral labeled regions observed after all the neural tracer injections were obtained by warping with Adobe Photoshop individual medial views of claustral reconstructions to a template one (Case 77 right) using as reference points the geometrical landmarks adopted for defining claustral quadrants (Fig. 3). As the reconstructions of different cases were very similar, the distortions caused by this warping procedure were in general small. Claustral labeled territories were then delineated by excluding scattered labeled neurons. For areas injected in more than one case, the labeled territory was defined by combining individual labeling distributions.
留言 (0)