
記住我


LINGER is a computational framework designed to infer GRNs from single-cell multiome data (Fig. 1 and Methods). Using count matrices of gene expression and chromatin accessibility along with cell type annotation as input, it provides a cell population GRN, cell type-specific GRNs and cell-level GRNs. Each GRN contains three types of interactions, namely, trans-regulation (TF–TG), cis-regulation (RE–TG) and TF-binding (TF–RE). Note that TF–TF interactions are included in TF–TG pairs but TF self-regulation, which is challenging to model without additional data, is not considered. LINGER is distinguished by its ability to integrate the comprehensive gene regulatory profile from external bulk data. This is achieved through lifelong machine learning, also called continuous learning. The concept of lifelong learning is that the knowledge learned in the past helps us learn new things with little data or effort44. Lifelong learning has been proven to leverage the knowledge learned in previous tasks to learn the new task better45.
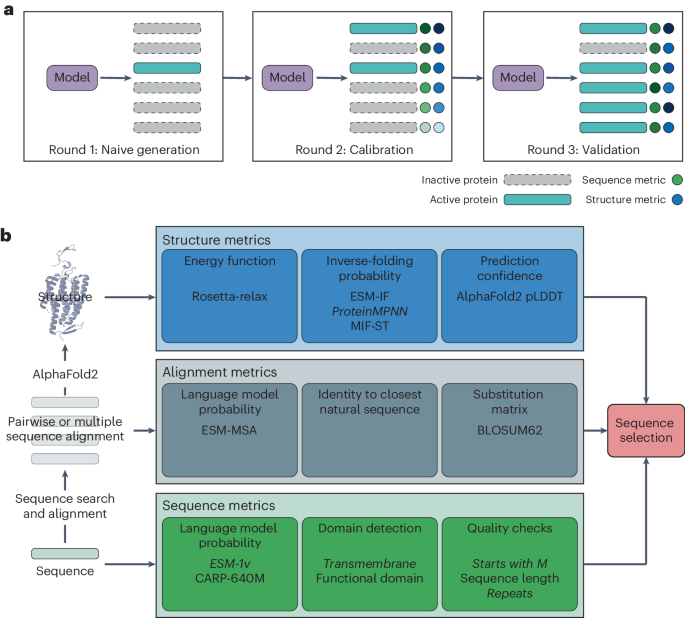
Fig. 1: Schematic overview of LINGER.
a, Schematic illustration of LINGER: a model predicting gene expression by TF expression and chromatin accessibility using a neural network model. LINGER pre-trains on the atlas-scale external bulk data and retains parameters by lifelong learning. The population-level GRN is generated from the neural network using the Shapley value. b, Strategy for constructing cell type-specific and cell-level GRNs. Cell type-specific and cell-level GRNs are inferred by an identical strategy, which combines consistent information across all cells, including regulatory strength, motif binding affinity and RE–TG distance, with context-specific information on gene expression and chromatin accessibility. c, Downstream analyses enabled by LINGER-inferred GRNs, including identifying complex regulatory landscape of GWAS traits and driver regulator identification.
LINGER leverages external data to enhance the inference from single-cell multiome data, incorporating three key steps: training on external bulk data, refining on single-cell data and extracting regulatory information using interpretable artificial intelligence techniques. In our approach, we use a neural network model to fit the expression of TGs, taking as input TF expression and the accessibility of REs. The second layer of the neural network model consists of weighted sums of TFs and REs, forming regulatory modules guided by TF–RE motif matching by incorporating manifold regularization. This leads to the enrichment of TF motifs binding to REs that belong to the same regulatory module. First, we pre-train using external bulk data obtained from the ENCODE project46, which contains hundreds of samples covering diverse cellular contexts, referred to as BulkNN.
For refinement on single-cell data, we apply elastic weight consolidation (EWC) loss, using bulk data parameters as a prior. The magnitude of parameter deviation is determined by the Fisher information, which reflects the sensitivity of the loss function to parameter changes. In the Bayesian context, knowledge gained from the bulk data is the prior distribution, forming our initial beliefs about the model parameters. As the model trains on new single-cell data, the posterior distribution is updated, combining the prior knowledge with the likelihood of the new data. EWC regularization encourages the posterior to remain close to the prior, retaining knowledge while adapting, preventing excessive changes and ensuring a more stable learning process47. After training the neural network model on single-cell data, we infer the regulatory strength of TF–TG and RE–TG interactions using the Shapley value, which estimates the contribution of each feature for each gene. The TF–RE binding strength is generated by the correlation of TF and RE parameters learned in the second layer (Fig. 1a). LINGER then constructs the cell type-specific and cell-level GRNs based on the general GRN and the cell type-specific profiles (Fig. 1b and Methods).
We will use independent datasets to validate the inference of GRN and then perform several downstream analyses: first, identification of the disease or trait-related cell type, TFs and GRN combining genome-wide association studies (GWAS) data; second, constructing regulon activity on external expression data and identifying driver regulators as differentially active TFs (Fig. 1c).
LINGER improves the cellular population GRN inferenceTo assess the performance of LINGER, we used a public multiome dataset of peripheral blood mononuclear cells (PBMCs) from 10× Genomics (see Methods for details). To investigate whether a linear model is adequate for modeling gene expression or whether a non-linear model is necessary, we conducted a comparative analysis between two models. The first model employs an elastic net to predict the expression of TG by TFs and REs. The second model, single-cell neural network (scNN), is a three-layer neural network model sharing LINGER’s architecture. We assessed the gene expression prediction ability of the two models using fivefold cross-validation. We found that scNN modeled gene expression better than elastic net, with −log10P = 572.09, especially for those substantial proportions of genes that show negative Pearson’s correlation coefficient (PCC) in elastic net predictions (−log10P = 1,060.17; Fig. 2a). This demonstrates that the three-layer neural network model scNN outperforms the elastic net model in predicting gene expression.
Fig. 2: LINGER improves the cellular population GRN inference.
a, Correlation between predicted and real gene expression, showing higher accuracy for scNN than elastic net. The x axis represents the PCC of genes predicted by elastic net and real gene expression across cells, while the y axis gives the PCC for scNN. The points represent genes and the color of the points represents the density. The color of distribution in b–e indicates the different methods: orange, LINGER; gray, elastic net; dark green, scNN; blue, BulkNN; light blue, PCC. Null hypothesis testing results in a t-statistic with an effect size of 53.46, df = 15,659, −log10P = 572.09 and 95% confidence interval of [0.058, 0.063] from a two-sided paired t-test. b, Boxplot of the performance metric AUC for the predicted trans-regulatory strength across all ground truth data. The ground truth data for b and c are putative targets of TFs from 20 ChIP–seq data points from blood cells (n = 20 independent samples). PCC denotes Pearson’s correlation coefficient between the chromatin accessibility of RE and the expression of TG. Note that all boxplots in this study present minima and maxima, the smallest and largest value that is not considered an outlier; center, median; bounds of box, 25th (Q1) to 75th (Q3) percentile; whiskers, 1.5 times the (Q3–Q1). In this study, we use the following convention for symbols indicating statistical significance: ns, P > 0.05; *P ≤ 0.05; **P ≤ 0.01; ***P ≤ 0.001; ****P ≤ 0.0001. We hide the ns symbol when displaying significance levels. In detail, P = 8.32 × 10⁻⁶ for LINGER and scNN, P = 8.57 × 10⁻⁵ for LINGER and BulkNN and P = 1.24 × 10⁻³ for LINGER and PCC. c, Boxplot of the performance metric AUPR ratio for the predicted trans-regulatory strength. P values in b and c are from one-sided paired t-tests. In detail, P = 3.49 × 10⁻³ for LINGER and scNN, P = 2.13 × 10⁻⁴ for LINGER and BulkNN and P = 4.53 × 10⁻⁴ for LINGER and PCC. d, AUC for cis-regulatory strength inferred by LINGER. The ground truth data for d and e are the variant-gene links from eQTLGen. We divide RE–TG pairs into different groups based on the distance of the RE from the TSS of TG. e, AUPR ratio for cis-regulatory strength. f, Classification of the trans-dominant or cis-dominant gene. TFs contribute more to predicting the expression of trans-dominant genes, while REs contribute more to cis-dominant genes. g, Probability of trans-dominant and cis-dominant being loss-of-function (LoF)-intolerant genes. Points show estimated success probability from binomial distribution, at 0.26 and 0.09 for trans-dominant and cis-dominant, respectively. n = 317 and n = 693 independent sample size for trans-dominant and cis-dominant, respectively. Data are presented as means ± 1.96 × s.d.
To show the utility and effectiveness of integrating external bulk data, we compared LINGER to scNN, BulkNN and PCC. To evaluate the performance of trans-regulatory strength, we collected putative targets of TFs from chromatin immunoprecipitation followed by sequencing (ChIP–seq) data using a systematical standard (Methods) and, in total, obtained 20 data sets in blood cells as ground truth48 (Supplementary Table 1). For each ground truth, we calculated the area under the receiver operating characteristic curve (AUC) and the area under the precision–recall curve (AUPR) ratio (see Methods) by sliding the trans-regulatory predictions. Results show that scNN performs better than PCC and BulkNN. Compared to other methods, LINGER performs better, with a significantly higher AUC (Fig. 2b) and AUPR ratio (Fig. 2c) across all ground truth data.
To validate the cis-regulatory inference of LINGER, we calculated the consistency of the cis-regulatory coefficients with expression quantitative trait loci (eQTL) studies that link genotype variants to their TGs. We downloaded variant-gene links defined by eQTL in whole blood from GTEx49 and eQTLGen50 (Supplementary Table 2) as ground truth. As the distance between RE and TG is important for the prediction, we divided RE–TG pairs into different distance groups. LINGER achieved a higher AUC and AUPR ratio than scNN in all different distance groups in eQTLGen (Fig. 2d,e) as well as GTEx (Extended Data Fig. 1a,b). The above results show that LINGER improves the cis-regulatory and trans-regulatory strength inference by leveraging external data.
We next sought to investigate the dominant regulation for genes; that is, whether a gene is mainly regulated by cis-regulation or trans-regulation. To shed light on this question, we compared the average of cis-regulatory and trans-regulatory strength Shapley values by a two-sided unpaired t-test and performed Bonferroni P value correction. Our findings reveal that most genes exhibit no significant difference in cis-regulation and trans-regulation dominance. Specifically, 4.37% of genes are cis-regulation dominant, while 2.00% are trans-regulation dominant (Fig. 2f). To discern evolutionary distinctions between trans-dominant and cis-dominant genes, we compared their strength of selection using pLI, which is an estimate of the ‘probability of being loss of function intolerant’51. We observed that the percentage of selectively constrained genes with high pLI (>0.9) in the trans-dominant group was approximately three times higher than that in the cis-dominant group (Fig. 2g). A previous study found that disease-associated genes from GWAS were enriched in selectively constrained genes, while eQTL genes were depleted in selectively constrained genes52. These observations highlight the importance of the trans-regulatory network in understanding complex diseases. Functional enrichment analysis53 shows that the cis-regulatory dominant genes were significantly enriched in 38 GTEx aging signatures (Supplementary Table 3), which aligns with the conclusion that chromatin accessibility alterations occur in age-related macular degeneration54.
To gain an understanding of parameter sensitivity, we systematically evaluated the effects of TF–RE motif matching, cis-REs transcription start site (TSS) distance, activation function, number of nodes in hidden layers and metacell-generating method on the scNN. Note that the sigmoid activation function would not improve the gene expression prediction but would improve the GRN inference (Extended Data Fig. 2a). Using motif matching information by manifold regularization loss properly by setting the weight will improve the performance. Compared to 0, weight 0.01 improved the performance on 100% (Extended Data Fig. 2c) and 80% (Extended Data Fig. 2d) of ground truth data based on the AUC and AUPR ratio, respectively. The performance of weight 10 decreases compared to 0.01 (Extended Data Fig. 2c,d). To verify the robustness of our method to alternative metacell-generation approaches (see ‘PBMC 10× data’ in Methods), we used metacells generated by the SEACells as a substitute for our original metacells. There were no significant differences in the performance between SEACells metacells and our original metacells (two-sided paired t-test, P = 0.89; Extended Data Fig. 2e). Using REs within 1 Mb is the best across 200 kb, 500 kb, 1 Mb and 2 Mb (Extended Data Fig. 2f,g).
We evaluated LINGER’s capability for lifelong learning by leveraging additional data sources. We split the ENCODE data into two batches (ENCODE1, ENCODE2) and applied two rounds of pre-training, then trained on PBMCs single-cell multiome data (ENCODE1+ENCODE2+sc). We compared the results with those obtained by using one batch of ENCODE data as pre-training (ENCODE1+sc). Extended Data Fig. 2h shows that compared to single pre-training, the addition of the second round of pre-training improved the performance of TF–TG inference for 85.5% (17 out of 20) and 75% (15 out of 20) of ChIP–seq data based on the AUC and AUPR ratio, respectively. This validates LINGER’s capability for continuous refinement through incremental learning from diverse datasets.
LINGER improves the cell type-specific GRN inferenceWe evaluated the cell type-specific GRN inference (Methods) of LINGER in PBMCs sc-multiome data as well as an in-silico mixture of H1, BJ, GM12878 and K562 cell lines from single-nucleus chromatin accessibility and mRNA expression sequencing (SNARE-seq) data55. To assess TF–RE binding prediction, we used ChIP–seq data as ground truth, including 20 TFs from four cell types within the blood and 33 TFs from the H1 cell line48 (Supplementary Table 4). The putative target of TF from the ChIP–seq data serves as ground truth for the trans-regulatory potential. For the cis-regulatory potential, we incorporated promoter-capture Hi-C data of three primary blood cell types (Supplementary Table 5)56 and single-cell eQTL57, including six immune cell types as ground truth for PBMCs.
To assess the TF–RE binding potential, we compared our method with TF–RE correlation (PCC) and motif binding affinity. For example, in naive CD4 T cells, LINGER achieves an AUC of 0.92 and an AUPR ratio of 5.17 for ETS1, which is an improvement over PCC (AUC, 0.78; AUPR ratio, 2.71) and motif binding affinity (AUC, 0.70; AUPR ratio, 1.92) (Fig. 3a,e). For binding sites of MYC in the H1 cell line, LINGER outperforms PCC and motif binding affinity-based predictions (Extended Data Fig. 3a,b). For all 20 TFs in PBMCs, LINGER consistently exhibits the highest AUC and AUPR ratios, and the overall distributions are significantly higher than others in PBMCs (P ≤ 8.72 × 10⁻⁵; Fig. 3b,c and Supplementary Table 6). LINGER also outperforms other methods for H1 data (P ≤ 6.68 × 10⁻⁶; Extended Data Fig. 3c,d). Furthermore, we compared LINGER with a state-of-the-art method, SCENIC+42, which predicts TF–RE pairs from multiome single-cell data. Given that SCENIC+ does not provide a continuous score for all REs, we used the F1 score as a measure of accuracy. Fig. 3d shows that LINGER performs better for all 20 TFs binding site predictions.
Fig. 3: Systematic benchmarking of cell type-specific TF–RE binding potential and cis-regulatory potential performance.
a,e, Receiver operating characteristic curve and precision–recall curve of binding potential for ETS1 in naive CD4 T cells. The ground truth for a and e is the ChIP–seq data of ETS1 in naive CD4+ T cells. The color in a–e represents the different methods used to predict TF–RE regulation. Orange, LINGER; green, PCC between the expression of TF and the chromatin accessibility of RE; blue, motif binding affinity of TF to RE. b,c, Violin plot of the AUC and AUPR ratio values of binding potential across diverse TFs and cell types. The ground truth is the ChIP–seq data for 20 TFs from different cell types in blood. The original data is in Supplementary Table 6. The null hypothesis testing in b, comparing the AUC of LINGER with PCC and binding, results in t-statistics (one-sided paired t-test) with effect size, 8.99; df, 19; P = 1.42 × 10⁻⁸, 95% confidence intervals, [0.17, Inf] and effect size, 18.25; df, 19; P = 8.34 × 10⁻¹⁴; 95% confidence intervals, [0.17, Inf], respectively. The null hypothesis testing in c, comparing the AUPR ratio of LINGER with PCC and binding, results in t-statistics (one-sided paired t-test) with effect size, 4.65; df, 19; P = 8.72 × 10⁻⁵; 95% confidence intervals, [1.31, Inf] and effect size, 5.44, df, 19; P = 1.49 × 10⁻⁵; 95% confidence intervals, [1.51, Inf], respectively. d, The performance metrics F1 score of binding potential. Each point represents ground truth data (n = 20 independent samples). The P values for d, h and k are based on one-sided paired t-tests. f,g, AUC and AUPR ratio of cis-regulatory potential in naive CD4+ cells. The ground truth for f–h is promoter-capture Hi-C data. RE–TG pairs are divided into six distance groups ranging from 0–5 kb to 100–200 kb. PCC is calculated between the expression of TG and the chromatin accessibility of RE. Distance denotes the decay function of the distance to the TSS. Random denotes the uniform distribution from 0 to 1. h, F1 score of cis-regulatory in naive CD4+ cells for LINGER and SCENIC+ (n = 9 independent samples). i,j, AUC and AUPR ratio of cis-regulatory potential. The ground truth is eQTL data from six immune cell types. k, F1 score of cis-regulatory potential in naive B cells. The ground truth is eQTL data from naive B cells (n = 9 independent samples). This figure corresponds to the PBMC data.
To assess the cis-regulatory potential, we compared LINGER with four baseline methods, including distance-based methods, RE–TG correlation (PCC), random predictions, and SCENIC+. We divided RE–TG pairs of Hi-C data into six distance groups ranging from 0–5 kb to 100–200 kb. In naive CD4 T cells, LINGER achieves AUC ranging from 0.66 to 0.70 (Fig. 3f) and AUPR ratio ranging from 1.81 to 2.16 (Fig. 3g) across all distance groups, while other methods are close to random. In other cell types, LINGER exhibits consistent superiority over the baseline methods (Extended Data Fig. 3e–h). All eQTL pairs were considered positive labels owing to the insufficient pairs available for division into distance groups. In all cell types, the AUC and AUPR ratio of LINGER are higher than the baseline methods (Fig. 3i,j). We also compared our method with SCENIC+, which outputs predicted RE–TG pairs without importance scores. We selected the same number of top-ranking RE–TG pairs and calculated the F1 score using nine cutoffs corresponding to quantiles ranging from the 10th to the 90th percentile. As a result, LINGER attains significantly higher F1 scores than SCENIC+ in all cell types (Fig. 3h and Extended Data Fig. 3i,j) based on Hi-C data. Taking eQTL as ground truth, the F1 score of LINGER is significantly higher than SCENIC+ (Fig. 3k) and other cell types (Extended Data Fig. 3k–o).
To evaluate the accuracy of trans-regulatory potential, we chose GENIE3 (ref. 15) and PIDC21 for comparison based on the benchmarking literature of GRN inference from single-cell data39 that we chose in previous work58 (see Methods). In addition, we compared LINGER with PCC and SCENIC+. For STAT1 in classical monocytes, LINGER improves the prediction performance, as evidenced by an AUC of 0.76 versus 0.57–0.59 and an AUPR ratio of 2.60 versus 1.26–1.36 (Fig. 4a,b). A similar improvement is observed for CTCF in H1 (Extended Data Fig. 3p,q). The average AUPR ratio across ground truth datasets for other methods was 1.17–1.29, 0.17–0.29 units above random prediction, whereas LINGER achieves 1.25 units above random prediction, indicating a fourfold to sevenfold relative increase (Fig. 4d). Overall, LINGER consistently performs better than other methods for all 20 TFs in PBMCs, with a significantly higher AUC and AUPR ratio (P ≤ 9.49 × 10⁻⁹; Fig. 4c,d and Supplementary Table 7). LINGER outperforms other competitors in the H1 cell line (P ≤ 3.00 × 10⁻⁸; Extended Data Fig. 3r). Unlike GENIE3 and PIDC, which solely use scRNA-seq data, our method effectively doubles the cell data by integrating both scRNA-seq and scATAC-seq. For a fairer comparison, we removed pre-training and used only half as many cells as input (scNN_half). Comparing to other competitors showed that scNN_half continued to significantly outperform all other methods (Extended Data Fig. 2b). We also evaluated cell type-specific trans-regulatory potential to predict direct differentially expressed genes (DEGs) under perturbation of the TF, using perturbation experiment data as ground truth. We collected eight datasets for PBMCs (Supplementary Table 8) from the KnockTF database59. Extended Data Fig. 4a,b shows that LINGER outperforms all other methods (P ≤ 3.72 × 10⁻⁴).
Fig. 4: Systematic benchmarking of cell type-specific trans-regulatory potential performance.
a,b, Receiver operating characteristic curve and precision–recall curve of trans-regulatory potential inference of STAT1 in classical monocytes. The ground truth data in a–d are putative targets of TFs from ChIP–seq data for the corresponding cell types in PBMCs. c,d, Violin plot of AUC and AUPR ratio values of trans-regulatory potential performance across diverse TFs and cell types. The original data is in Supplementary Table 7. The sample size for the one-sided paired t-test is 20. For c, −log10(P values) are 11.12, 7.72, 11,13 and 10.17 for GENIE3, PCC, PIDC and SCENIC+, respectively. For d, −log10(P values) are 9.59, 8.02, 9.22 and 8.47, respectively. e, Uniform manifold approximation and projection (UMAP) of PBMCs including 14 cell types. NK cells, natural killer cells; MAIT, mucosal-associated invariant T cells; DCs; dendritic cells. f, UMAP of RUNX1 expression across PBMCs. g, UMAP of cell level trans-regulatory potential for RUNX1(TF)–SPI1(TG) across PBMCs. h, UMAP of cell level trans-regulatory potential for RUNX1(TF)–PRKCQ(TG) across PBMCs. i, Violin plot of cell level trans-regulatory potential from different cell types. The sample size for each boxplot is the number of cells of each cell type, ranging from 98 to 1,848. This figure corresponds to the PBMCs.
The rationale for constructing a single-cell-level GRN is the same as a cell type-specific GRN, replacing the cell type-specific term with the single-cell term (Methods). We show the result of trans-regulation, taking RUNX1 as an example. RUNX1 is critical for establishing definitive hematopoiesis60 and expresses at high levels in almost all PBMC cell types (Fig. 4e,f). RUNX1 regulates SPI1 in monocytes (classical, non-classical and intermediate) and myeloid dendritic cells (Fig. 4g,i), while regulates PRKCQ in CD56dim natural killer cells, effector CD8 T cells, mucosal-associated invariant T cells, memory CD4 T cells, naive CD4 T cells and naive CD8 T cells (Fig. 4h,i). This example illustrates the capability of LINGER to visualize gene regulation at the single-cell level.
LINGER reveals the regulatory landscape of GWAS traitsGWASs have identified thousands of disease variants, but the active cells and functions involving variant-regulated genes remain largely unknown61. We integrate GWAS summary statistics and cell type-specific GRN to identify the relevant cell types, key TFs and sub-GRN (Methods). We define a trait regulation score for TFs in each cell type, measuring the enrichment of GWAS genes downstream of TFs. In trait-relevant cell types, TFs with high trait regulation scores should be expressed to perform their function. We identify the trait-relevant cell types by assessing the concordance between TF expression and the trait regulation score.
In our specific study on inflammatory bowel disease (IBD), we collected the risk loci based on a GWAS meta-analysis of about 330,000 individuals from the NHGRI-EBI GWAS catalog62 for study GCST9022555063. Figure 5a shows that in classical monocytes, trait regulation scores for the top-expressed TF are significantly higher than randomly selected TFs (P = 8.9 × 10⁻²⁹, one-sided unpaired t-test), while there is no significant difference for non-relevant cell types such as CD56dim natural killer cells. The most relevant cell types in PBMCs are monocytes and myeloid dendritic cells (Fig. 5b). These findings align with previous studies linking monocytes to the pathogenesis of IBD64,65.
Fig. 5: Elucidating GWAS traits through LINGER-inferred regulatory landscape.
a, Distribution of the number of TGs for top expression TFs and randomly selected TFs in classical monocytes (top) and CD56dim NK cells (bottom). The 100 top-expression TFs and 100 randomly selected TFs are used to generate the distribution. b, Enrichment of IBD GWAS to cell types in PBMCs. The color of the bubbles corresponds to the odds ratio of the number of TGs between top expression and randomly selected TFs. The x axis is the −log10(P value) from the one-sided unpaired t-test for the number of TGs between top expression and randomly selected TFs. c, Key IBD-associated regulators in classical monocytes. The x axis is the z-score of the expression of TFs across all TFs. The y axis is the regulation score of TFs. The TFs in red are the top-ranked TFs according to the summation of the expression level and regulation score. d, Enrichment of GWAS IBD genes among STAT1 targets in classical monocytes. The violin plot is generated by randomly choosing 1,000 TFs; the number of overlapping genes for STAT1 is marked by a star. The different violin plots correspond to taking the top 200–5,000 genes as the TG for each TF, respectively. e, Enrichment of DEGs between inflamed biopsies and non-inflamed biopsies among STAT1 targets in classical monocytes. The details are the same as in d. f, Sub-network of IBD-relevant TFs from classical monocytes trans-regulatory network. The size of the TF or TG nodes corresponds to their degree in the network. The color of TF denotes the trait-relevant score, and the color of TG denotes the −log10(P value) of GWAS SNP assigned to the gene. g, Cis-regulatory network at locus around SLC24A4. The interaction denotes significant RE–TG links, and we use the location of the promoter to represent the gene.
We next identified key TFs by the sum of the expression level and trait regulation score. Figure 5c lists the top eight candidate TFs in classical monocytes. These TFs have been previously reported to be associated with IBD in the literature. FOS can increase the risk of recurrence of IBD66; one variant identified in the IBD cohort is located at the exon of ETV6; IRF1 and ETV6 are key TFs with activity differences in IBD67; genes FOS, FOSB and JUN encode potent mediators of IBD68; CUX1 is induced in IBD69; and STAT1 epigenetically contribute to the pathogenesis of IBD70.
To investigate the downstream targets of key TFs, we chose STAT1 as an example. Among the top 200 TGs regulated by STAT1 in classical monocytes, 67 of them overlap with the GWAS genes, which is statistically significant with a P value of less than 0.01 based on a background distribution from a random selection of TFs (one-sided bootstrap hypothesis testing). The numbers of overlapped TGs are all significant for the top 500, 1,000, 2,000 and 5,000 TGs (Fig. 5d). Apart from GWAS-relevant genes, we collected the DEGs between inflamed biopsies and non-inflamed biopsies71 and we found that these DEGs significantly overlapped with the top-ranked TGs of STAT1 (one-sided bootstrap hypothesis testing; Fig. 5e). The lack of significant overlap between DEGs and GWAS genes (P = 0.15, two-sided Fisher’s exact test) but the significant overlap of both DEGs and GWAS with the top-ranked TGs of STAT1 indicates the robustness and unbiased nature of our method.
Finally, we extracted the sub-network of the eight candidate TFs from the classical monocyte trans-regulatory network for IBD (Fig. 5f). We also observed that the cis-regulatory network of SLC24A4 (Fig. 5g), 46 kb from a risk single nucleotide polymorphism (SNP) rs11626366 (P = 7.4 × 10⁻³), is specifically dense in the IBD-relevant cell types, which shows the complex regulatory landscape of disease genes across different cell types.
Identify driver regulators based on transcription profilesResearchers often identify DEGs between cases and controls using bulk or single-cell expression data, but the underlying regulatory drivers remain elusive. TF activity, focusing on the DNA-binding component of TF proteins, is a more reliable metric than mRNA for identifying driver regulators. One feasible approach is to estimate TF activity based on the expression patterns of downstream TGs, which necessitates the availability of an accurate GRN. Assuming that the GRN structure is consistent for the same cell type across individuals, we employed LINGER-inferred GRNs from single-cell multiome data of a single individual to estimate the TF activity of other individuals using gene expression data alone from the same cell type. By comparing TF activity between cases and controls, we identified driver regulators. This approach is valuable, as it leverages limited single-cell multiome data to estimate TF activity in multiple individuals using only gene expression data (see Methods). We present two illustrative examples showcasing its utility.
Example 1: We collected the bulk gene expression data from 26 patients with acute myeloid leukemia (AML) and 38 healthy donors72. We calculated the TF activity for these samples based on the LINGER-inferred cell population GRN from PBMCs and found that FOXN1 is significantly less active in patients with AML than in healthy donors, and it is not differentially expressed (Fig. 6a,b). In addition, we calculated the TF activity of the transcriptome profile (bulk RNA-seq data) of 671 individuals with AML73 and performed survival analysis, which indicated that individuals with high FOXN1 activity level tend to have a higher survival probability (Fig. 6c). Furthermore, FOXN1 has been reported as a tumor suppressor
留言 (0)