
記住我


Alzheimer’s disease (AD), a chronic neurodegenerative disorder, is the most common cause of irreversible disability and dementia in the elderly, presenting with progressive memory decline and cognitive impairment (Hodson, 2018; Zhang et al., 2023). The prevalence of dementia is estimated to double every 20 years, and the global number could increase to 131.5 million by 2050, causing a huge economic burden and affecting the quality of life (Tolosa et al., 2021). Parkinson’s disease (PD) is the second most common neurodegenerative disease after AD, which is characterized by resting tremor, rigidity, bradykinesia, postural instability, and freezing of gait, affecting nearly 1.7% of the population older than age 65 years (Samii et al., 2004; de Lau and Breteler, 2006). Mechanistically, the pathology of AD is characterized by abnormal amyloid-β (Aβ) deposition, hyperphosphorylated Tau formation of neurofibrillary tangles, and neuroinflammation (Scheff et al., 2006; Nelson et al., 2012; Hamilton et al., 2022). The hallmarks of PD are degeneration of dopaminergic neurons in the substantia nigra pars compact and aggregation of the misfolded α-synuclein in the intracellular inclusions known as Lewy bodies (Braak et al., 2003; Surmeier et al., 2017). Mild cognitive impairment (MCI) is a transitional state between normal aging and dementia. Studies have shown that MCI at a high conversion rate was prone to develop into dementia, providing a novel strategy for the prevention, prognosis and treatment of AD and PD (Gauthier et al., 2006; Hansson et al., 2006; Petersen, 2018). It is widely believed that environmental exposures and genetic factors influenced the susceptibility to environmental factors, including smoking, alcohol, obesity, diabetes, drug abuse, poor diet, and physical inactivity. Therefor, gene-environment interactions may be implicated in the pathogenesis of neurodegenerative diseases (Panza et al., 2008; Durazzo et al., 2014; Polidori, 2014; Silva et al., 2019; Periñán et al., 2022).
Accumulative evidence has demonstrated that serum vitamin D deficiency is inversely associated with the risk of several neurodegenerative diseases, such as MCI, AD, and PD (Suzuki et al., 2012; Wang et al., 2012, 2015; Koduah et al., 2017). It has been reported that vitamin D supplements could effectively prevent deterioration of diseases and improve cognitive function (Peterson et al., 2013; Suzuki et al., 2013). Vitamin D belongs to a group of lipid soluble steroid hormone (Norman, 1998). It is primarily synthesized by the skin via exposure to sunlight, and a small portion is absorbed from dietary sources. The 25-hydroxy vitamin D3 stored in the kidneys is metabolized by 1-α-hydroxylase and converts into biologically active 1,25-dihydroxyvitamin D3. The active metabolite regulates transcription of targeted vitamin D-responsive genes by interacting with nuclear vitamin D receptor (VDR), and then exerts its biological function, including cell cycle activity, calcium homeostasis, stress response, immunoregulation, neuronal development, cellular differentiation, and growth (Haussler et al., 1998; Bouillon et al., 2008; Cesari et al., 2011). Being highly expressed in the hypothalamus and substantia nigra, VDR is a member of nuclear steroid hormone receptor superfamily (Eyles et al., 2005, 2013; Kesby et al., 2011), and VDR knockout mice had muscular and motor impairments (Burne et al., 2005). As a consequence, VDR gene polymorphisms may influence the VDR expression, structure, and function.
The VDR gene is located on chromosome 12 (12q13.11), consisting of two promoter regions, eight exons and seven introns that span more than 100 kb in length (Albert et al., 2009; Bollen et al., 2022). Up to now, genome-wide association studies (GWAs) have identified several hazard VDR gene single nucleotide polymorphisms (SNPs) (Beecham et al., 2009). Among these VDR SNPs, the FokI (rs2228570) at exon 2 on the 5′ coding region is a functional polymorphism where the alteration of T to C produces a shorter protein with higher transcription capacity, and has no linkage with any of other VDR gene polymorphisms (Gross et al., 1998). The BsmI (rs1544410), ApaI (rs7975232), and TaqI (rs731236) are situated near the 3′ untranslated region (UTR) of VDR gene (Morrison et al., 1994). These SNPs could impact on the stability and translation efficiency of VDR mRNA, but not structurally change its amino acid sequence (Uitterlinden et al., 2004). Moreover, they have strong linkage disequilibrium with variants in the 3′UTR, which favors the modulation of VDR gene expression (Ingles et al., 1997; Zmuda et al., 2000).
Numerous studies have investigated the associations of VDR gene SNPs wit AD, MCI, and PD risk, but the results remain inconsistent and controversial. Lee et al. (2014) proved that VDR BsmI polymorphism was correlated with PD risk among Asians, as well as the FokI. Another study found that the BsmI significantly increased the risk of MCI, and the TaqI was positively correlated with the AD risk, while the ApaI reduced the susceptibility to MCI (Liu et al., 2021). Han et al. (2012) reported that the FokI CC + CT genotype was remarkably associated with sporadic PD risk in the Chinese population. Recent study have shown that the FokI SNP, but not BsmI, ApaI, or TaqI, was significantly correlative with PD susceptibility (Török et al., 2013; Zhang et al., 2014). Inversely, Gezen-Ak et al. (2012) demonstrated that the Aa genotype significantly elevated the risk of developing AD 2.3 times compared with the ApaI AA genotype. The TaqI G-allele has been reported to be correlative with greater cognitive decline (Kuningas et al., 2009). Due to the small sample size and limited number of gene loci included in the study, we performed this meta-analysis to accurately evaluate the correlation between VDR SNPs (FokI, BsmI, ApaI, and TaqI) and susceptibility to AD, MCI, and PD.
2 Materials and methods 2.1 Literature search strategyThis meta-analysis was performed according to the Preferred Reporting Items for Systematic Reviews and Meta-Analyses (PRISMA) guidelines (Moher et al., 2009). Eligible studies were extracted from the PubMed, EMBASE, Web of Science, and Cochrane Library databases up to date to 22 September 2023. Our search strategy included the following terms (Alzheimer’s disease or AD or Parkinson’s disease or PD or mild cognitive impairment or MCI) and (vitamin D receptor or VDR) and (polymorphism or SNP or genotype or mutation or variant). At the same time, the selected potential articles were manually screened out in the cited references.
2.2 Selection and exclusion criteriaInclusion criteria are as follows: (1) case-control studies investigated the association between VDR polymorphisms and susceptibility to AD, PD, and MCI; (2) the patients were diagnosed clinically by the neurologist in accordance of DSMIV criteria, the United Kingdom Parkinson’s Disease Brain Bank criteria and the Hoehn and Yahr Scale; and (3) the sufficient information on genotypic distribution of VDR gene. The exclusion criteria were as follows: (1) non-case-control study; (2) animal studies; (3) review, abstract, case reports, meta-analysis, comments, and editorials; (4) lack of detailed genotyping data; and (5) other gene type and additional VDR genotype.
2.3 Data extractionTwo experienced authors (YD and PG) independently conducted literature screening, data extraction, literature quality evaluation, and any disagreements could be resolved through discussion or a third analyst (XS). The detailed information extracted from all the selected studies included: first author’s surname, publication year, country, type of disease, ethnicity, source of controls, genotyping methods, sample size, and P-value of HWE.
The Newcastle-Ottawa Scale (NOS) was used to evaluate the process in terms of queue selection, comparability of queues, and evaluation of results (Stang, 2010). A study with a score of at least six was considered as a high-quality literature. Higher NOS scores showed higher literature quality.
2.4 Statistical analysisAll data analysis was conducted using Stata16.0 software (Stata Corp LP, TX, USA). Odds ratio (OR) and 95% confidence intervals (CIs) were used to assess the correlations of VDR gene polymorphisms with AD, PD, and MCI risk. After that, the heterogeneity test was carried out. The P ≥ 0.05 or I2 < 50% suggested no distinct heterogeneity, and the fixed-effect pattern was applied to integrate the results. Otherwise, the random-effect model was used. Results were considered significant statistically when the P-value less than 0.05. Subsequently, we carried out the subgroup analysis in order to determine the source of heterogeneity. In addition, sensitivity analysis was performed by removing one study sequentially to evaluate the influence of each individual study on overall results under all genetic models. Among these studies, the publication bias was verified by using the Begg’s rank correlation test and Egger’s linear regression test. If P < 0.05 indicates obvious publication bias.
2.5 False-positive report probability analysisThe probability of meaningful associations between VDR SNPs and the risk of AD, PD, and MCI can be determined by conducting the false-positive report probability (FPRP) analysis (Wacholder et al., 2004). In order to explore the relationships observed in the meta-analysis, we adopted prior probabilities of 0.25, 0.1, 0.01, 0.001, and 0.0001 and computed the FPRP values as described previously. The relevance that reached the FPRP threshold of <0.2 was considered significant.
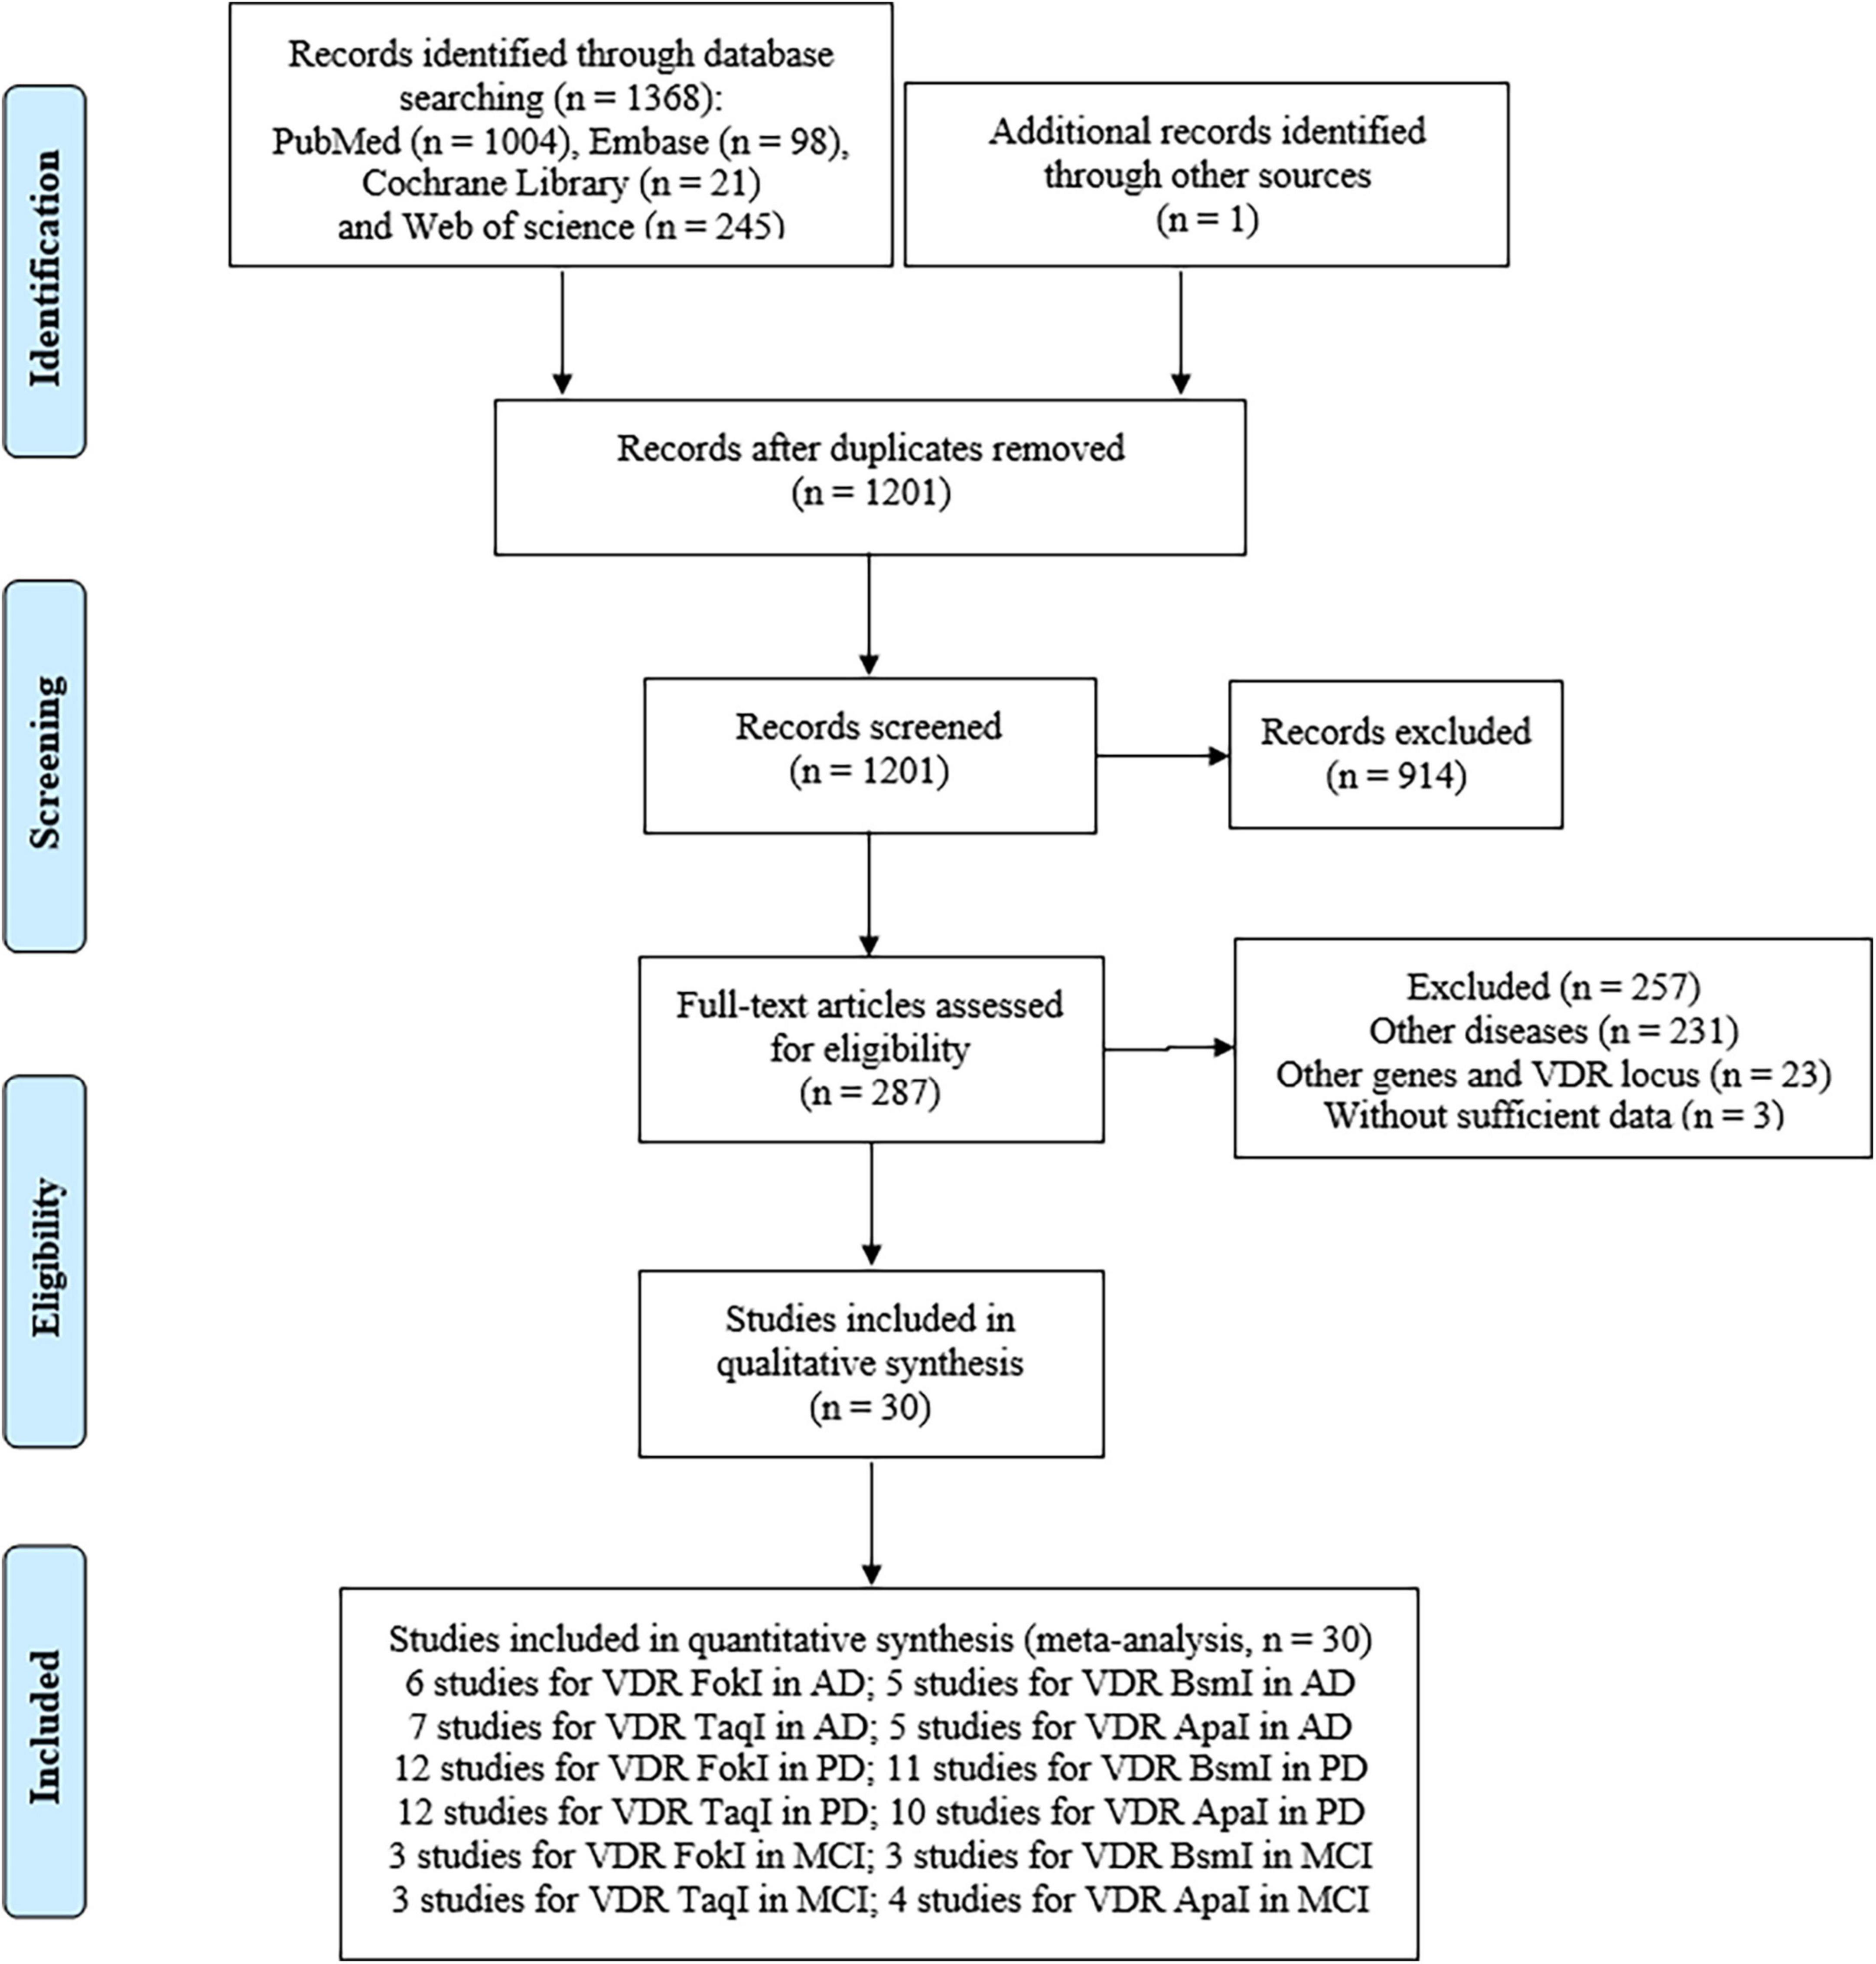
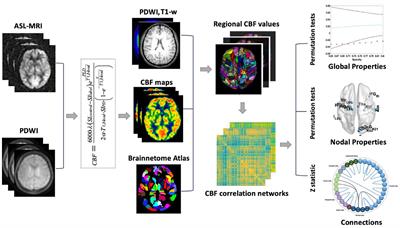
3 Results 3.1 Literature search and screeningThe flow diagram (Figure 1) showed detailed literature search steps. The systematic search yielded 1,369 potential articles retrieved from the initial databases of PubMed (n = 1004), Embase (n = 98), Web of Science (n = 245), Cochrane Library (n = 21), and one additional record was retrieved through other sources (Mohammadzadeh and Pazhouhesh, 2016). After exclusion of 168 duplicate references, 1,201 articles were considered for the meta-analysis. Of the remaining 1,201 articles, we removed 914 articles after screening the title and abstract. Among these, 511 articles were reviews, comments, letters, meta-analysis, case report, editorials, cross-sectional studies, conference abstracts, and conference papers, while 403 articles were implicated in animal or in vitro studies. At this stage, 287 research literatures were reviewed again. After carefully reviewing the full texts, we performed a secondary screening and eliminated 257 articles due to other disease (n = 231), insufficient information (n = 3), other genes and VDR gene polymorphisms (n = 23). A total of 30 studies covering 81 studies were retained for this meta-analysis (Luedecking-Zimmer et al., 2003; Kim et al., 2005; Gezen-Ak et al., 2007, 2012, 2017; Lehmann et al., 2011; Han et al., 2012; Khorram Khorshid et al., 2013; Liu et al., 2013; Lv et al., 2013; Török et al., 2013; Petersen et al., 2014; Gatto et al., 2015; Łaczmański et al., 2015; Zhou et al., 2015; Kang et al., 2016; Mohammadzadeh and Pazhouhesh, 2016; Mun et al., 2016; Meamar et al., 2017; Tanaka et al., 2017; Oliveira et al., 2018; Hu et al., 2020; Agliardi et al., 2021; Arévalo et al., 2021; Agúndez et al., 2022; Dimitrakis et al., 2022a,b; Kamyshna et al., 2022; Redenšek et al., 2022; Zhang et al., 2022).
Figure 1. Flow diagram of the eligible study selection process.
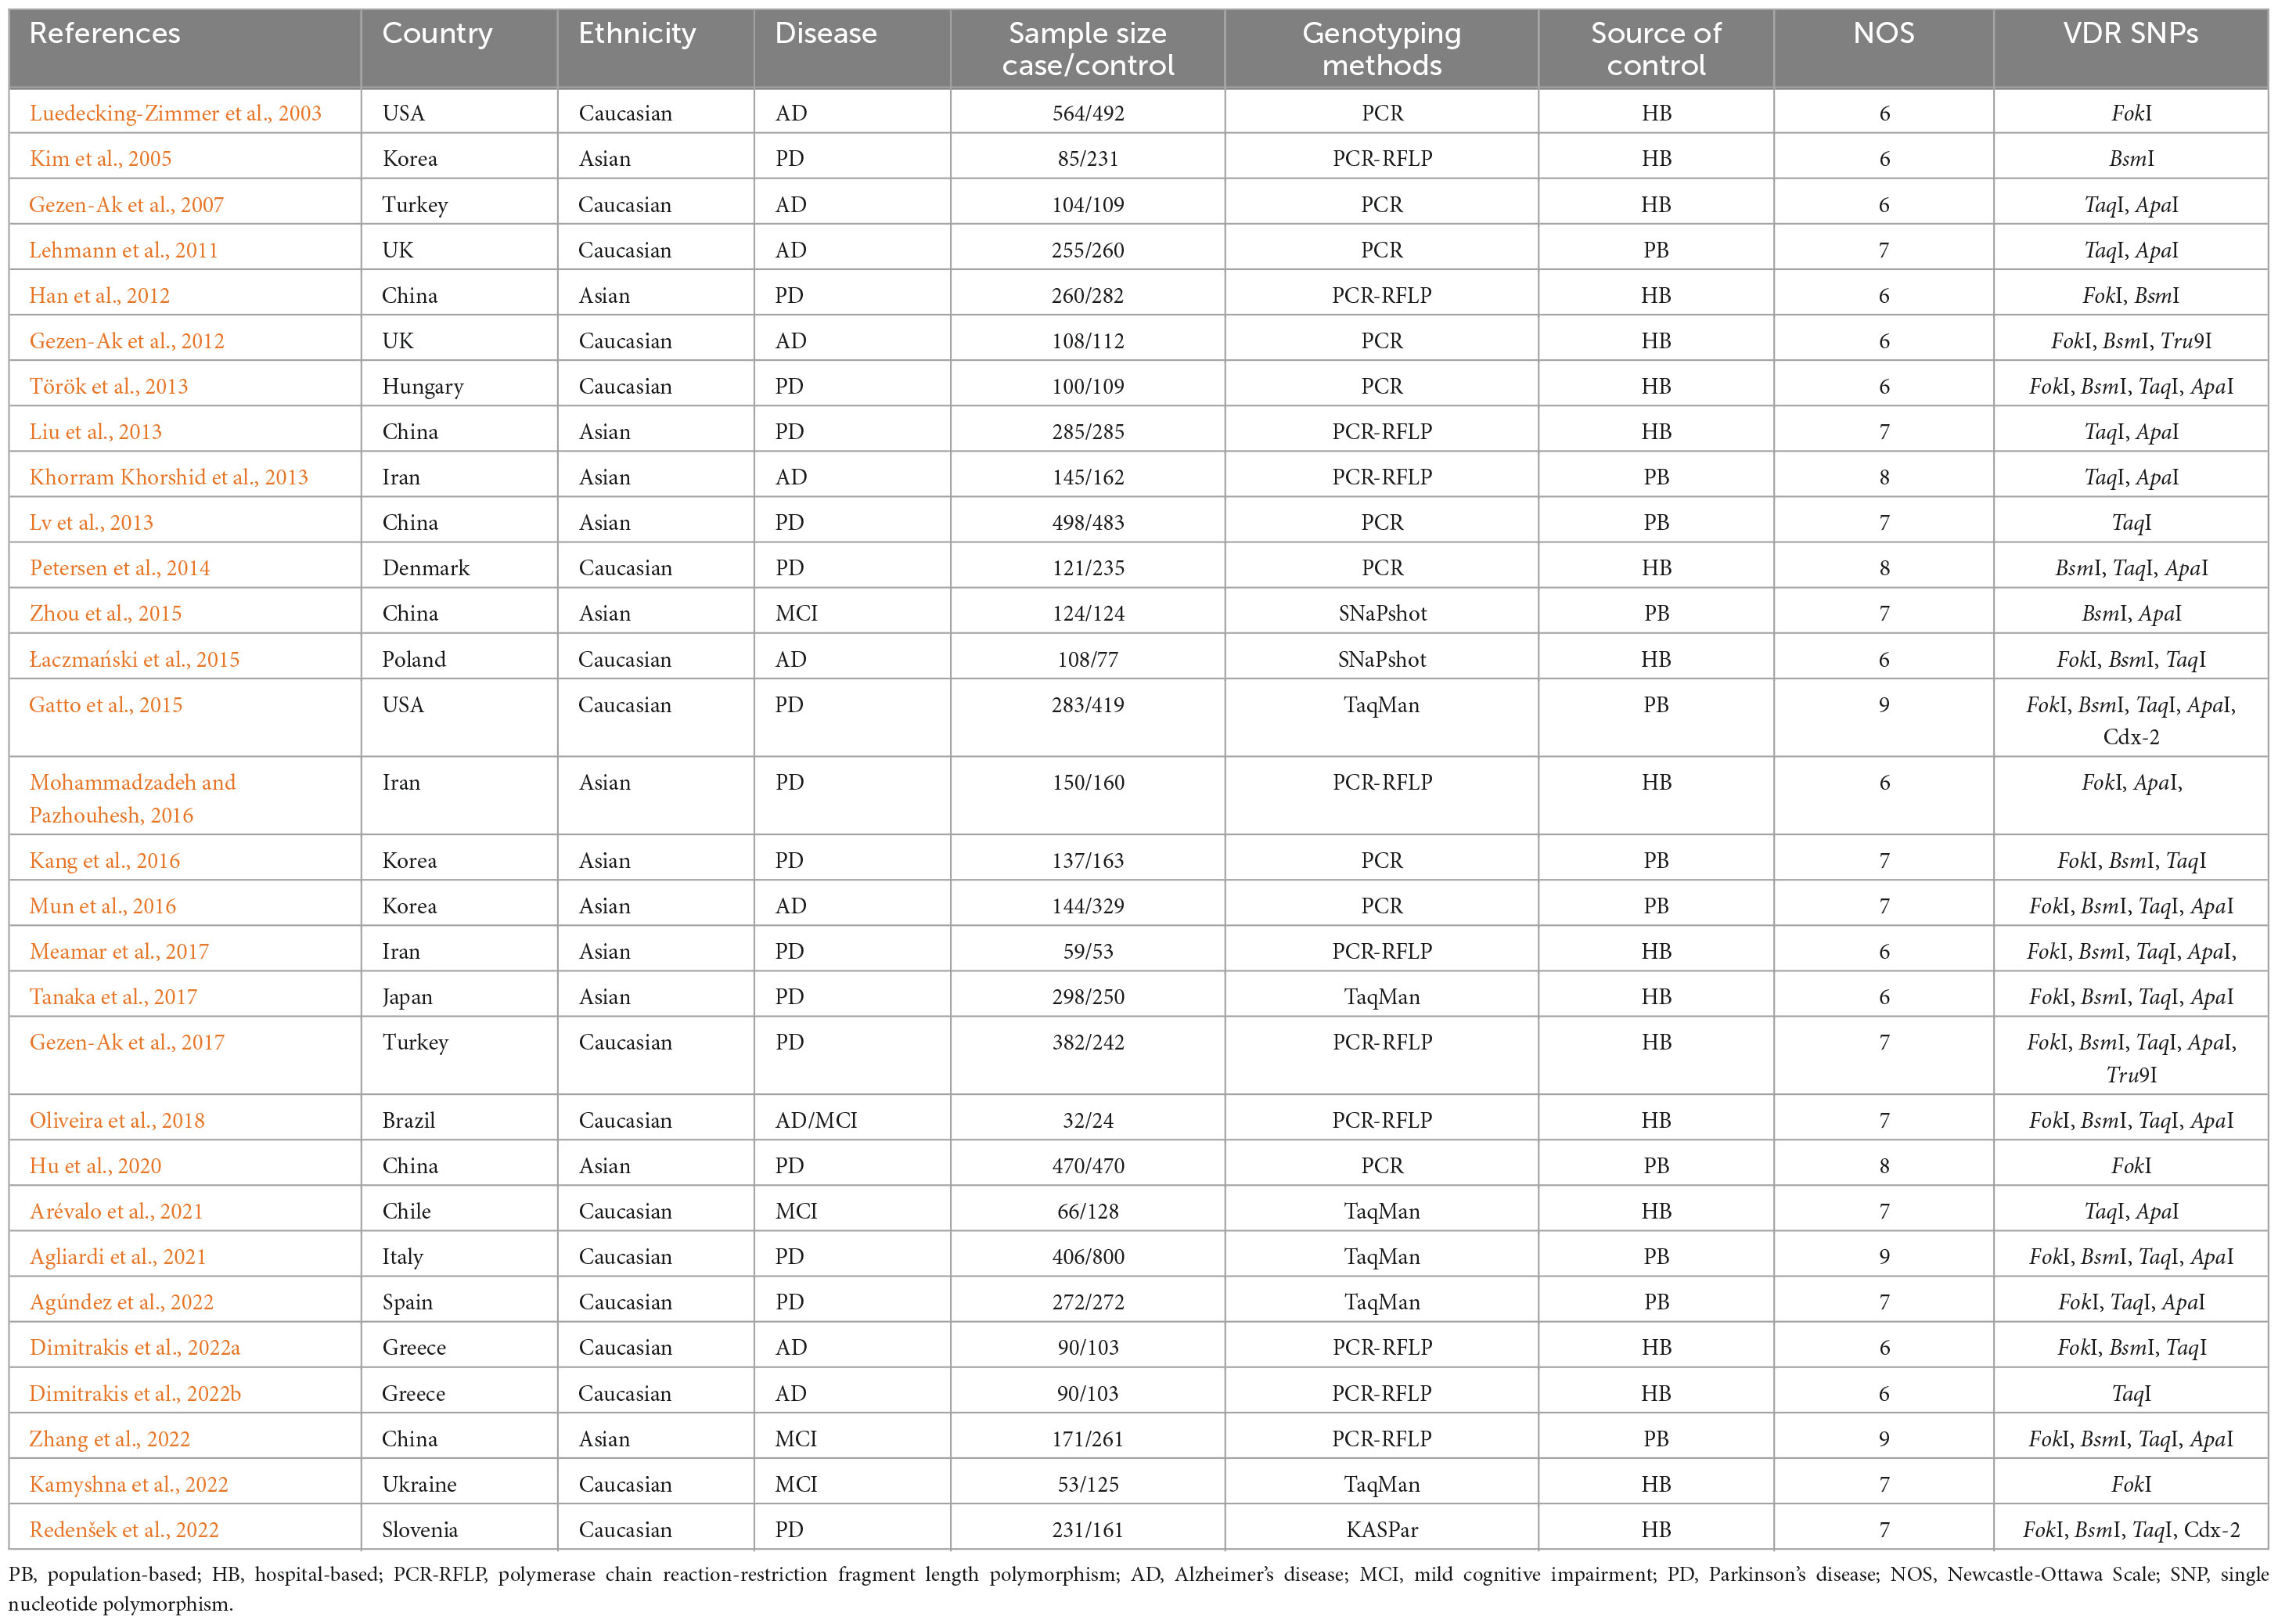
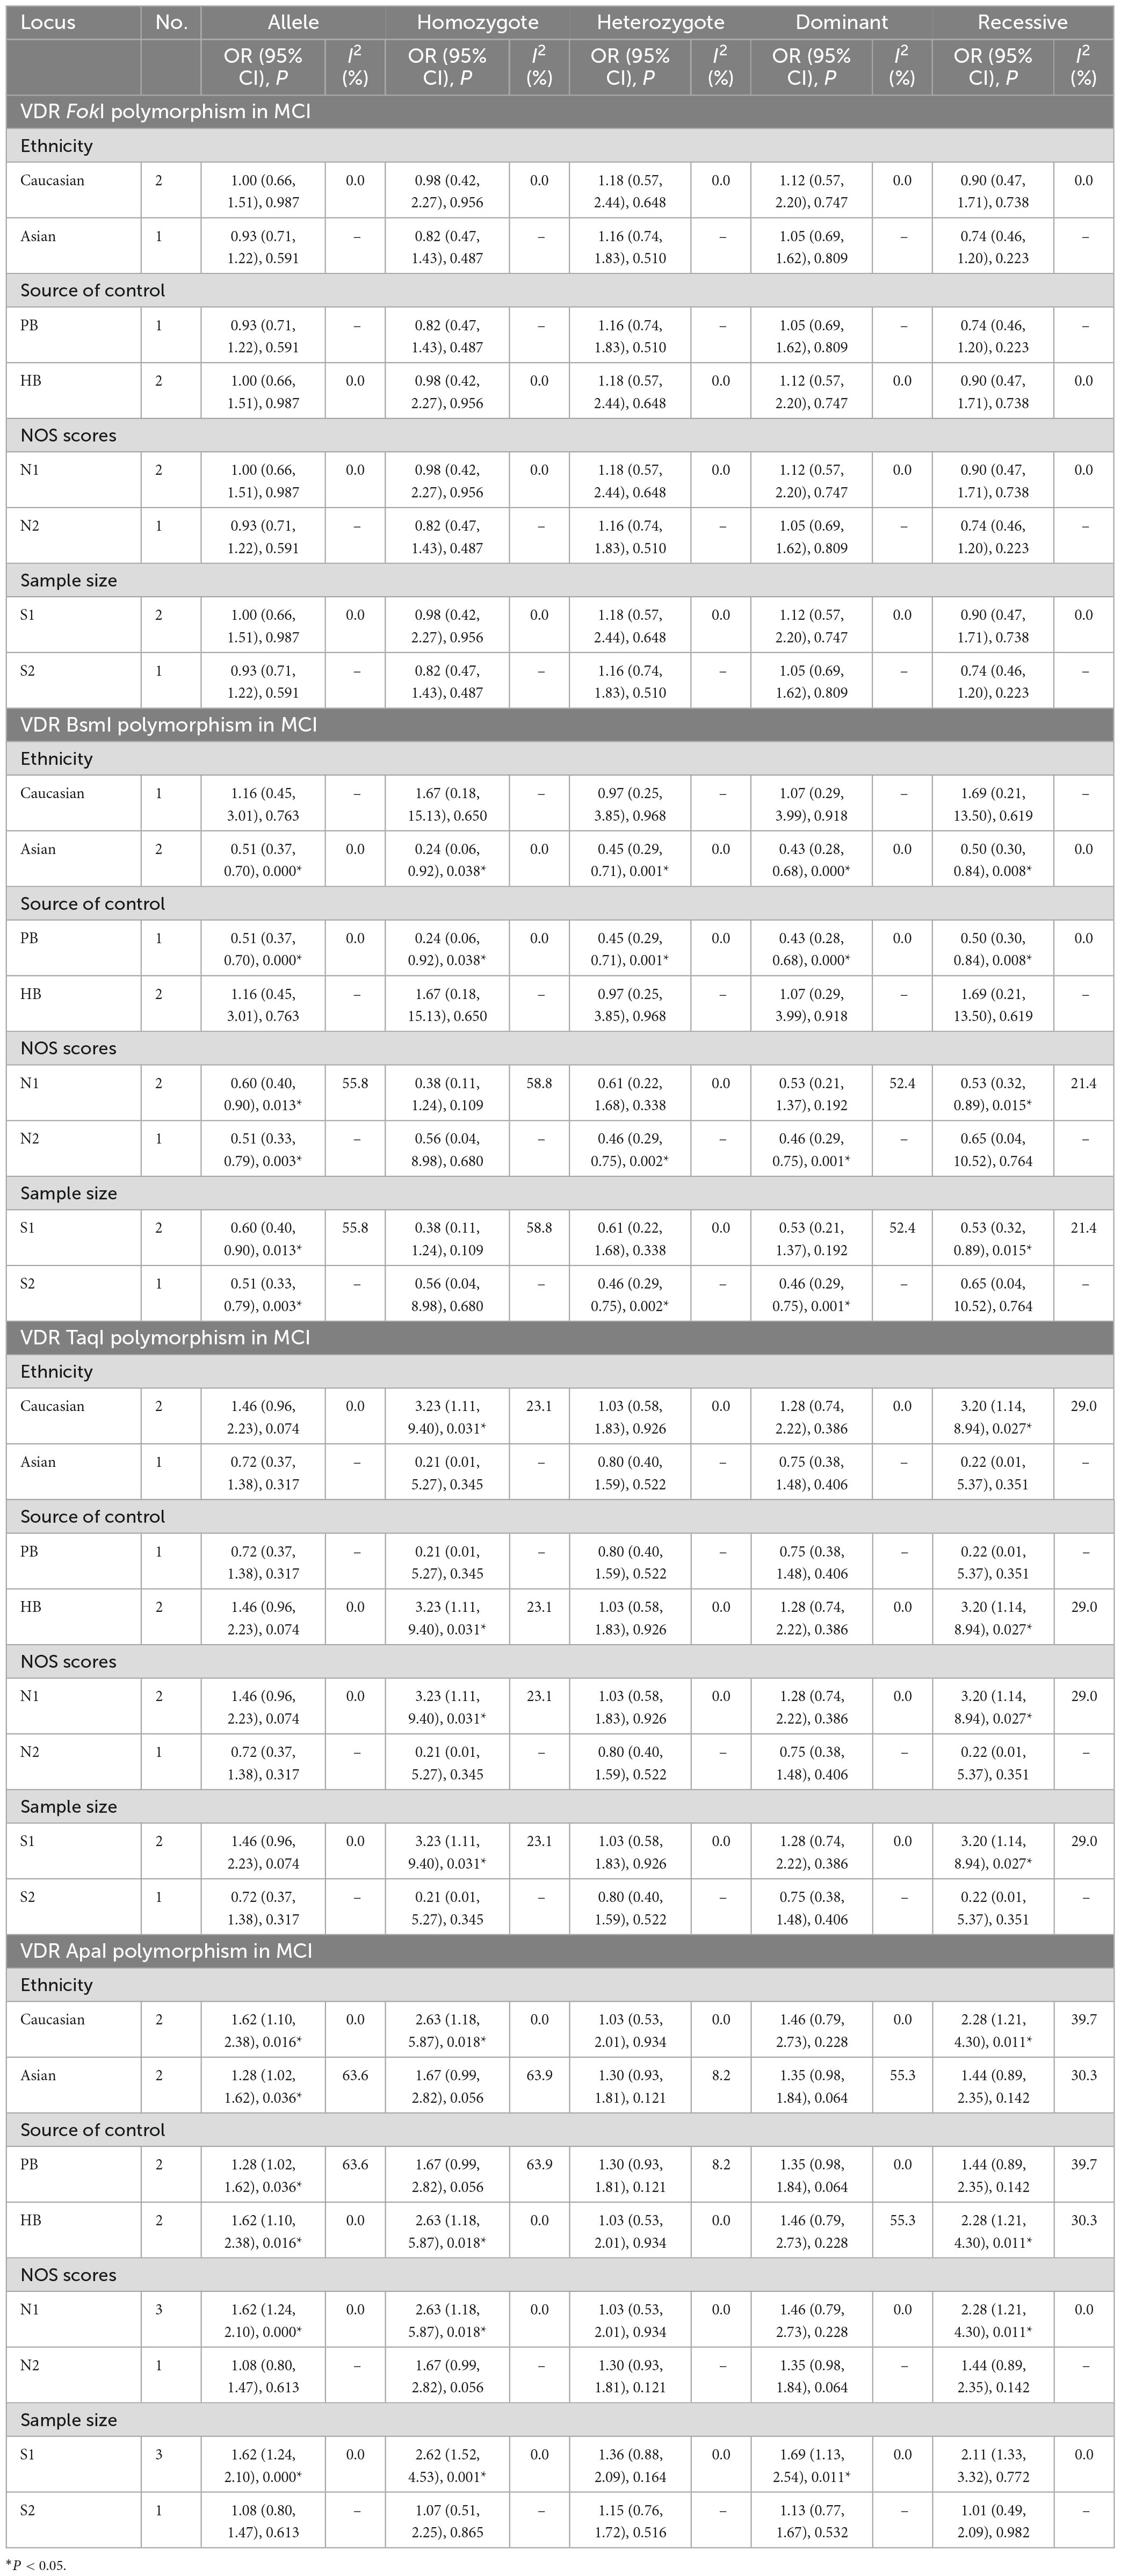
3.2 Characteristics of included studiesThe main characteristics of all included studies are summarized in Table 1. Seventeen studies were conducted in the Caucasian population, and 13 studies in the Asian population. The control group of 11 studies were population-based (PB), and 19 studies were hospital-based (HB). And then, these studies were assessed by NOS and met the high-quality standards (Supplementary Table 1). Additionally, PCR method was used to measure in 10 studies, PCR-RFLP method in 11 studies, TaqMan method in 6 studies, Snapshot method in 2 studies, and other methods in 2 studies, respectively. As for AD risk, 6 studies of VDR FokI polymorphism, 5 studies of BsmI polymorphism, 7 studies of TaqI polymorphism, and 5 studies of ApaI polymorphism were analyzed. For the risk of PD, 12 studies on VDR FokI polymorphism, 11 studies on VDR BsmI polymorphism, 12 studies on TaqI polymorphism, and 10 studies on VDR ApaI polymorphism were enrolled to investigate the association. With regard to the risk of MCI, three studies focused on the FokI SNP, three studies on the BsmI SNP, three studies on the TaqI SNP, and four studies on the ApaI SNP in this meta-analysis (Table 2).
Table 1. Summary characteristics of the included studies in our meta-analysis.
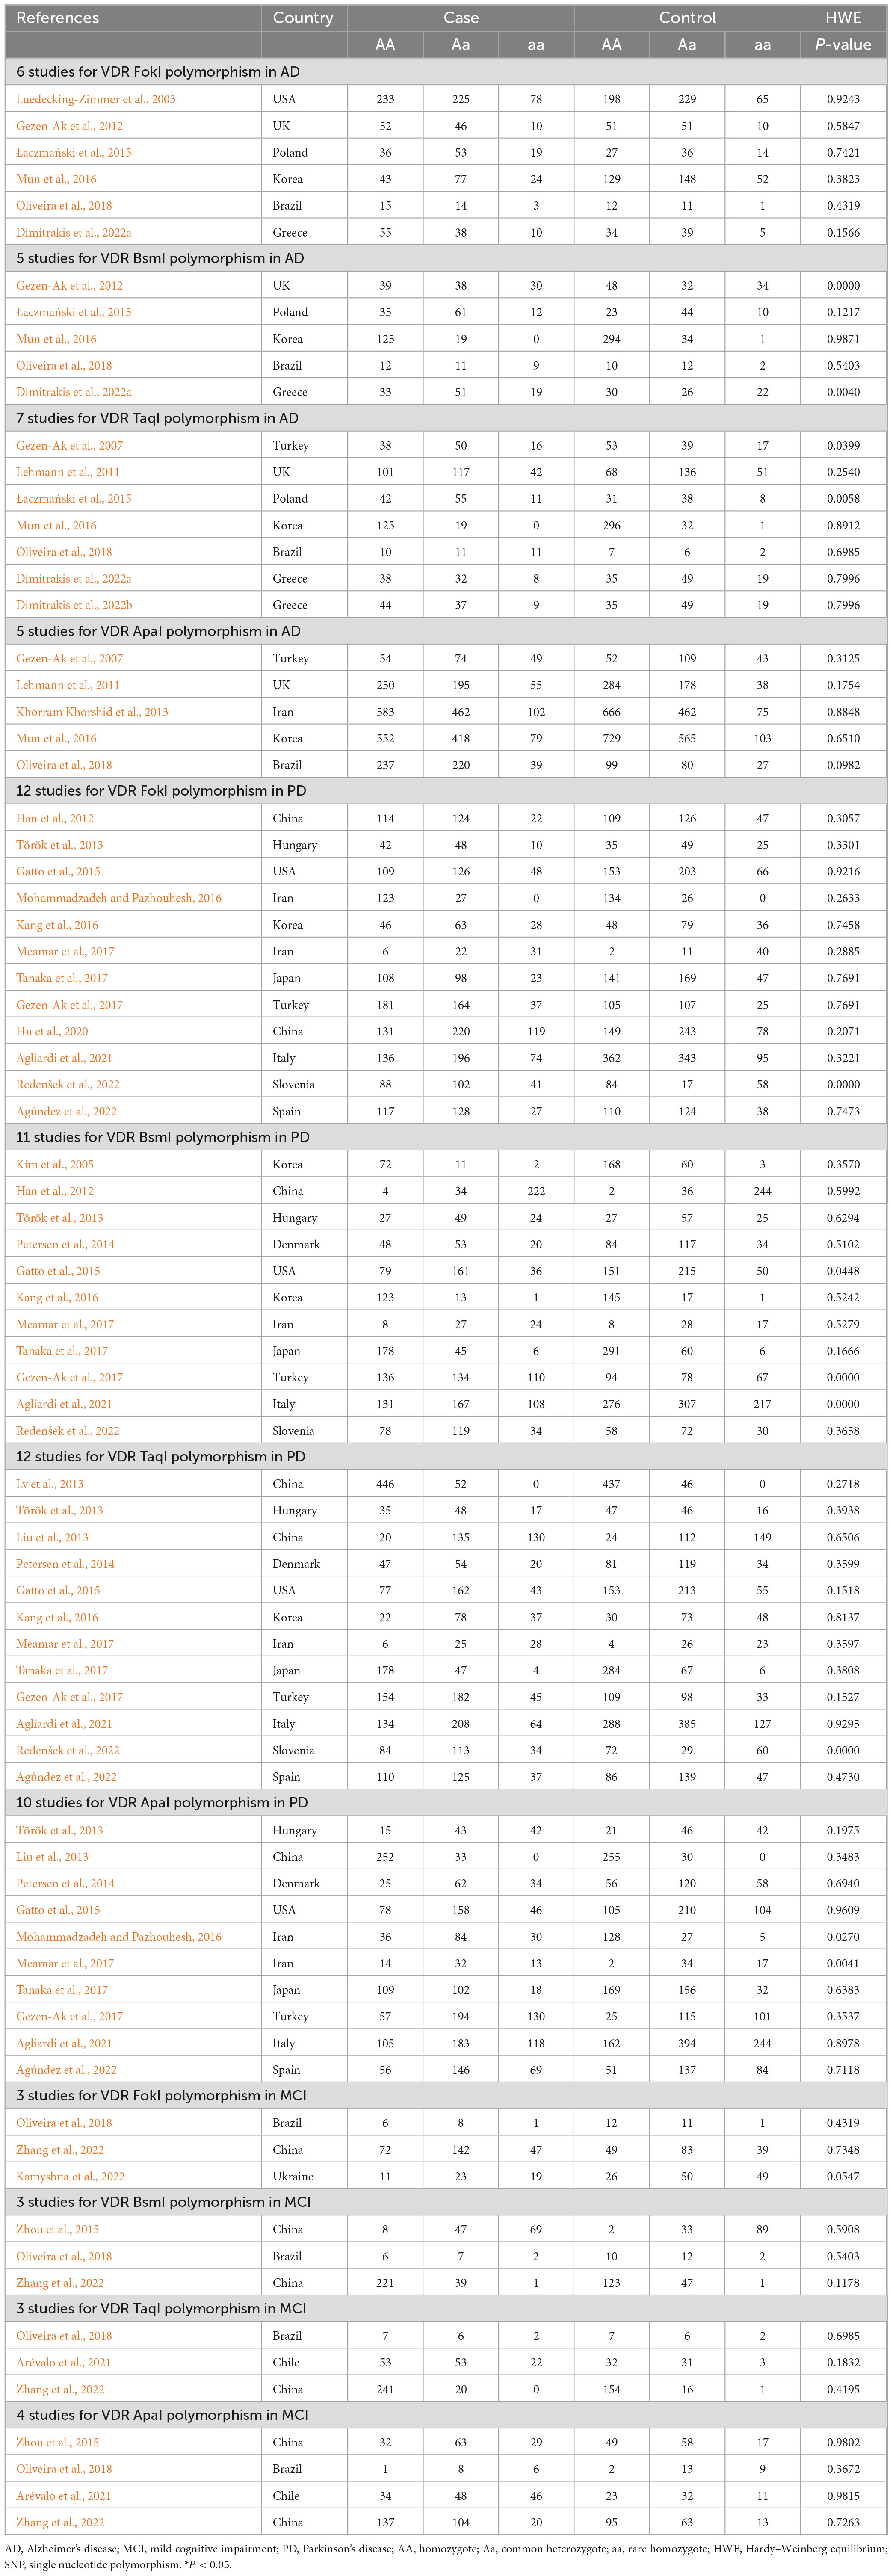
Table 2. Genotype frequencies of vitamin D receptor SNPs in AD, MCI, and PD patients and matched controls.
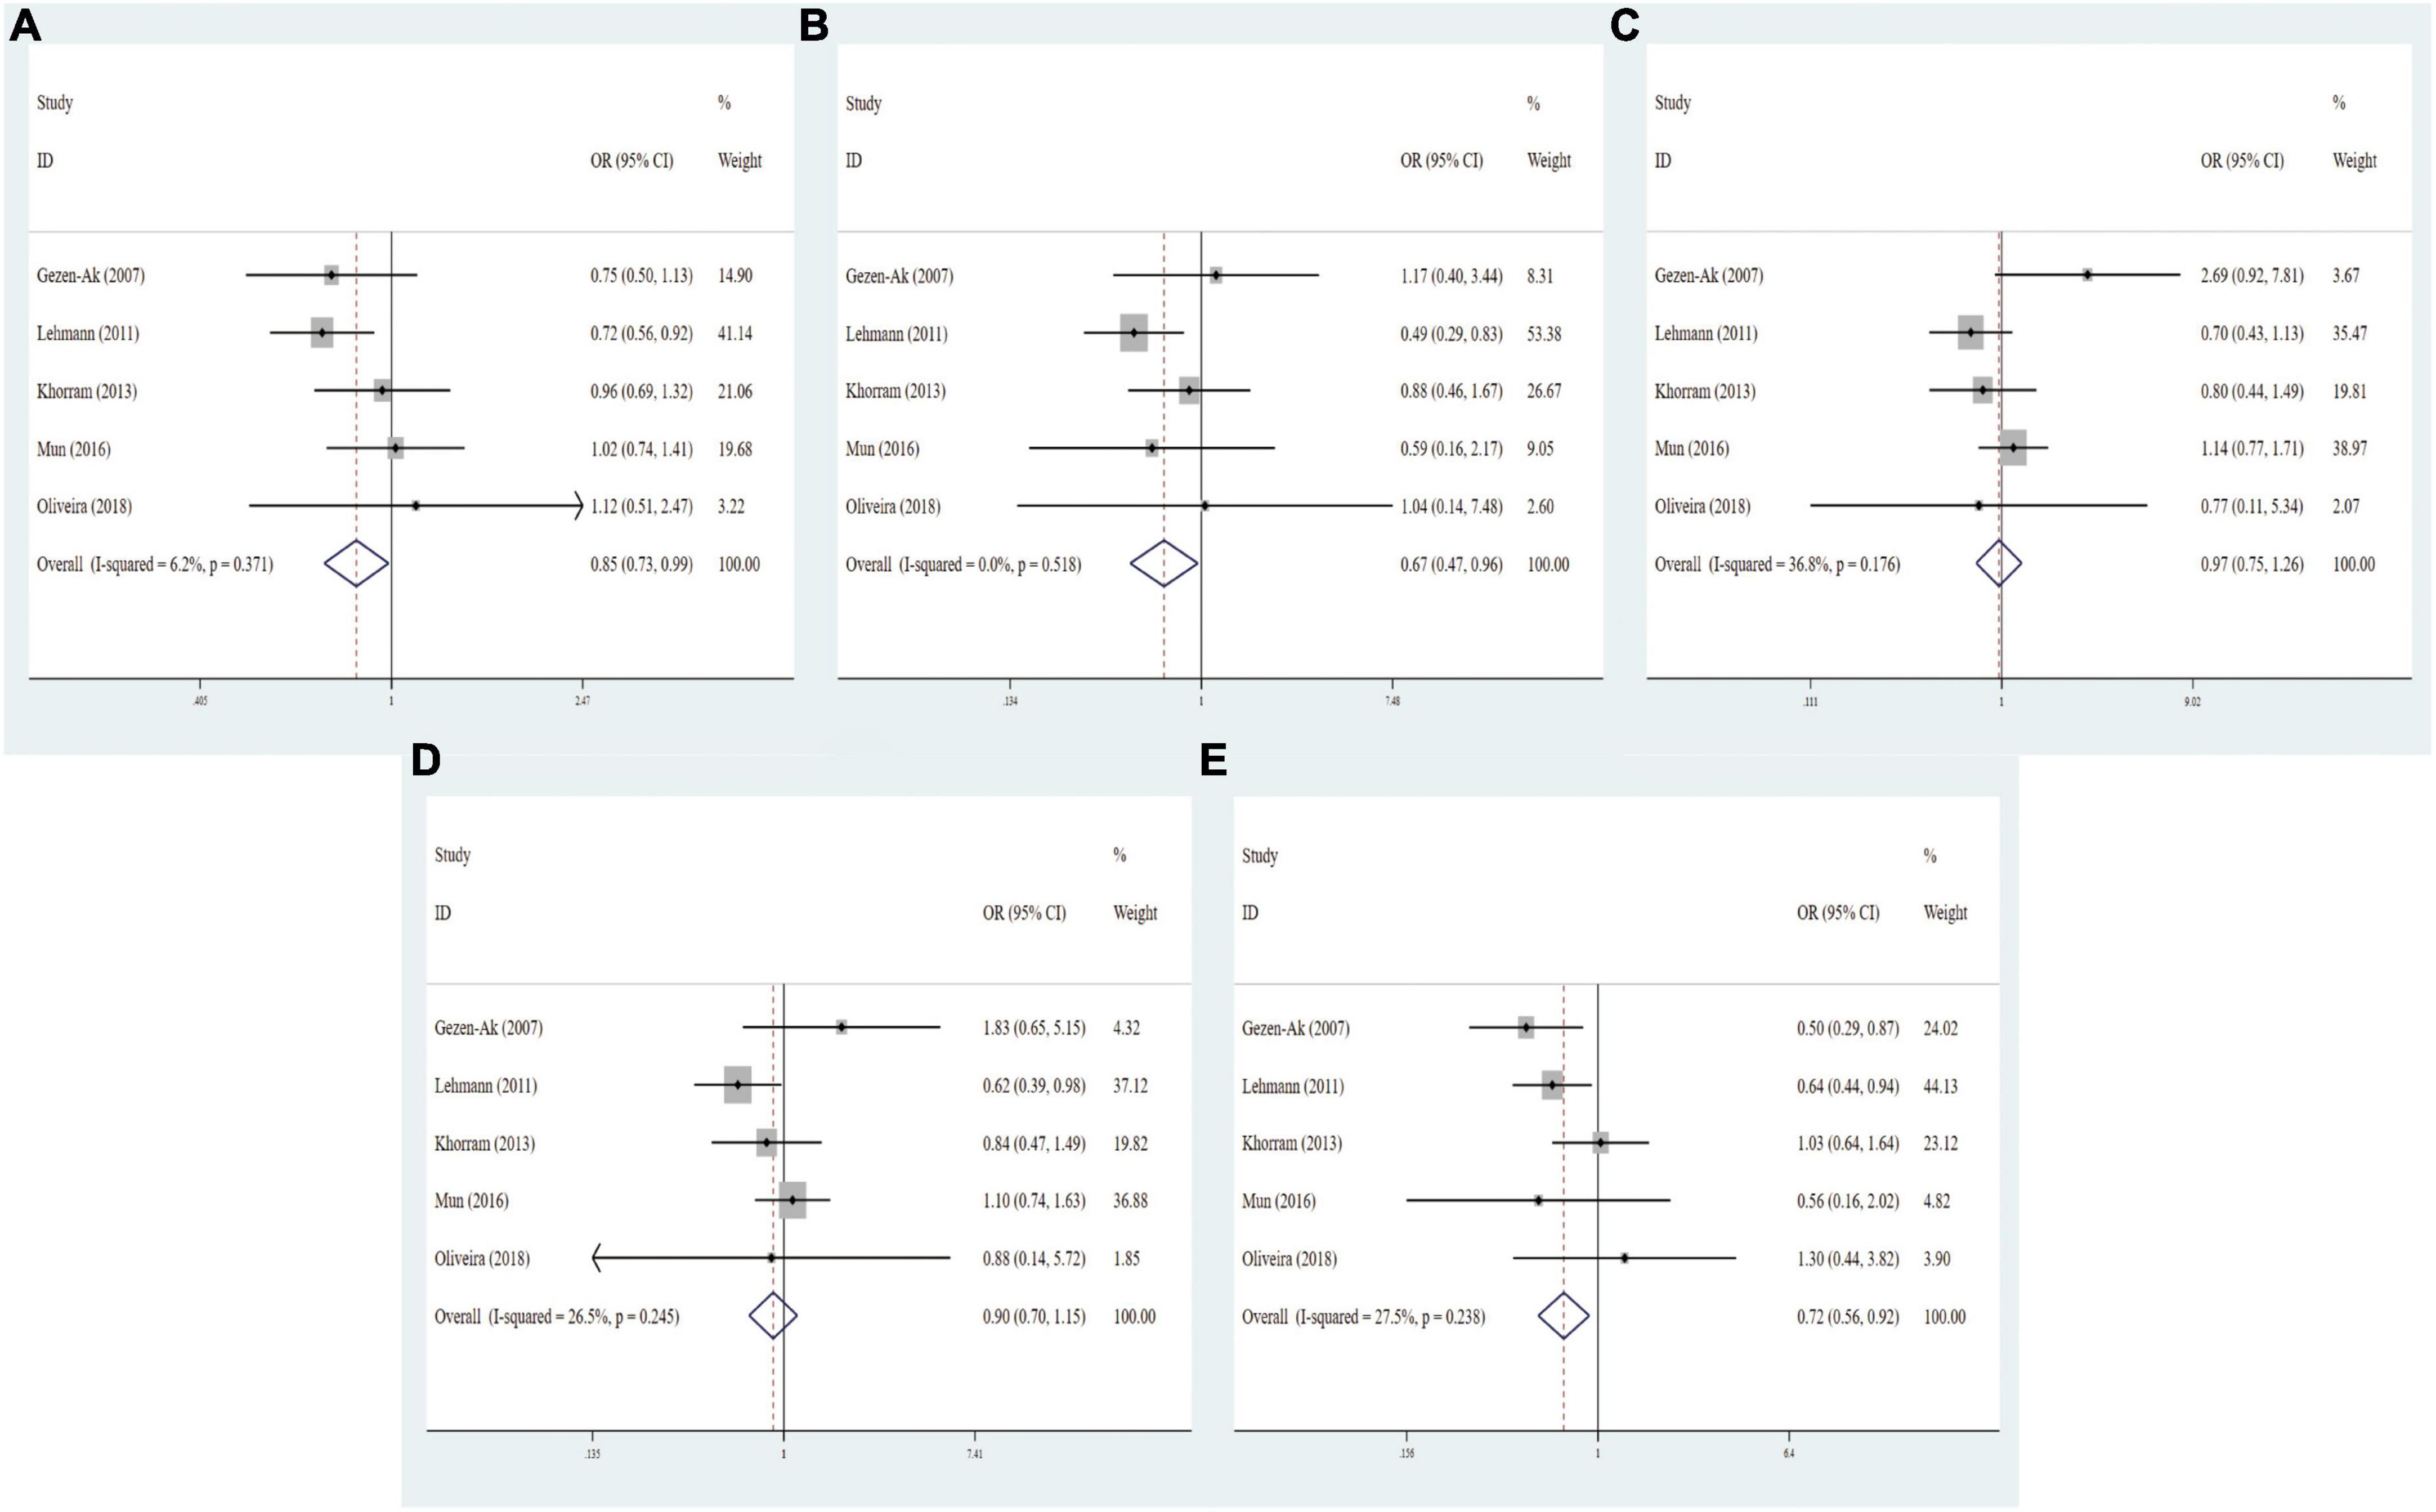
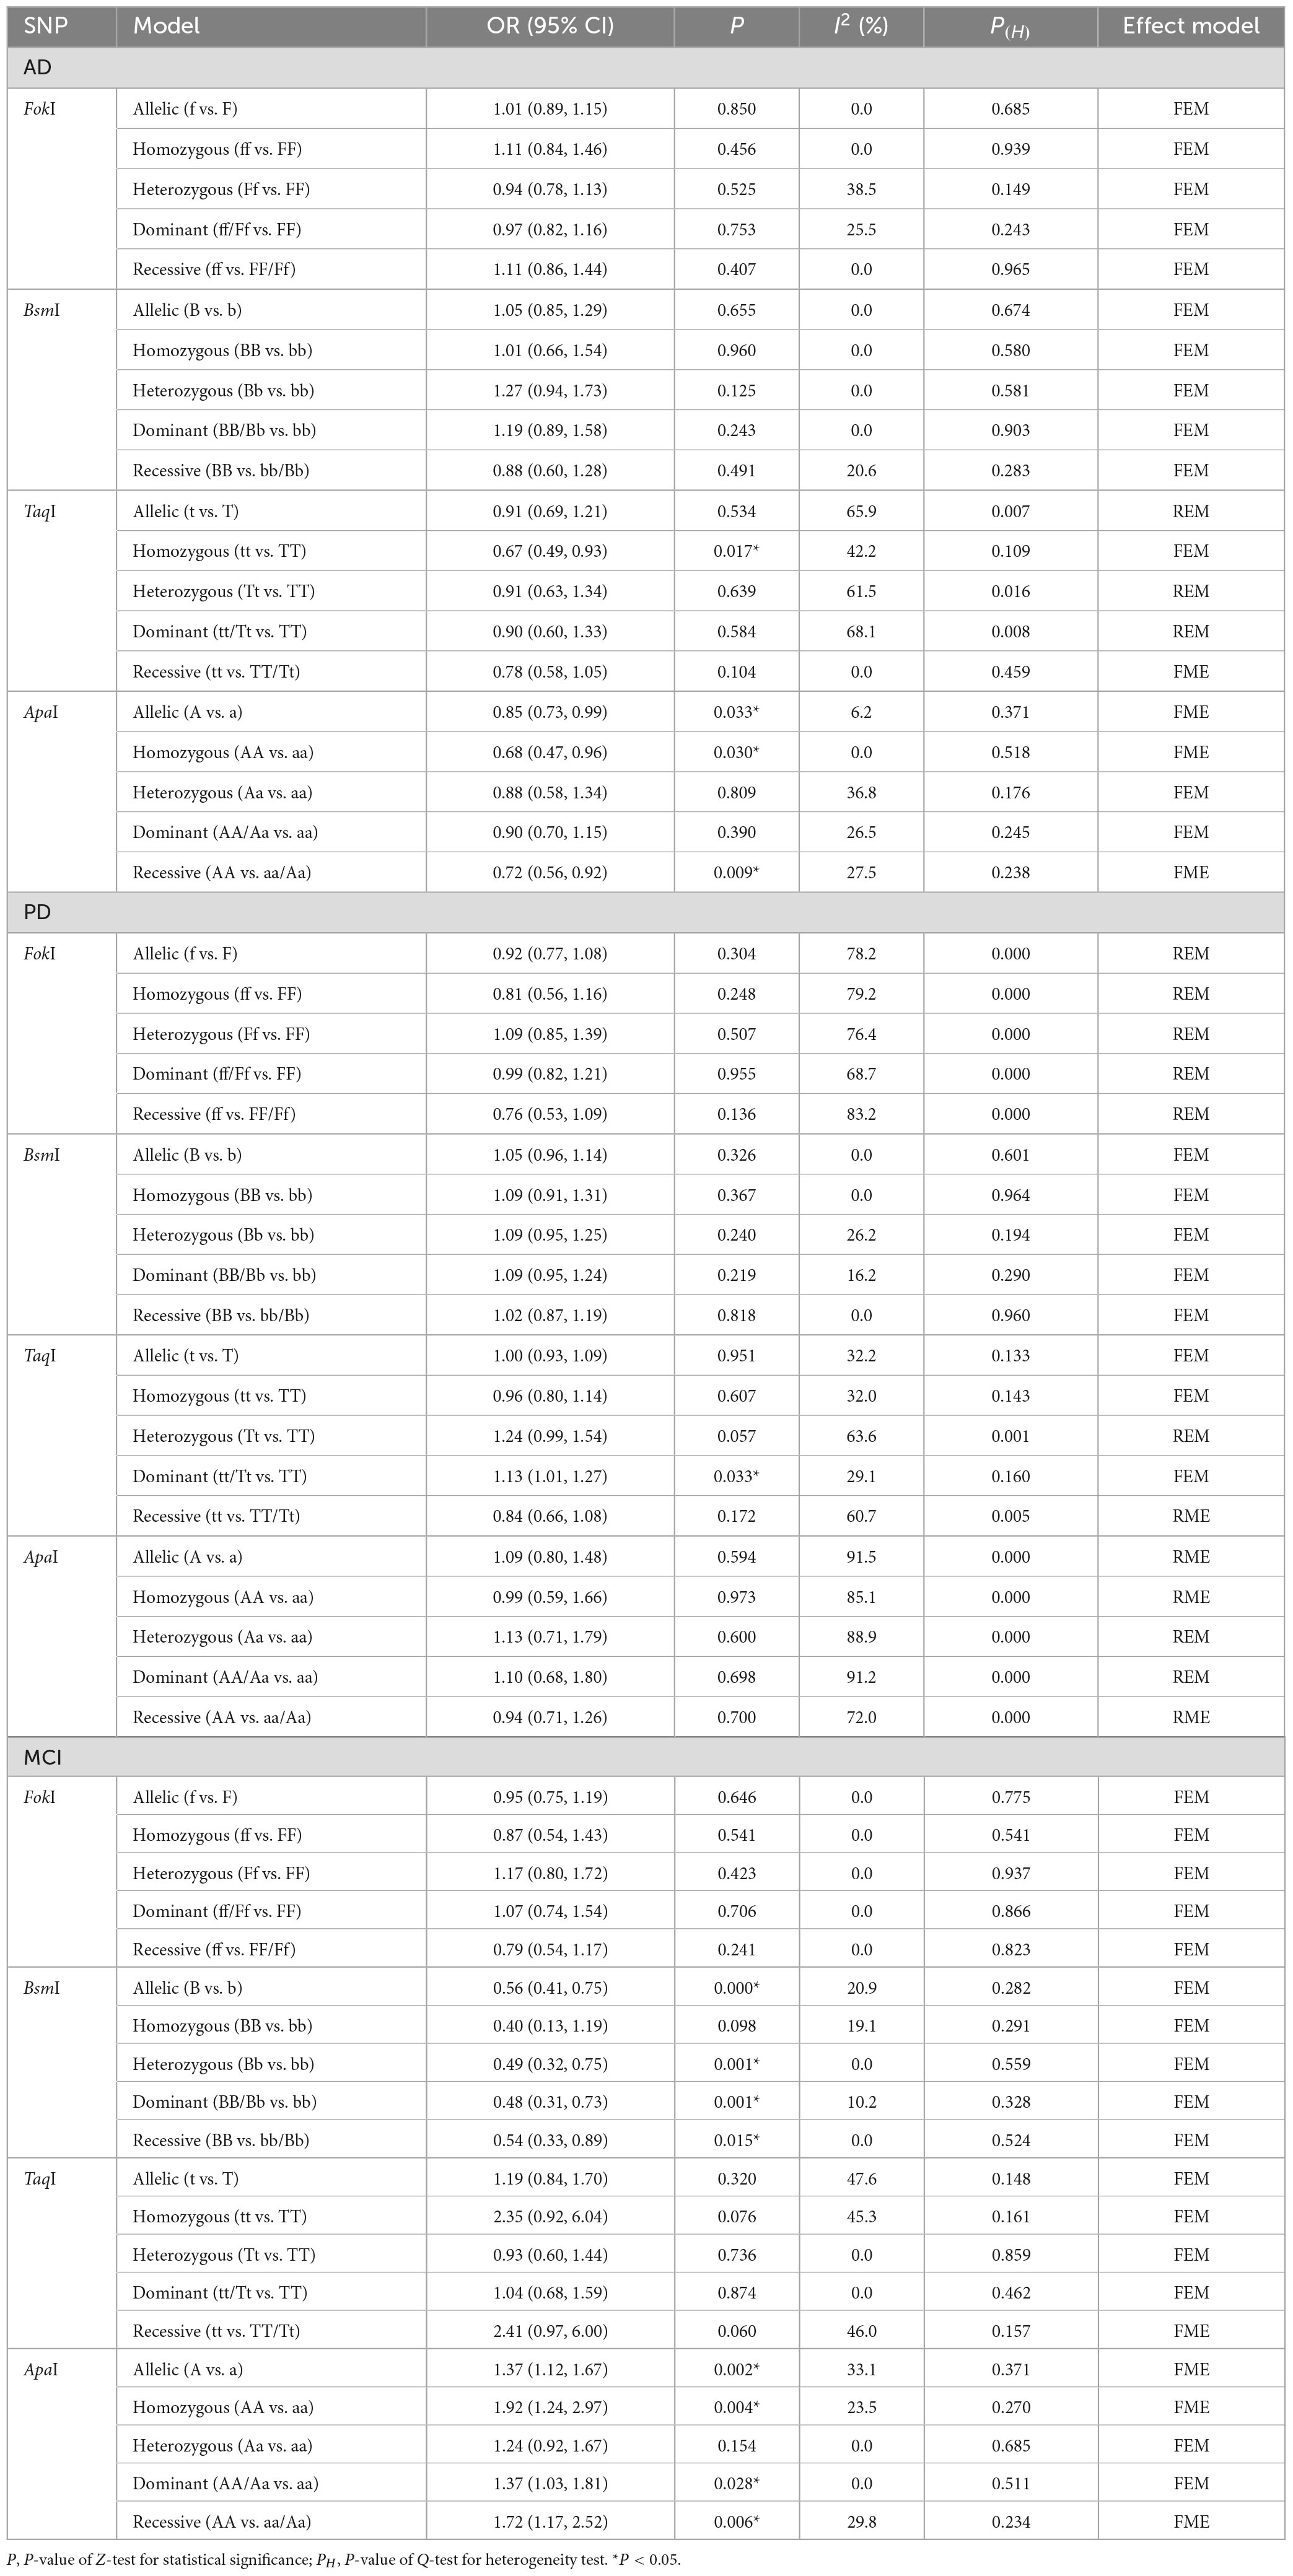
3.3 Associations of VDR gene polymorphisms with AD riskSix articles with 1,031 cases and 1,112 controls explored correlation between VDR FokI polymorphism and the AD risk, five studies with 494 cases and 622 controls detected correlation between VDR BsmI polymorphism and the AD risk, seven studies with 816 cases and 991 controls examined relationship between VDR TaqI polymorphism and the AD risk, and five literatures involving 685 cases and 879 controls investigated association between VDR ApaI polymorphism and the AD risk. As for VDR FokI (f vs. F: OR = 1.01, 95% CI = 0.89–1.15, P = 0.850; ff vs. FF: OR = 1.11, 95% CI = 0.84–1.46, P = 0.456; Ff vs. FF: OR = 0.94, 95% CI = 0.78–1.13, P = 0.525; ff/Ff vs. FF: OR = 0.97, 95% CI = 0.82–1.16, P = 0.753; ff vs. Ff/FF: OR = 1.11, 95% CI = 0.86–1.44, P = 0.407, Supplementary Figure 1) and BsmI polymorphisms (B vs. b: OR = 1.05, 95% CI = 0.85–1.29, P = 0.655; BB vs. bb: OR = 1.01, 95% CI = 0.66–1.54, P = 0.960; Bb vs. bb: OR = 1.27, 95% CI = 0.94–1.73, P = 0.125; BB/Bb vs. bb: OR = 1.19, 95% CI = 0.89–1.58, P = 0.243; BB vs. Bb/bb: OR = 0.88, 95% CI = 0.60–1.28, P = 0.491, Supplementary Figure 2), we did not find any prominent associations in overall and subgroup analyses. The overall pooled results manifested that VDR TaqI polymorphism was dramatically relevant to AD risk under homozygous model (tt vs. TT: OR = 0.67, 95% CI = 0.49–0.93, P = 0.017, Supplementary Figure 3), and the ApaI polymorphism was significantly correlated with AD risk under allelic, homozygous, and recessive models (A vs. a: OR = 0.85, 95% CI = 0.73–0.99, P = 0.033; AA vs. aa: OR = 0.68, 95% CI = 0.47–0.96, P = 0.030; AA vs. Aa/aa: OR = 0.72, 95% CI = 0.56–0.92, P = 0.009, Figure 2 and Table 3).
Figure 2. Forest plots for the association between VDR ApaI polymorphism and AD risk in five models. (A) Allele model; (B) homozygote model; (C) heterozygote model; (D) dominant model; (E) recessive model.
Table 3. Meta-analysis results for the relationship of VDR gene SNPs with AD, MCI, and PD risk.
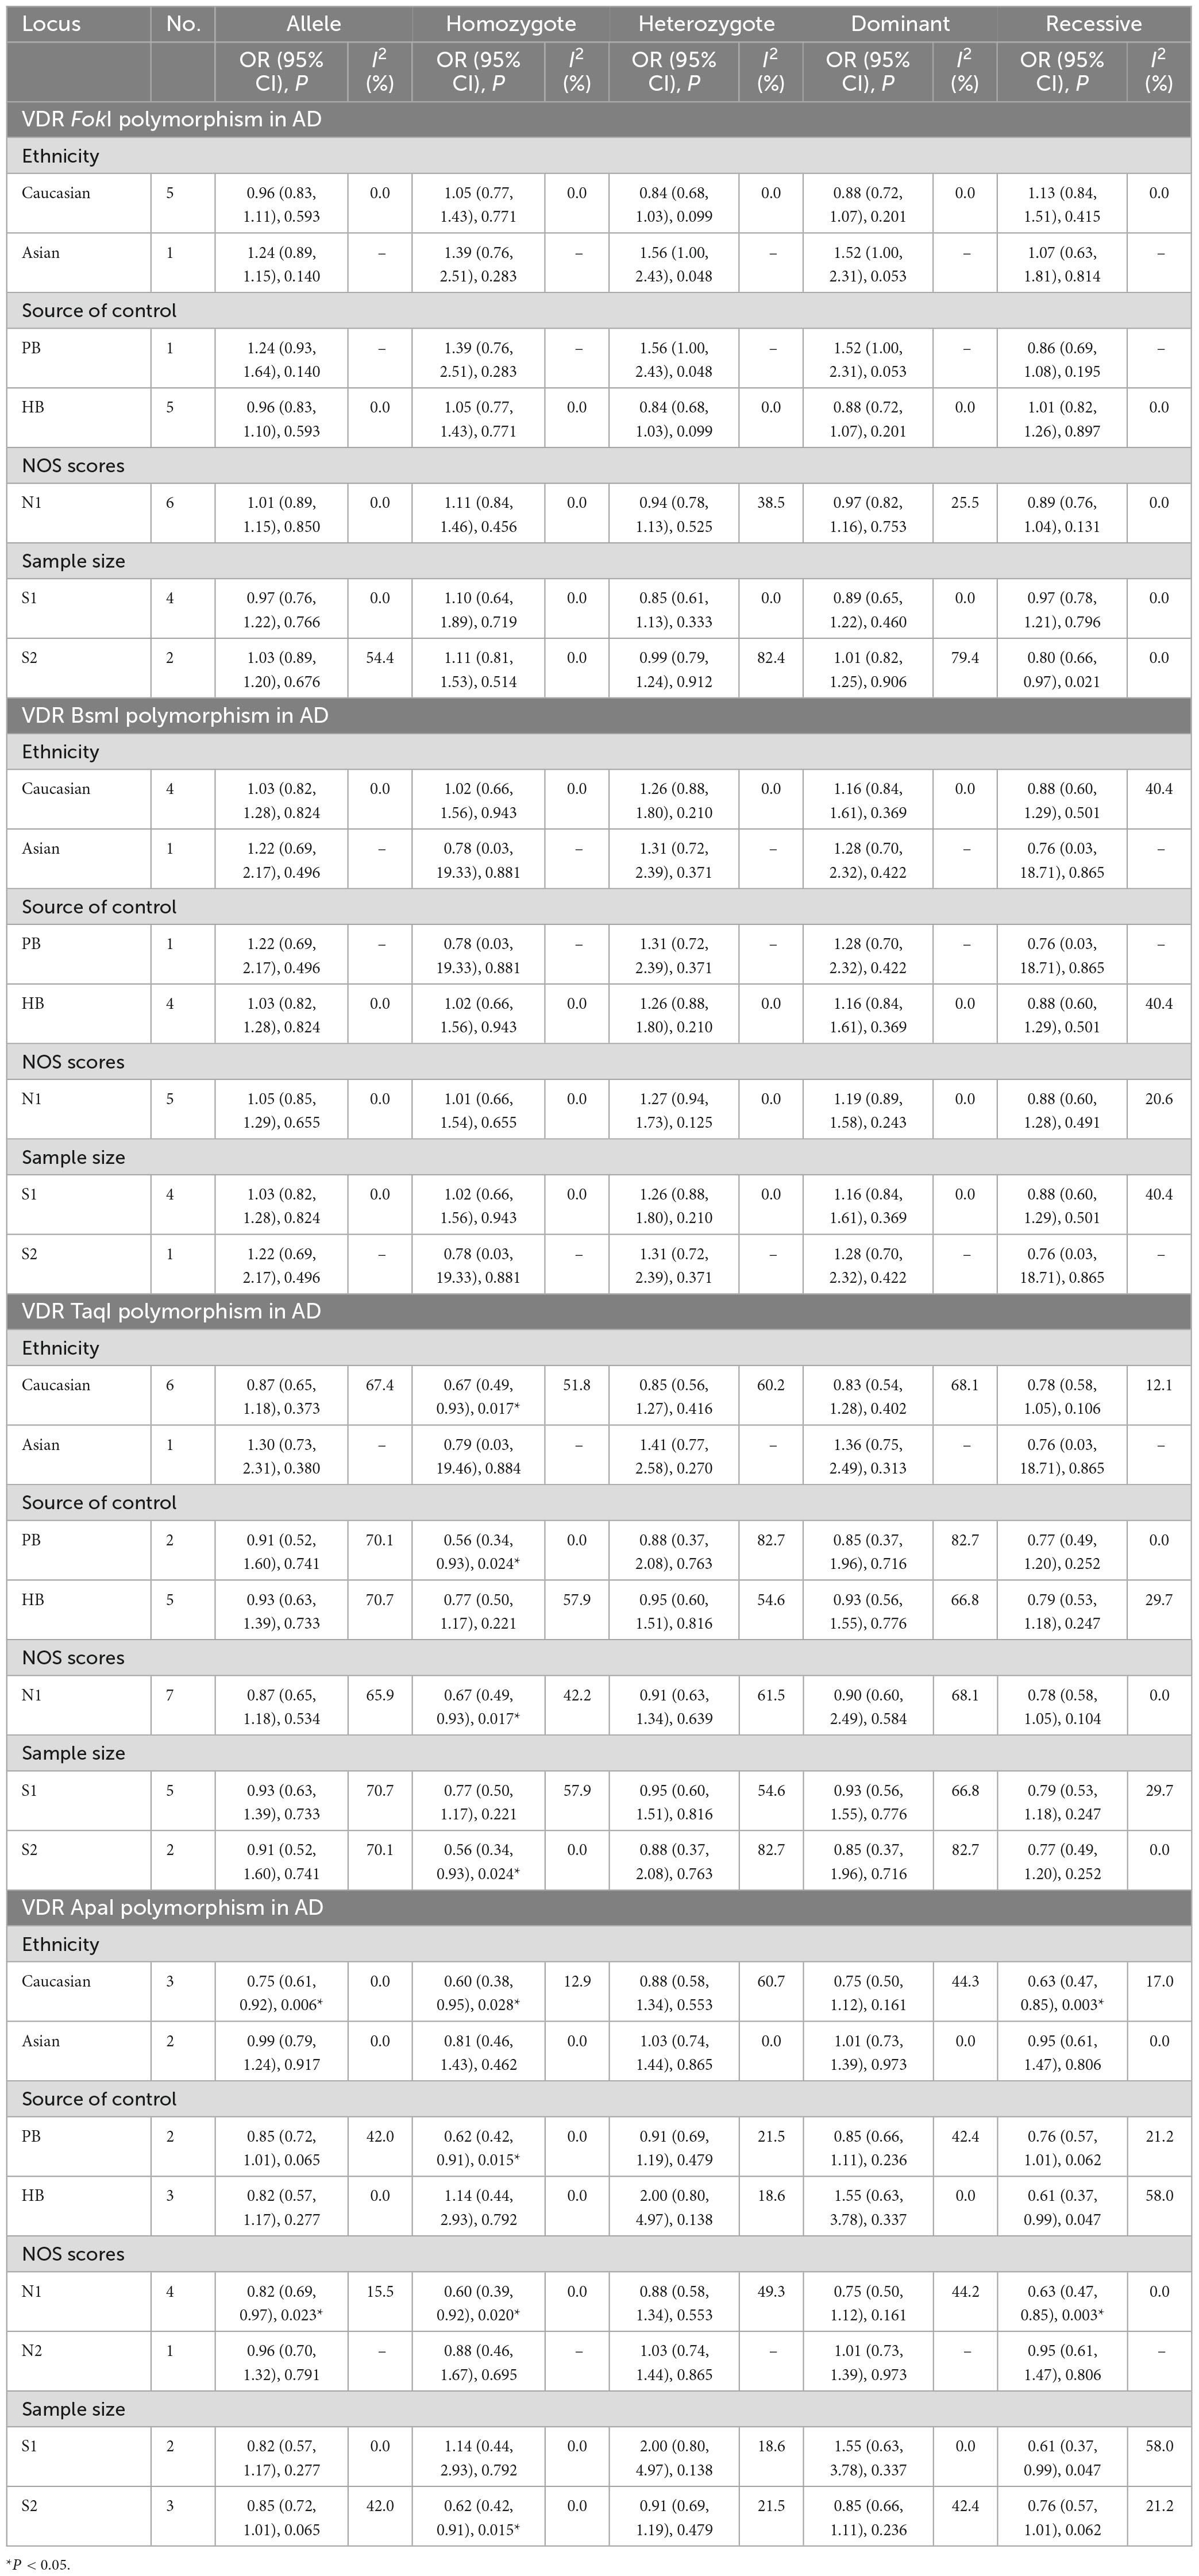
Stratification analyses of ethnicity displayed remarkable association between TaqI genotype and decreased AD risk among Caucasians (tt vs. TT: OR = 0.67, 95% CI = 0.49–0.93, P = 0.017). Likewise, the ApaI AA genotype evidently reduced the AD risk in Caucasian descents (A vs. a: OR = 0.75, 95% CI = 0.61–0.92, P = 0.006; AA vs. aa: OR = 0.60, 95% CI = 0.38–0.95, P = 0.028; AA vs. Aa/aa: OR = 0.63, 95% CI = 0.47–0.85, P = 0.003). When subgroup analyses were performed to assess the effect of heterogeneity on the results, the homozygous model of TaqI was significantly correlated with AD susceptibility in subgroups of PB (tt vs. TT: OR = 0.56, 95% CI = 0.34–0.93, P = 0.024), high quality score (tt vs. TT: OR = 0.67, 95% CI = 0.49–0.93, P = 0.017) and large sample size (tt vs. TT: OR = 0.56, 95% CI = 0.34–0.93, P = 0.024). In addition, the ApaI polymorphism was notably related to AD risk in PB (AA vs. aa: OR = 0.62, 95% CI = 0.42–0.91, P = 0.015), high quality score (A vs. a: OR = 0.82, 95% CI = 0.69–0.97, P = 0.023; AA vs. aa: OR = 0.60, 95% CI = 0.39–0.92, P = 0.020; AA vs. Aa/aa: OR = 0.63, 95% CI = 0.47–0.85, P = 0.003), and large sample size (AA vs. aa: OR = 0.62, 95% CI = 0.42–0.91, P = 0.015, Table 4). Except for the allelic, heterozygous and dominant models of VDR TaqI polymorphism, there was no heterogeneity in three other VDR gene polymorphisms.
Table 4. Meta-analysis results for the association between vitamin D receptor gene polymorphisms and AD based on subgroup analyses.
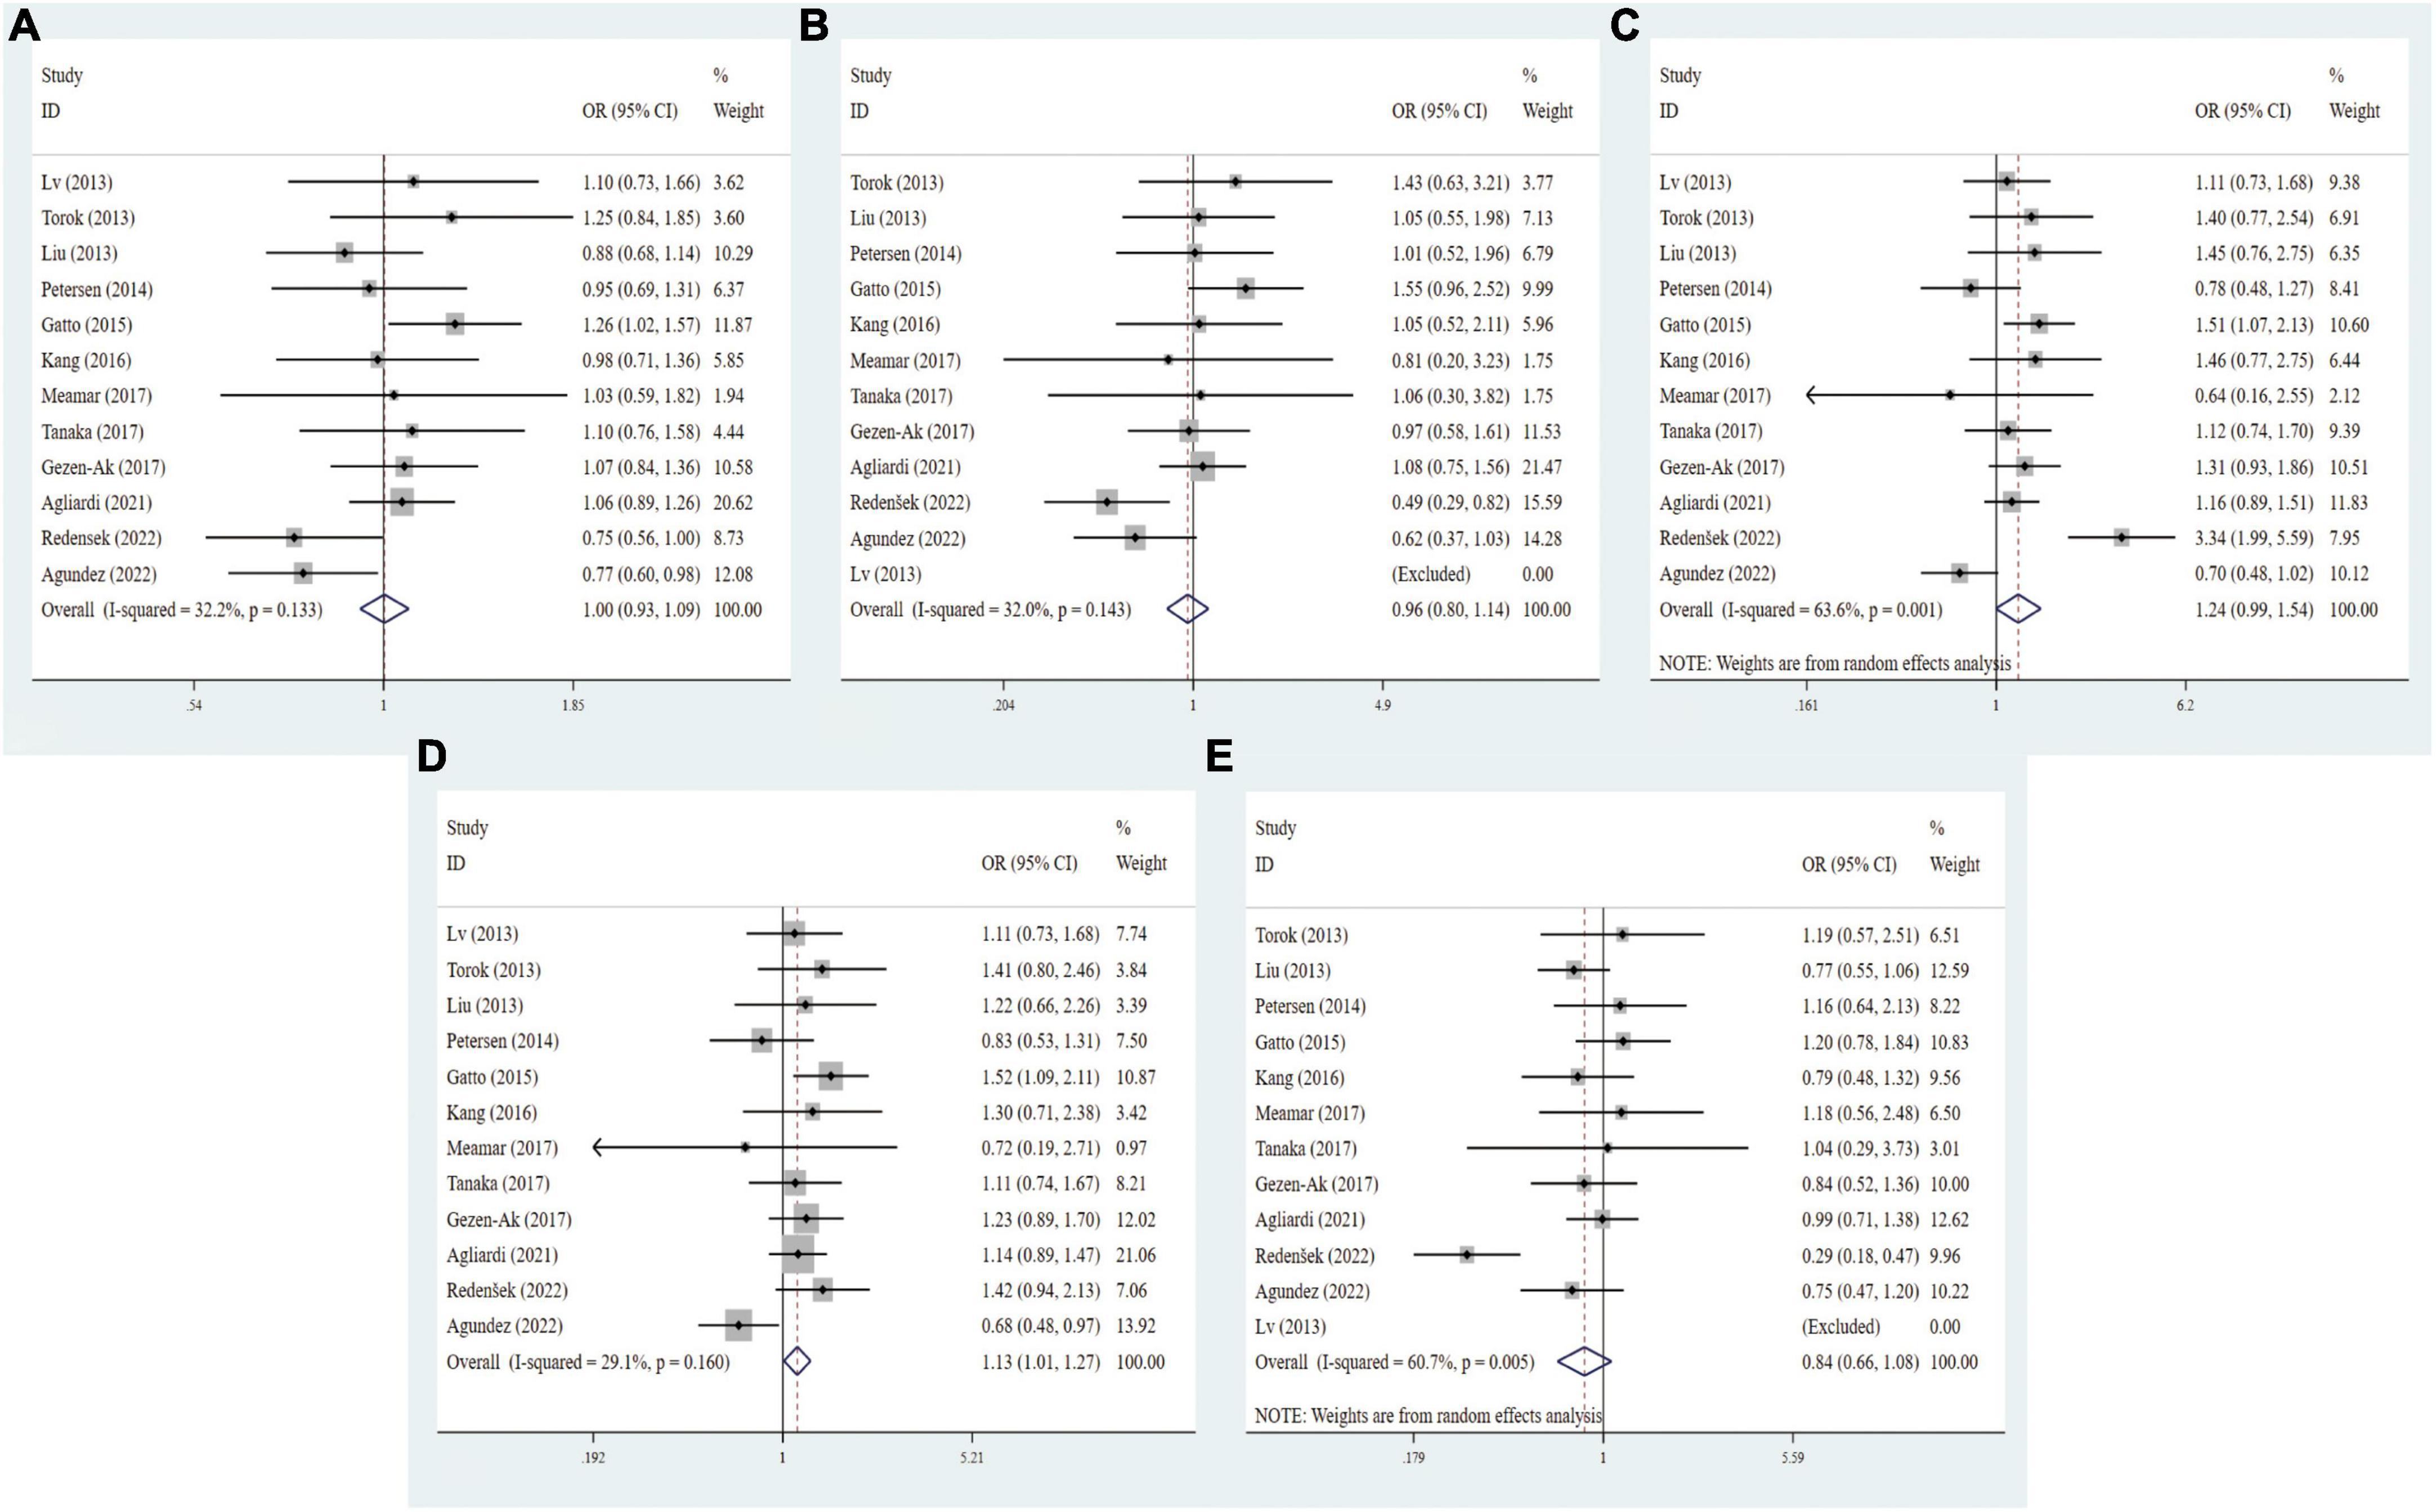
3.4 Associations of VDR gene polymorphisms with PD riskTo identify the potential associations of VDR gene polymorphisms with the risk of PD, 12 studies about VDR FokI polymorphism (2,979 cases and 3,484 controls), 11 studies about VDR BsmI polymorphism (2,284 cases and 3,045 controls), 12 studies about TaqI polymorphism (3,001 cases and 3,566 controls), and 10 studies about VDR ApaI polymorphism (2,284 cases and 2,930 controls) were included in this meta-analysis, respectively. As shown in Table 3, there were no associations between FokI (f vs. F: OR = 0.94, 95% CI = 0.79–1.11, P = 0.474; ff vs. FF: OR = 0.84, 95% CI = 0.59–1.21, P = 0.355; Ff vs. FF: OR = 1.10, 95% CI = 0.83–2.36, P = 0.505; ff/Ff vs. FF: OR = 1.00, 95% CI = 0.81–1.24, P = 0.999; ff vs. Ff/FF: OR = 0.81, 95% CI = 0.56–1.16, P = 0.252, Supplementary Figure 4), BsmI (B vs. b: OR = 1.06, 95% CI = 0.97–1.16, P = 0.231; BB vs. bb: OR = 1.08, 95% CI = 0.89–1.30, P = 0.437; Bb vs. bb: OR = 1.14, 95% CI = 0.96–1.36, P = 0.070; BB/Bb vs. bb: OR = 1.13, 95% CI = 0.99–1.29, P = 0.208; BB vs. Bb/bb: OR = 1.00, 95% CI = 0.85–1.17, P = 0.992, Supplementary Figure 5), and ApaI (A vs. a: OR = 1.09, 95% CI = 0.80–1.48, P = 0.594; AA vs. aa: OR = 0.99, 95% CI = 0.59–1.66, P = 0.973; Aa vs. aa: OR = 1.13, 95% CI = 0.71–1.79, P = 0.600; AA/Aa vs. aa: OR = 1.10, 95% CI = 0.68–1.80, P = 0.698; AA vs. Aa/aa: OR = 0.94, 95% CI = 0.71–1.26, P = 0.700, Supplementary Figure 6) gene polymorphisms and the risk of PD. Intriguingly, the dominant model of TaqI polymorphism was slightly linked with elevated PD susceptibility (tt/Tt vs. TT: OR = 1.12, 95% CI = 0.97–1.29, P = 0.035, Figure 3).
Figure 3. Forest plots for the association between VDR TaqI polymorphism and PD risk in five models. (A) Allele model; (B) homozygote model; (C) heterozygote model; (D) dominant model; (E) recessive model.
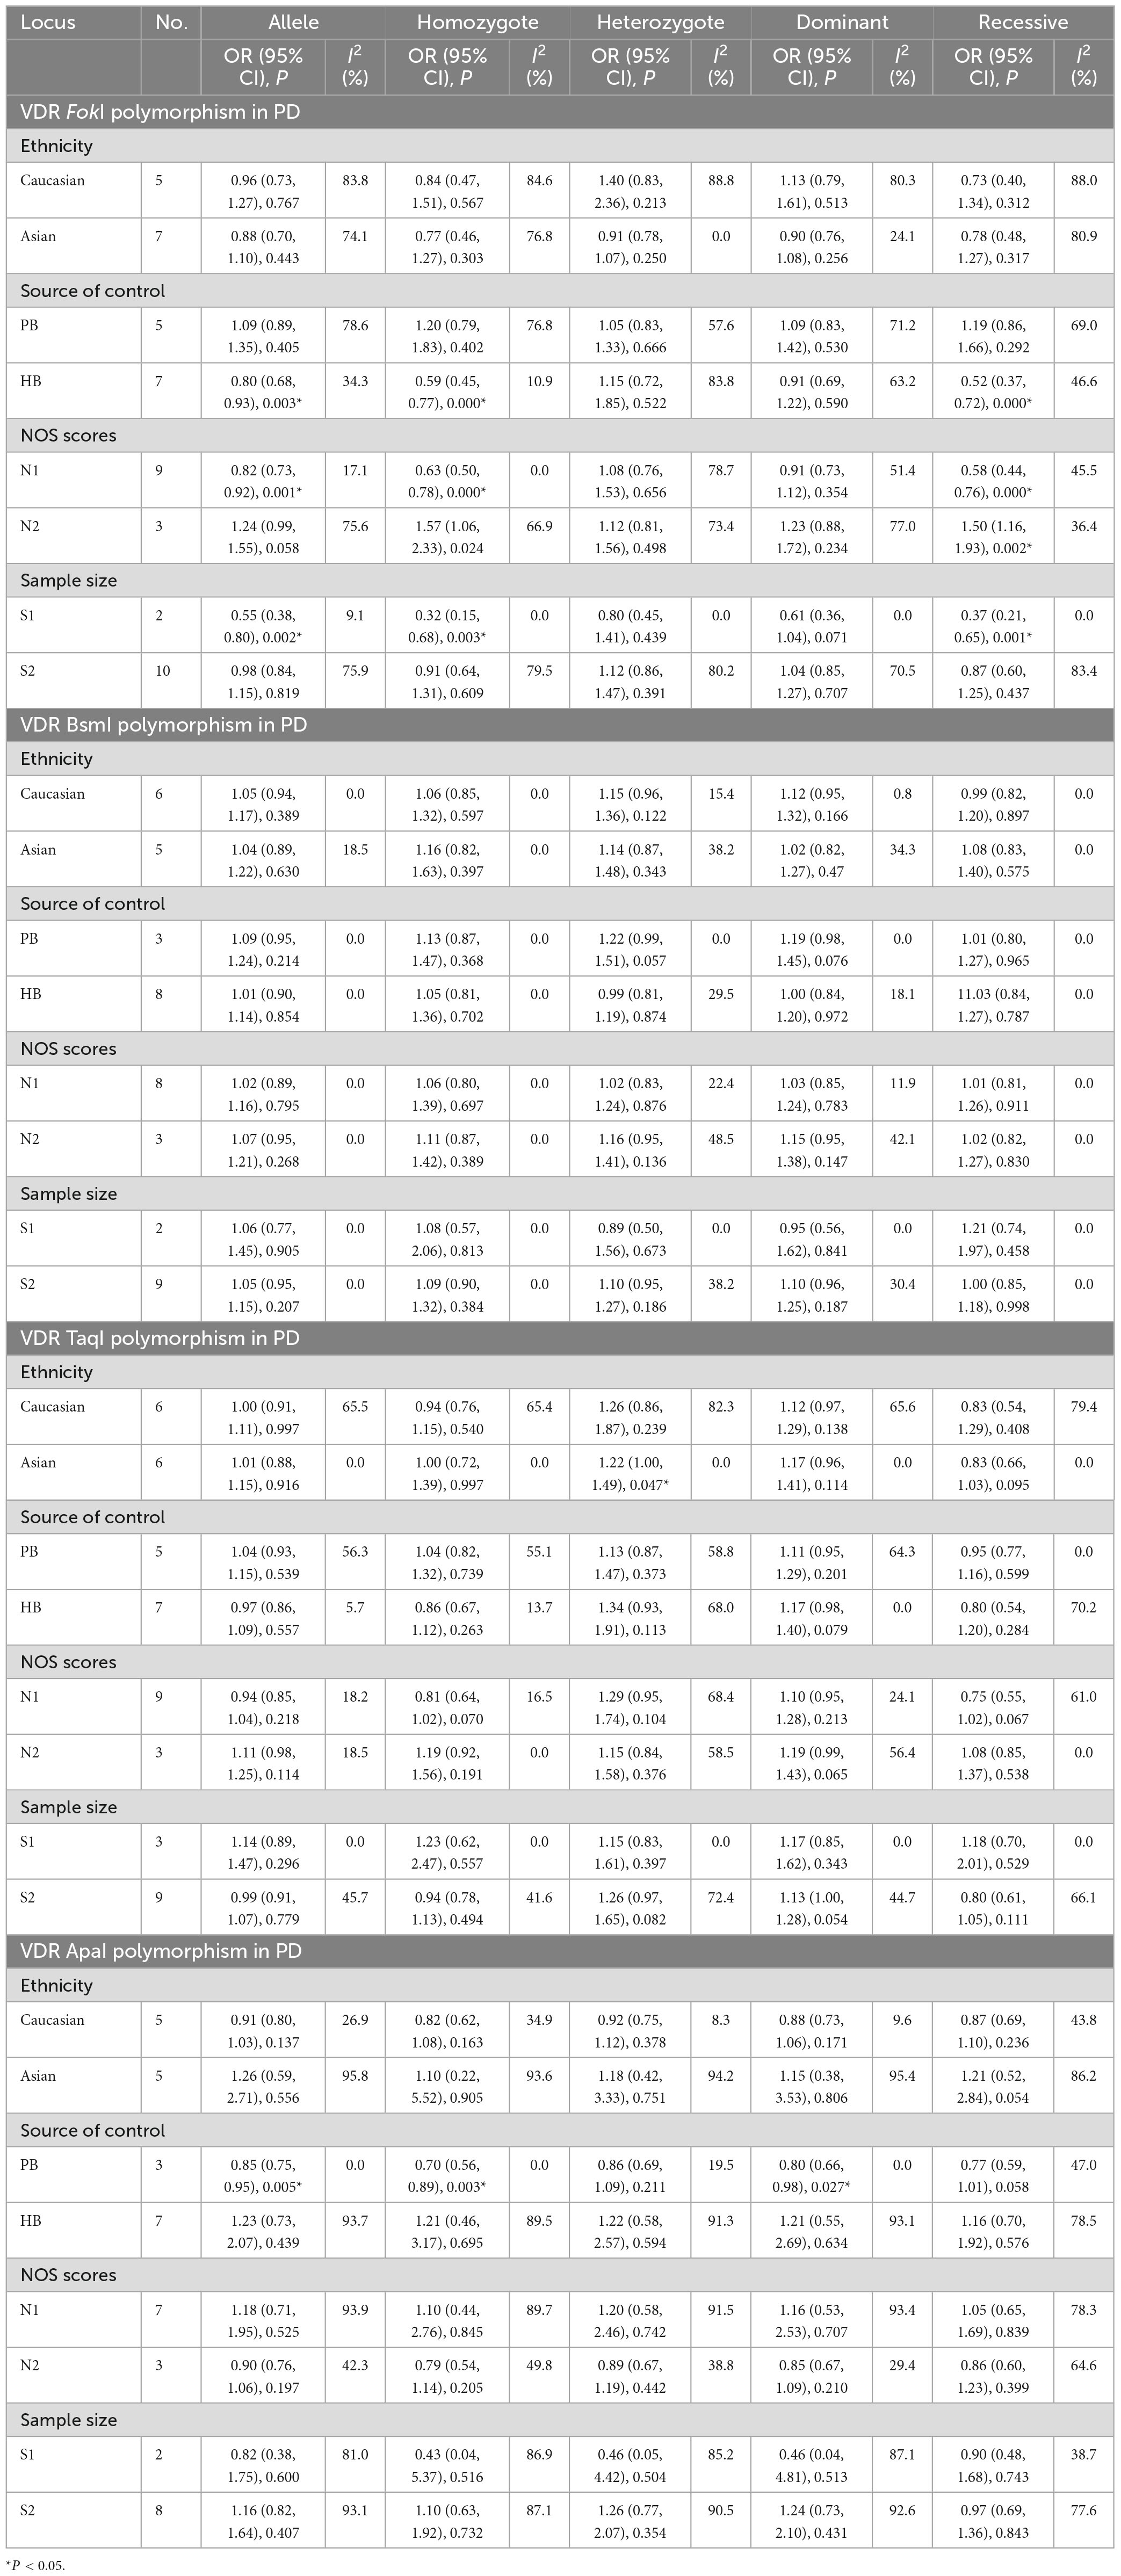
As revealed by ethnicity subgroup analysis, there was no significant relationships between FokI, BsmI, and ApaI gene polymorphisms and PD susceptibility in Table 5. Conversely, the TaqI polymorphism slightly increased the risk of PD in heterozygous models among Asians (Tt vs. TT: OR = 1.22, 95% CI = 1.00–1.49, P = 0.047). When stratified by source of control, quality scores, and sample size, the FokI variant was definitely associated with PD susceptibility in the HB (f vs. F: OR = 0.80, 95% CI = 0.68–0.93, P = 0.003; ff vs. FF: OR = 0.59, 95% CI = 0.45–0.77, P = 0.000; ff/Ff vs. FF: OR = 0.58, 95% CI = 0.44–0.76, P = 0.000), low quality score (f vs. F: OR = 0.82, 95% CI = 0.73–0.92, P = 0.001; ff vs. FF: OR = 0.63, 95% CI = 0.50–0.78, P = 0.000; ff/Ff vs. FF: OR = 0.58, 95% CI = 0.45–0.81, P = 0.001), high quality score (ff/Ff vs. FF: OR = 1.50, 95% CI = 1.16–1.93, P = 0.002), and small sample size (f vs. F: OR = 0.55, 95% CI = 0.38–0.80, P = 0.002; ff vs. FF: OR = 0.32, 95% CI = 0.15–0.78, P = 0.003; ff/Ff vs. FF: OR = 0.37, 95% CI = 0.21–0.65, P = 0.001). There was a significant relation between VDR ApaI variant and PD predisposition in the PB subgroup (A vs. a: OR = 0.85, 95% CI = 0.75–0.95, P = 0.005; AA vs. aa: OR = 0.70, 95% CI = 0.56–0.89, P = 0.003; AA/Aa vs. aa: OR = 0.80, 95% CI = 0.66–0.98, P = 0.027; AA vs. Aa/aa: OR = 0.77, 95% CI = 0.59–1.01, P = 0.058, Table 5). Stratified analyses by source of control, quality score and sample size, no prominent relationships between the BsmI and TaqI polymorphisms and PD risk was detected. For the FokI, heterogeneity was shown to present in all five comparisons of overall, and Caucasian subgroup. In addition, the heterogeneity existed in overall group and Asian subgroup of the TaqI. However, we discovered no heterogeneity in the BsmI and ApaI polymorphisms.
Table 5. Meta-analysis results for the association between vitamin D receptor gene polymorphisms and PD based on subgroup analyses.
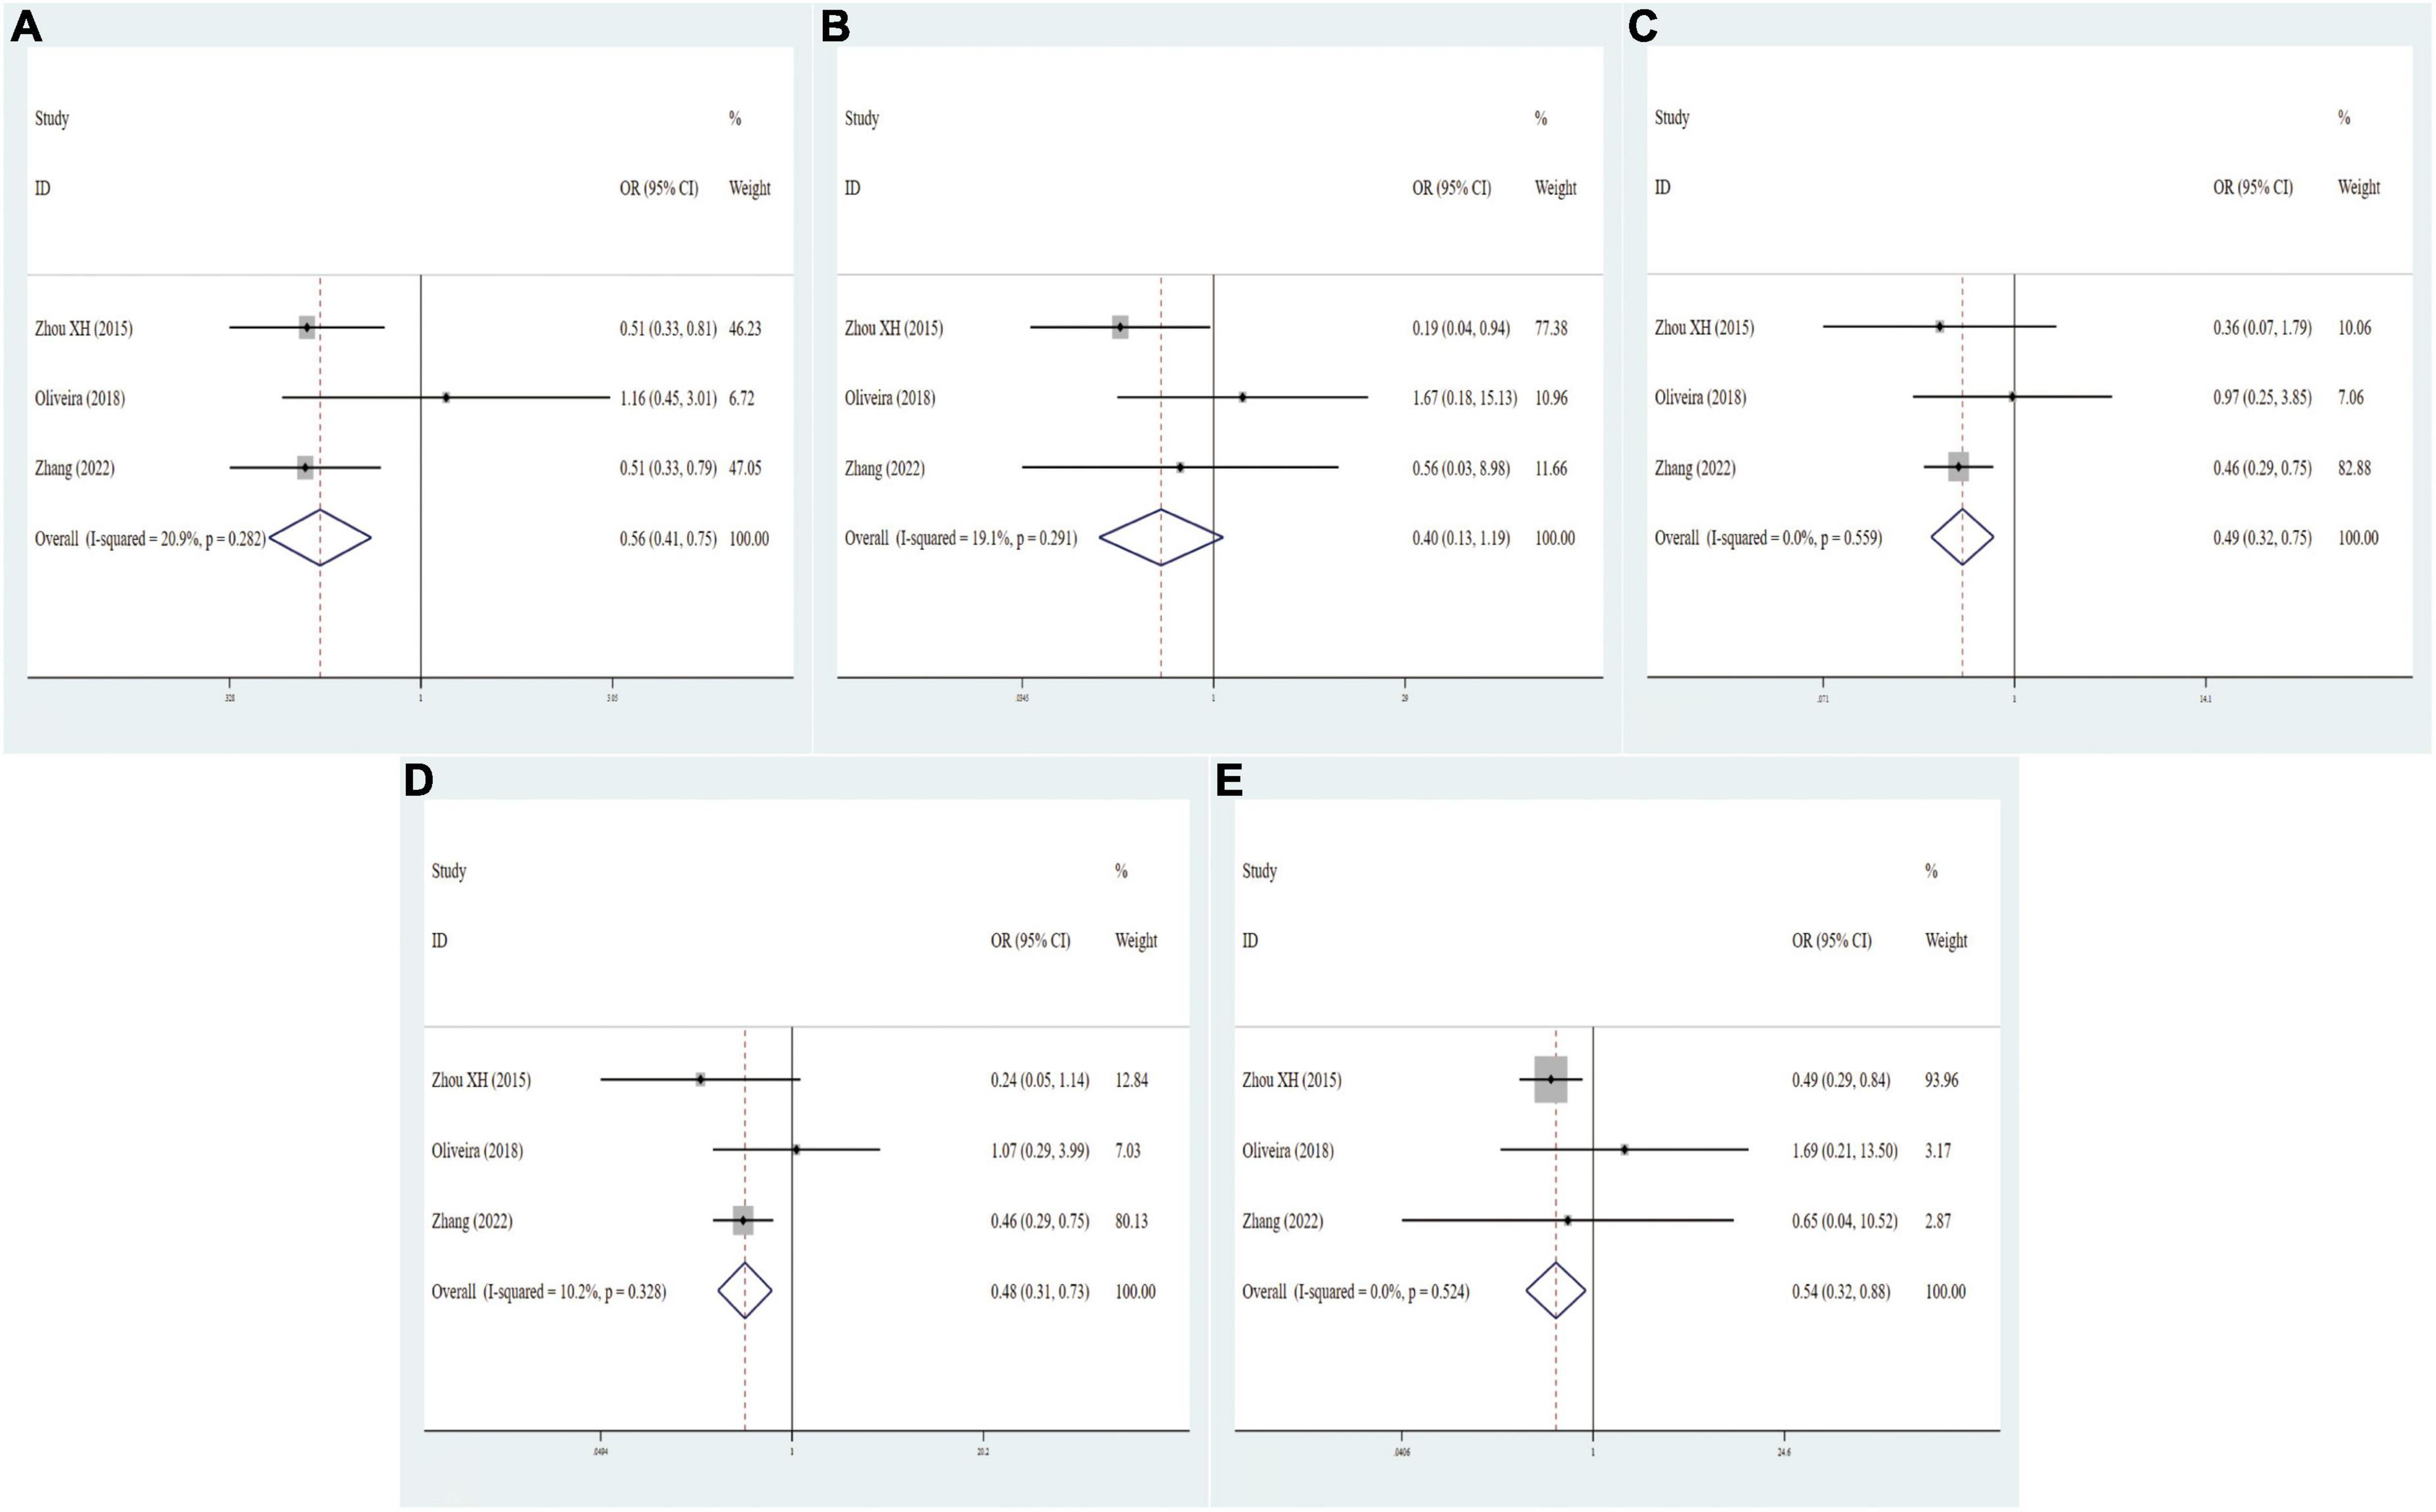
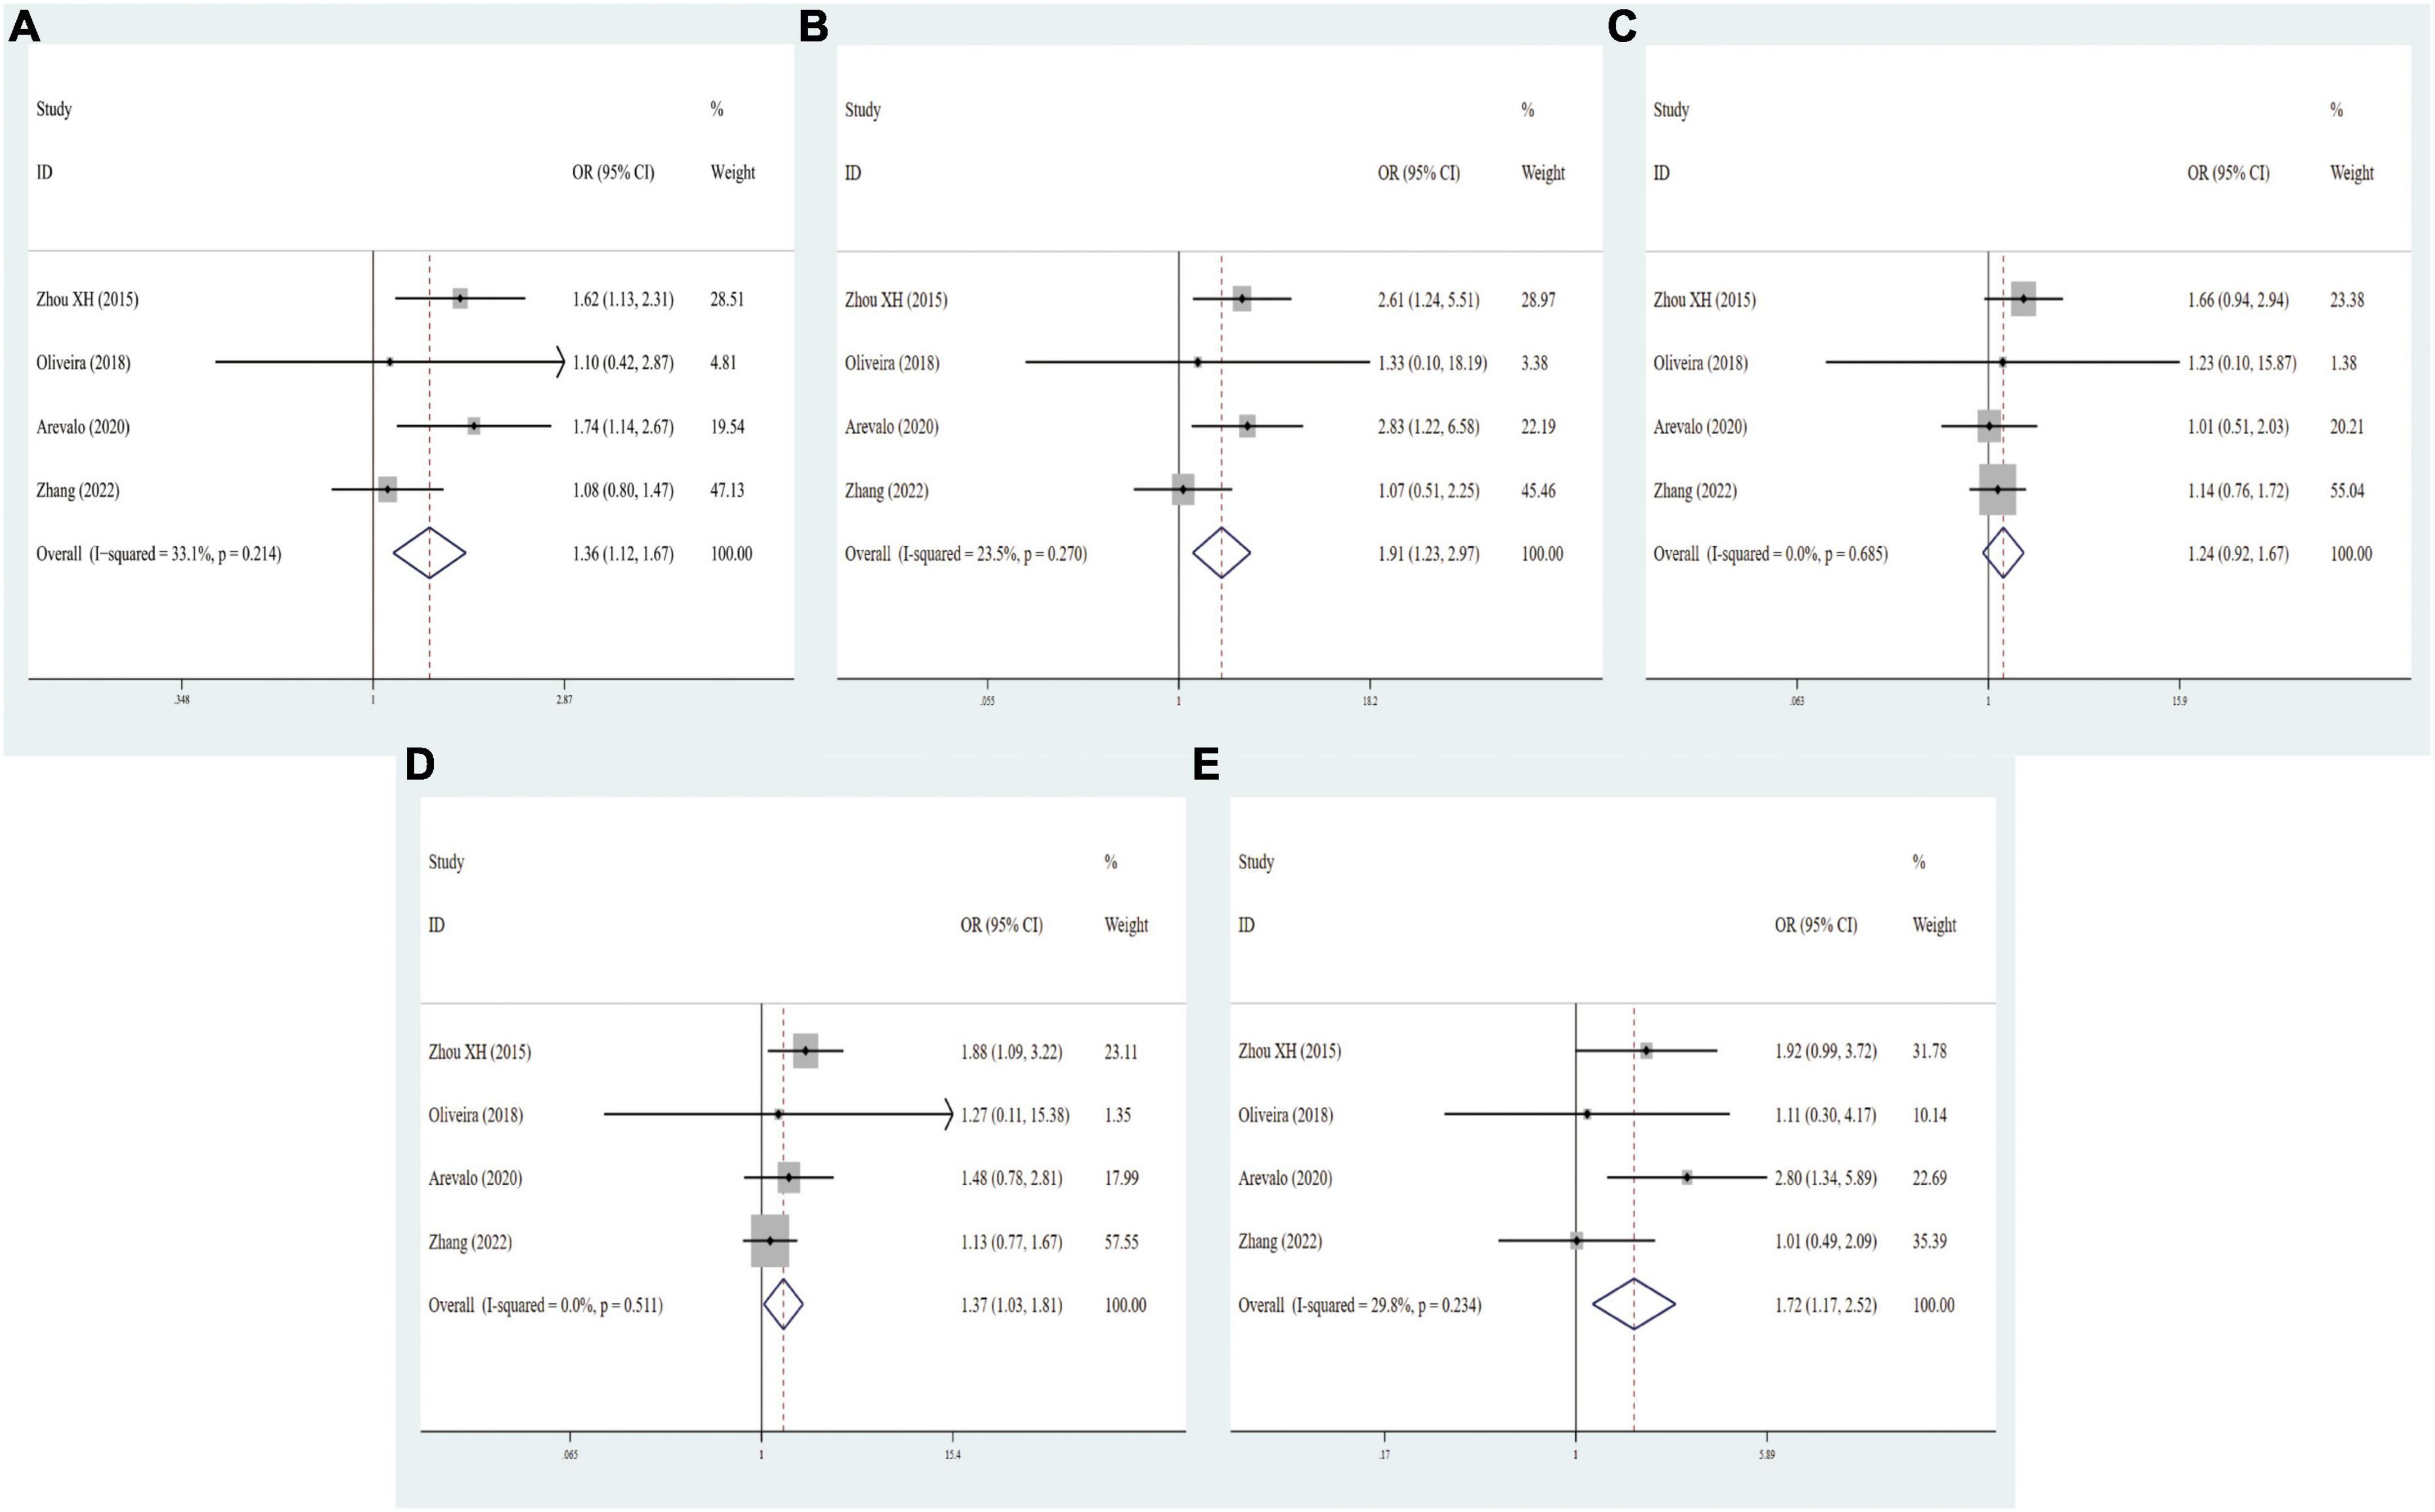
3.5 Associations of VDR gene polymorphisms with MCI riskIn general, three eligible studies with 329 cases and 320 controls for FokI, three studies with 400 cases and 319 controls for BsmI, three studies with 404 cases and 252 controls for TaqI, and four studies with 528 cases and 385 controls for ApaI were finally included in our study. As regards FokI polymorphism, the variant genotypes had no significant association with MCI risk in the five genetic models (f vs. F: OR = 0.95, 95% CI = 0.75–1.19, P = 0.646; ff vs. FF: OR = 0.87, 95% CI = 0.54–1.43, P = 0.541; Ff vs. FF: OR = 1.17, 95% CI = 0.80–1.72, P = 0.001; Ff vs. FF: OR = 1.17, 95% CI = 0.80–1.72, P = 0.001; ff/Ff vs. FF: OR = 1.07, 95% CI = 0.74–1.54, P = 0.706; ff vs. FF/Ff: OR = 0.79, 95% CI = 0.54–1.17, P = 0.241, Supplementary Figure 7). The integrated analyses demonstrated that VDR BsmI polymorphism was evidently correlated with susceptibility to MCI (B vs. b: OR = 0.56, 95% CI = 0.41–0.75, P = 0.000; Bb vs. bb: OR = 0.49, 95% CI = 0.32–0.75, P = 0.001; BB/Bb vs. bb: OR = 0.48, 95% CI = 0.31–0.73, P = 0.001; BB vs. Bb/bb: OR = 0.54, 95% CI = 0.33–0.89, P = 0.015, Figure 4). No clear correlation was found between the TaqI variant and MCI susceptibility (t vs. T: OR = 1.19, 95% CI = 0.84–1.70, P = 0.320; tt vs. TT: OR = 2.35, 95% CI = 0.92–6.04, P = 0.076; Tt vs. TT: OR = 0.93, 95% CI = 0.60–1.44, P = 0.736; tt/Tt vs. TT: OR = 1.04, 95% CI = 0.68–1.59, P = 0.874; tt vs. TT/Tt: OR = 2.41, 95% CI = 0.97–6.00, P = 0.060, Supplementary Figure 8). A statistically significant association of VDR ApaI polymorphism with overall PD risk was discovered in allelic, homozygous, dominant, and recessive models (A vs. a: OR = 1.37, 95% CI = 1.12–1.67, P = 0.002; AA vs. aa: OR = 1.92, 95% CI = 1.24–2.97, P = 0.004; AA/Aa vs. aa: OR = 1.37, 95% CI = 1.03–1.81, P = 0.028; AA vs. Aa/aa: OR = 1.72, 95% CI = 1.17–2.52, P = 0.006, Figure 5 and Table 6).
Figure 4. Forest plots for the association between VDR BsmI polymorphism and MCI risk in five models. (A) Allele model; (B) homozygote model; (C) heterozygote model; (D) dominant model; (E) recessive model.
Figure 5. Forest plots for the association between VDR ApaI polymorphism and MCI risk in five models. (A) Allele model; (B) homozygote model; (C) heterozygote model; (D) dominant model; (E): recessive model.
Table 6. Meta-analysis results for the association between vitamin D receptor gene polymorphisms and MCI based on subgroup analyses.
To further elucidate whether the potential underestimation of the true effect on MCI risk, we stratified these studies in the light of ethnicity, source of controls, quality scores, and sample size. As shown in Table 6, the FokI and TaqI polymorphisms were not remarkably linked with MCI risk. Interestingly, carriers with the BB genotype seemed to have a stronger association with low MCI risk among Asians (B vs. b: OR = 0.51, 95% CI = 0.37–0.70, P = 0.000; BB vs. bb: OR = 0.24, 95% CI = 0.06–0.92, P = 0.038; Bb vs. bb: OR = 0.45, 95% CI = 0.29–0.71, P = 0.001; BB/Bb vs. bb: OR = 0.43, 95% CI = 0.28–0.68, P = 0.000; BB vs. Bb/bb: OR = 0.50, 95% CI = 0.30–0.84, P = 0.008). There were remarkable associations between BsmI polymorphism and MCI risk in PB, small sample size, large sample size, low quality score (B vs. b: OR = 0.60, 95% CI = 0.40–0.90, P = 0.013; BB vs. Bb/bb: OR = 0.53, 95% CI = 0.32–0.89, P = 0.015), high quality score (B vs. b: OR = 0.51, 95% CI = 0.33–0.79, P = 0.003; Bb vs. bb: OR = 0.46, 95% CI = 0.29–0.75, P = 0.002; BB/Bb vs. bb: OR = 0.46, 95% CI = 0.29–0.75, P = 0.001). Next, stratified analyses showed that the ApaI variant was positively associated with the predisposition to MCI in Caucasian (A vs. a: OR = 1.62, 95% CI = 1.10–2.38, P = 0.016; AA vs. aa: OR = 2.63, 95% CI = 1.18–5.87, P = 0.018; AA vs. Aa/aa: OR = 2.28, 95% CI = 1.21–4.30, P = 0.011) and Asian descents (A vs. a: OR = 1.28, 95% CI = 1.02–1.62, P = 0.036). Similarly, a prominent correlation of the ApaI polymorphism and MCI risk was discovered in subgroups of HB (A vs. a: OR = 1.62, 95% CI = 1.10–2.38, P = 0.016; AA vs. aa: OR = 2.63, 95% CI = 1.18–5.87, P = 0.018; AA vs. Aa/aa: OR = 2.28, 95% CI = 1.21–4.30, P = 0.011), PB (A vs. a: OR = 1.28, 95% CI = 1.02–1.62, P = 0.036), low quality score, and small sample size (A vs. a: OR = 1.62, 95% CI = 1.24–2.10, P = 0.000; AA vs. aa: OR = 2.62, 95% CI = 1.52–4.53, P = 0.001; AA/Aa vs. aa: OR = 1.69, 95% CI = 1.13–2.54, P = 0.011, Table 6). The result of heterogeneity test exhibited I2 < 50%, indicating no heterogeneity in all the five genetic models of these VDR SNPs, and thus fixed-effects model was used to examine the correlation.
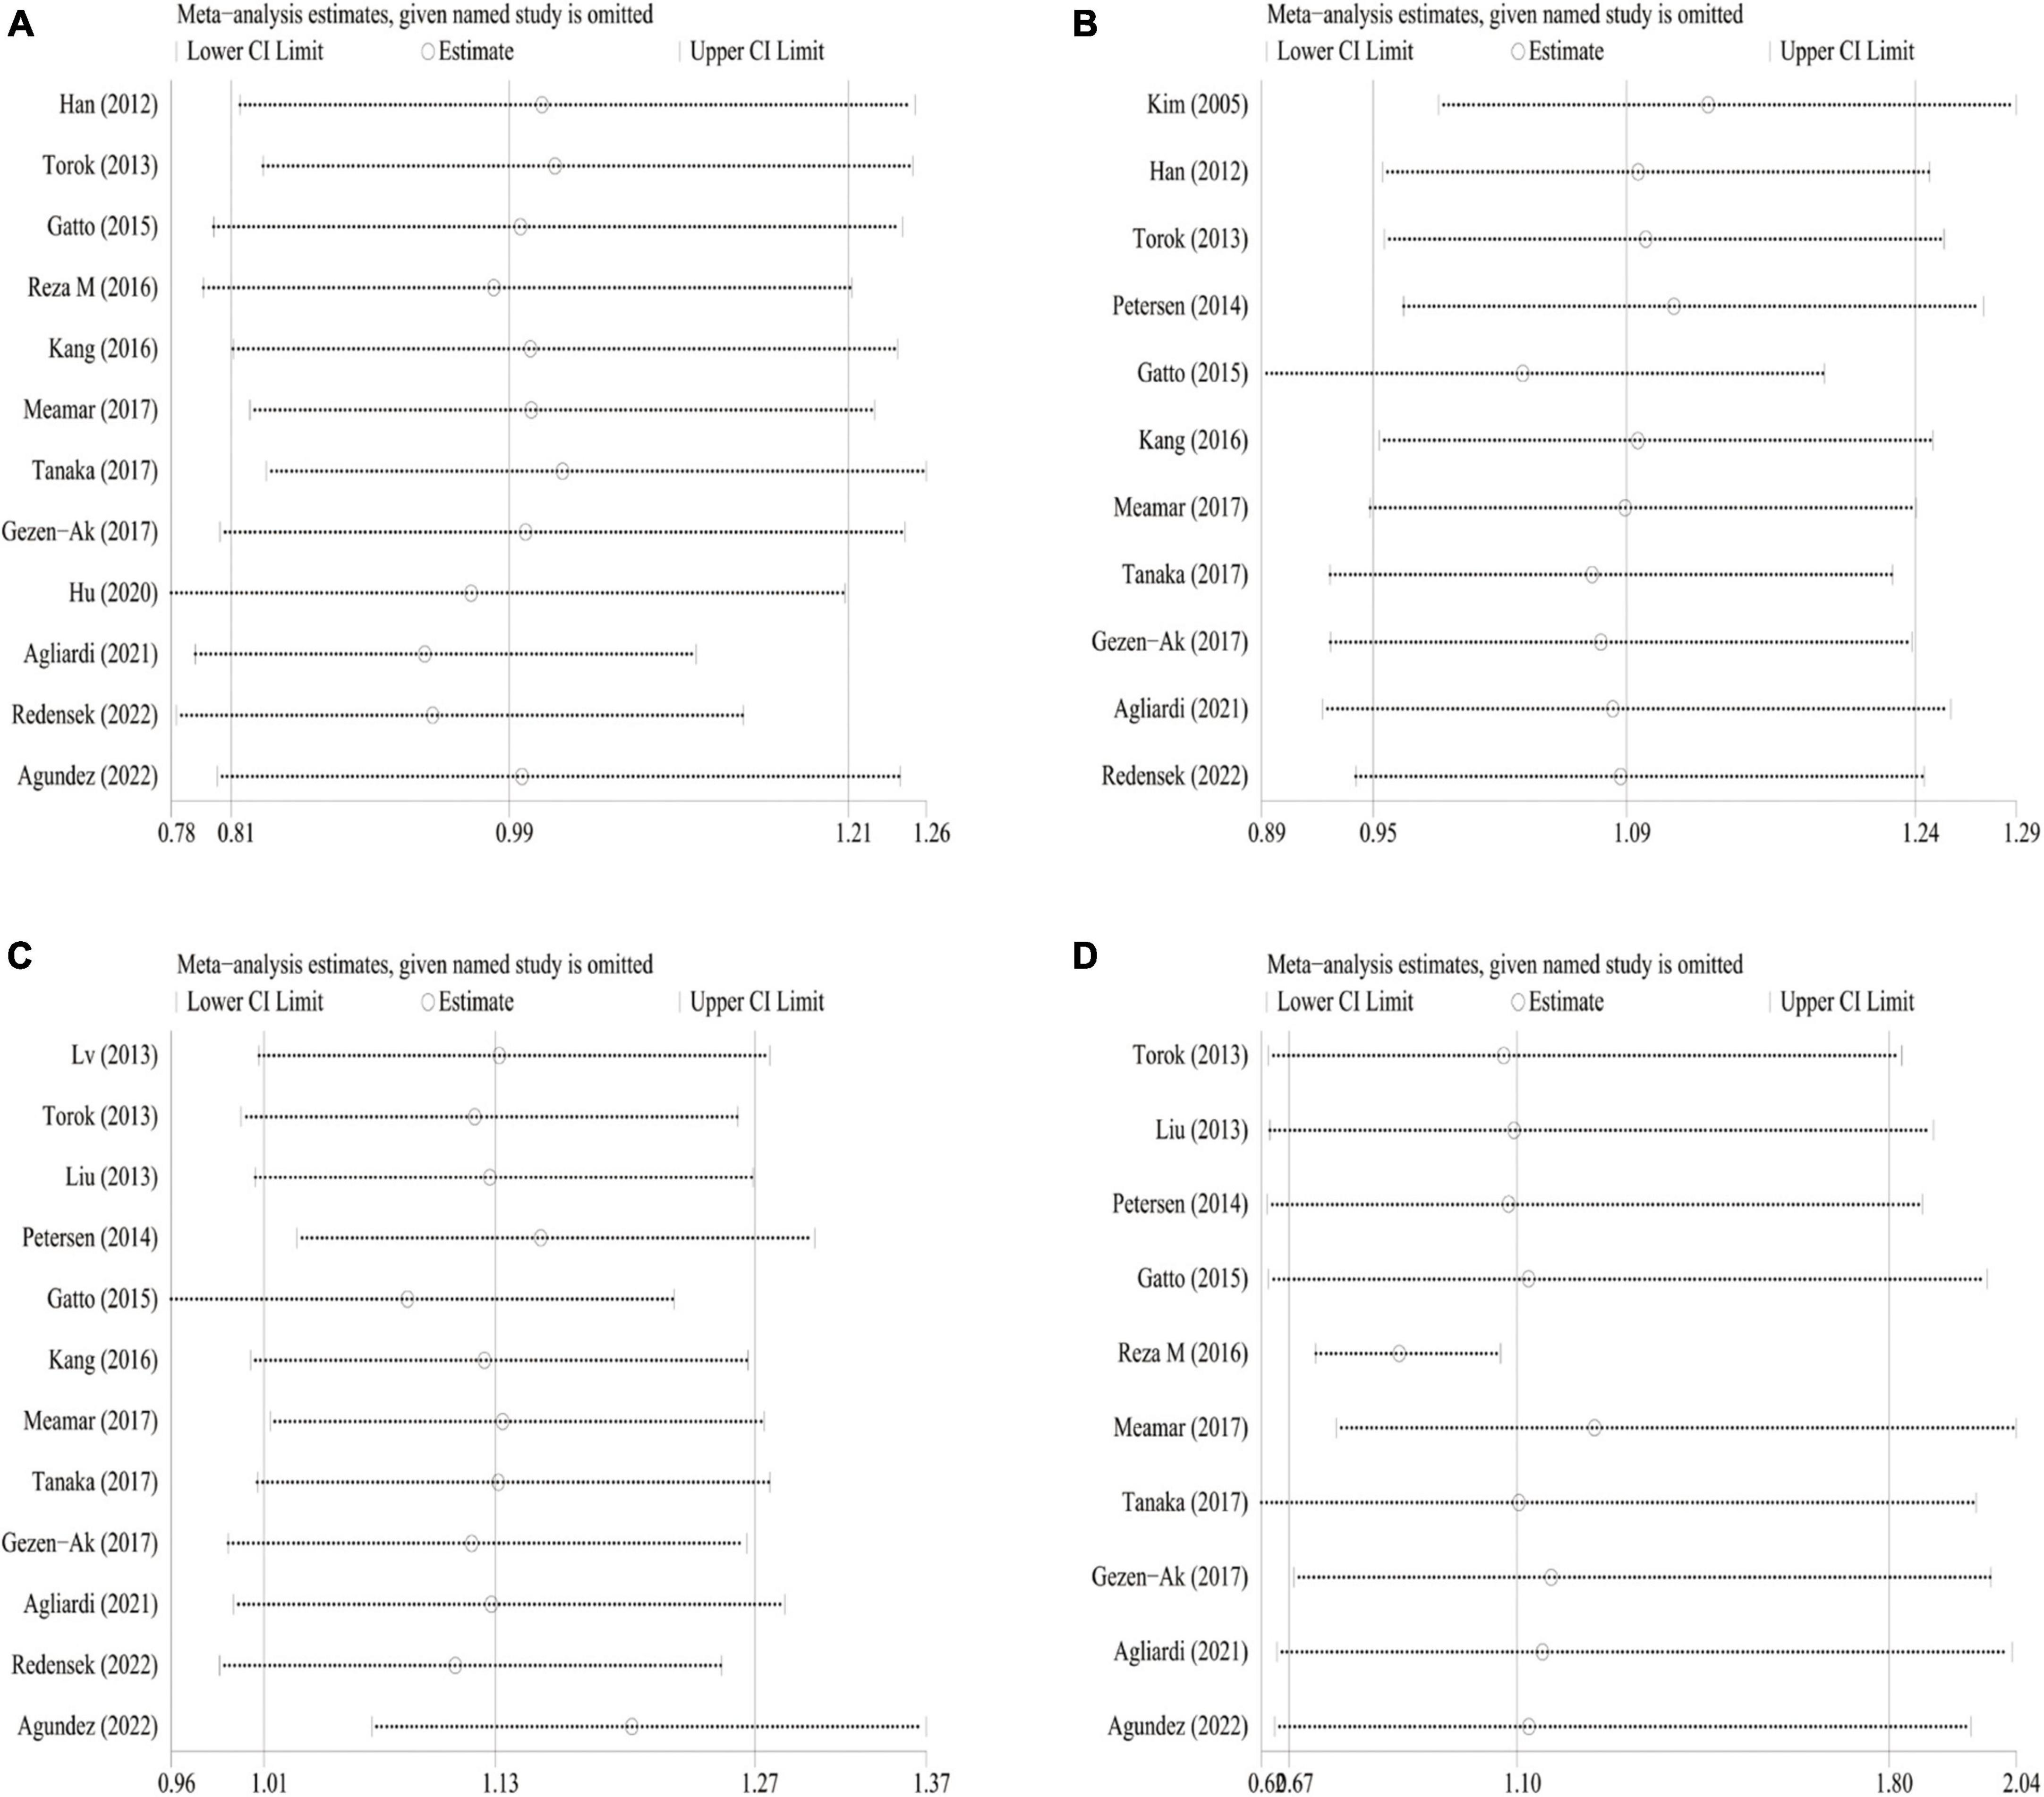
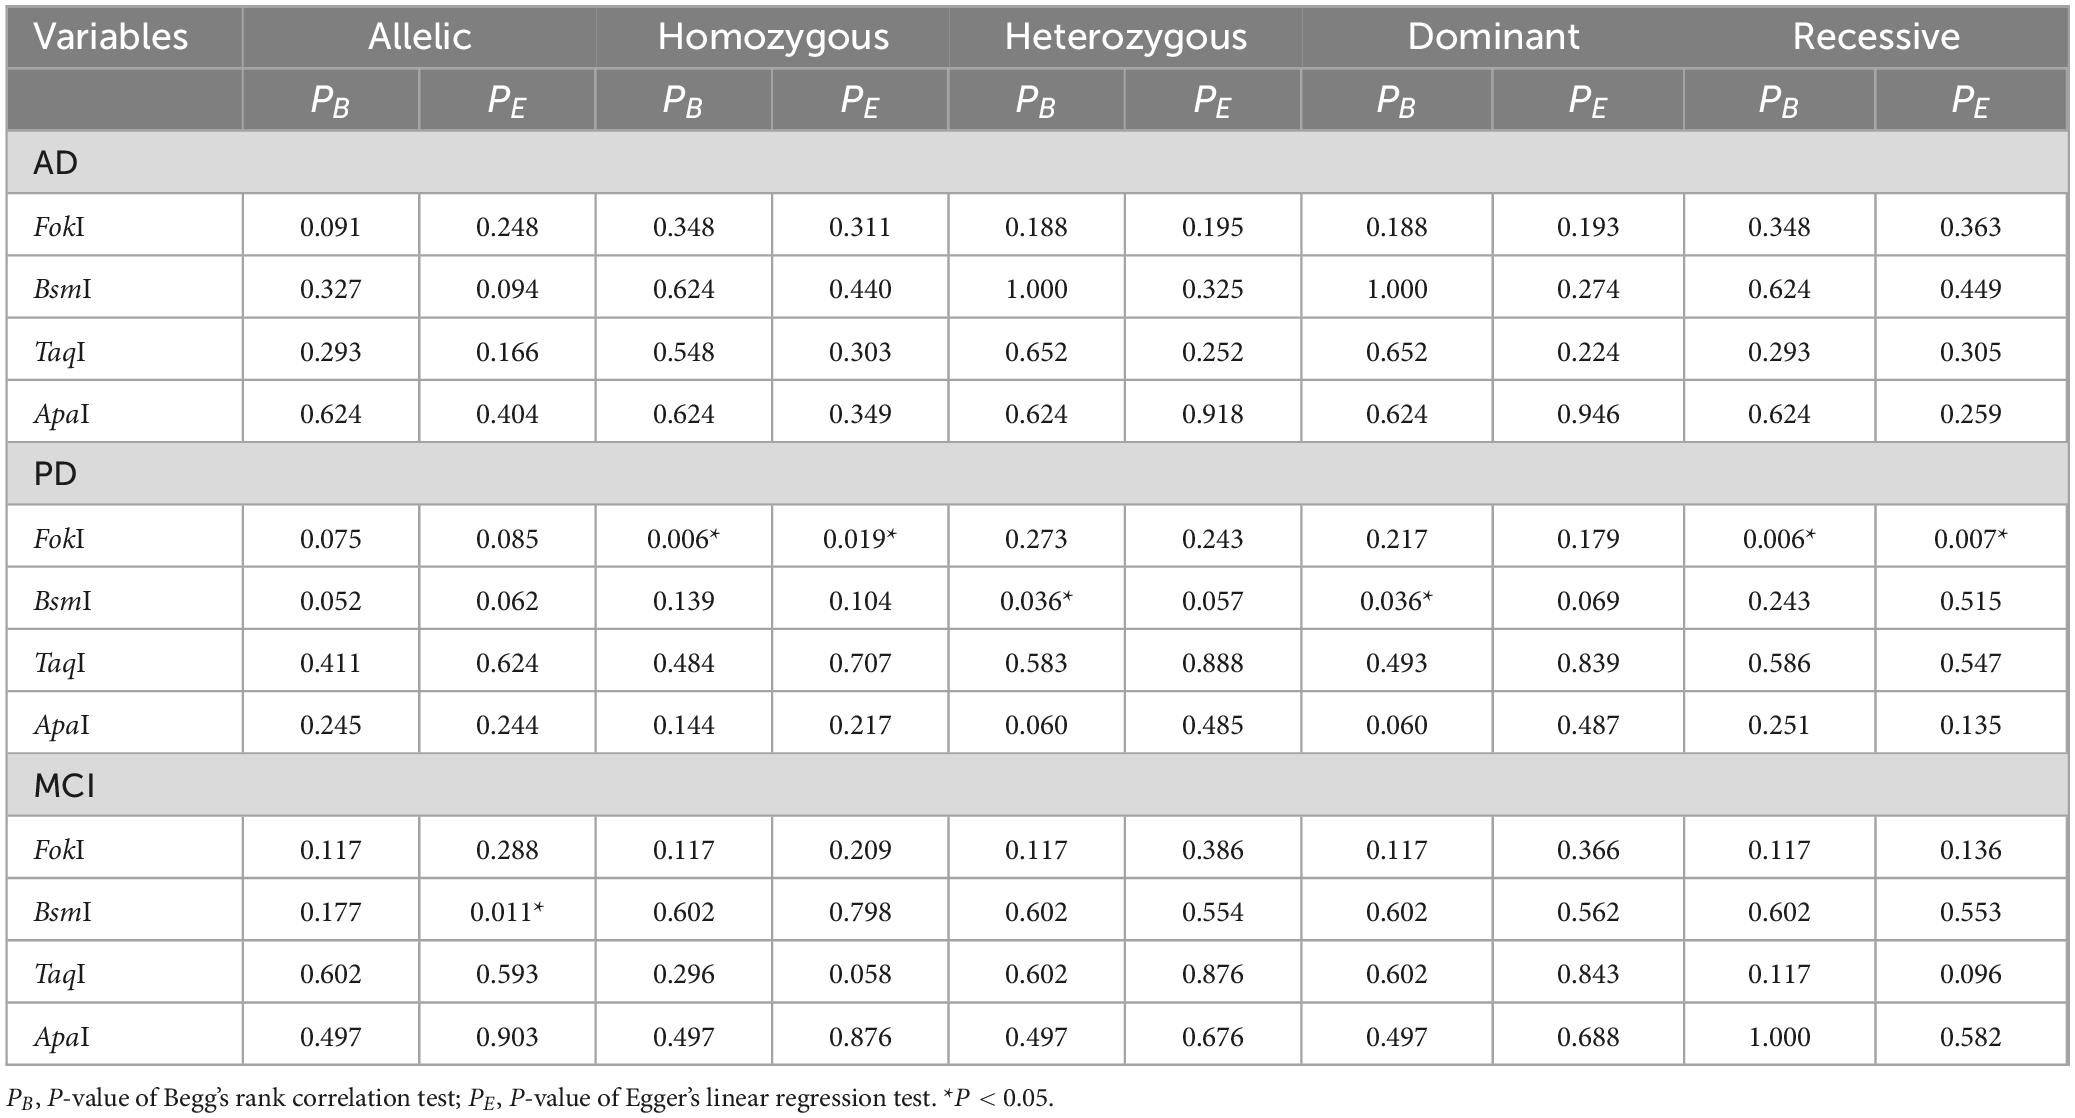
3.6 Sensitivity analysis and publication biasSensitivity analysis was conducted to estimate the effect of the respective study on the pooled ORs. No individual study dramatically influence the combined ORs under any genetic models, indicating that the results were relatively reliable and stable (Figure 6 and Supplementary Figures 9, 10). Funnel plots were found to be symmetrical for all genetic models. Besides, publication bias was evaluated by Begg’s funnel plot analysis (Supplementary Figure 11) and Egger’s test (Figure 7 and Table 7). As shown in Table 7, no statistically significant publication bias was observed for the correlation of four VDR gene polymorphisms with AD and MCI susceptibility. As regards PD risk, Egger’s tests showed no publication bias except for homologous and recessive models of FokI polymorphism (ff vs. FF: PE = 0.019; ff vs. FF/Ff: PE = 0.007).
Figure 6. Sensitivity analysis for VDR gene polymorphism and PD risk in dominant model. (A) FokI polymorphism; (B): BsmI polymorphism; (C) TaqI polymorphism; (D) ApaI polymorphism.
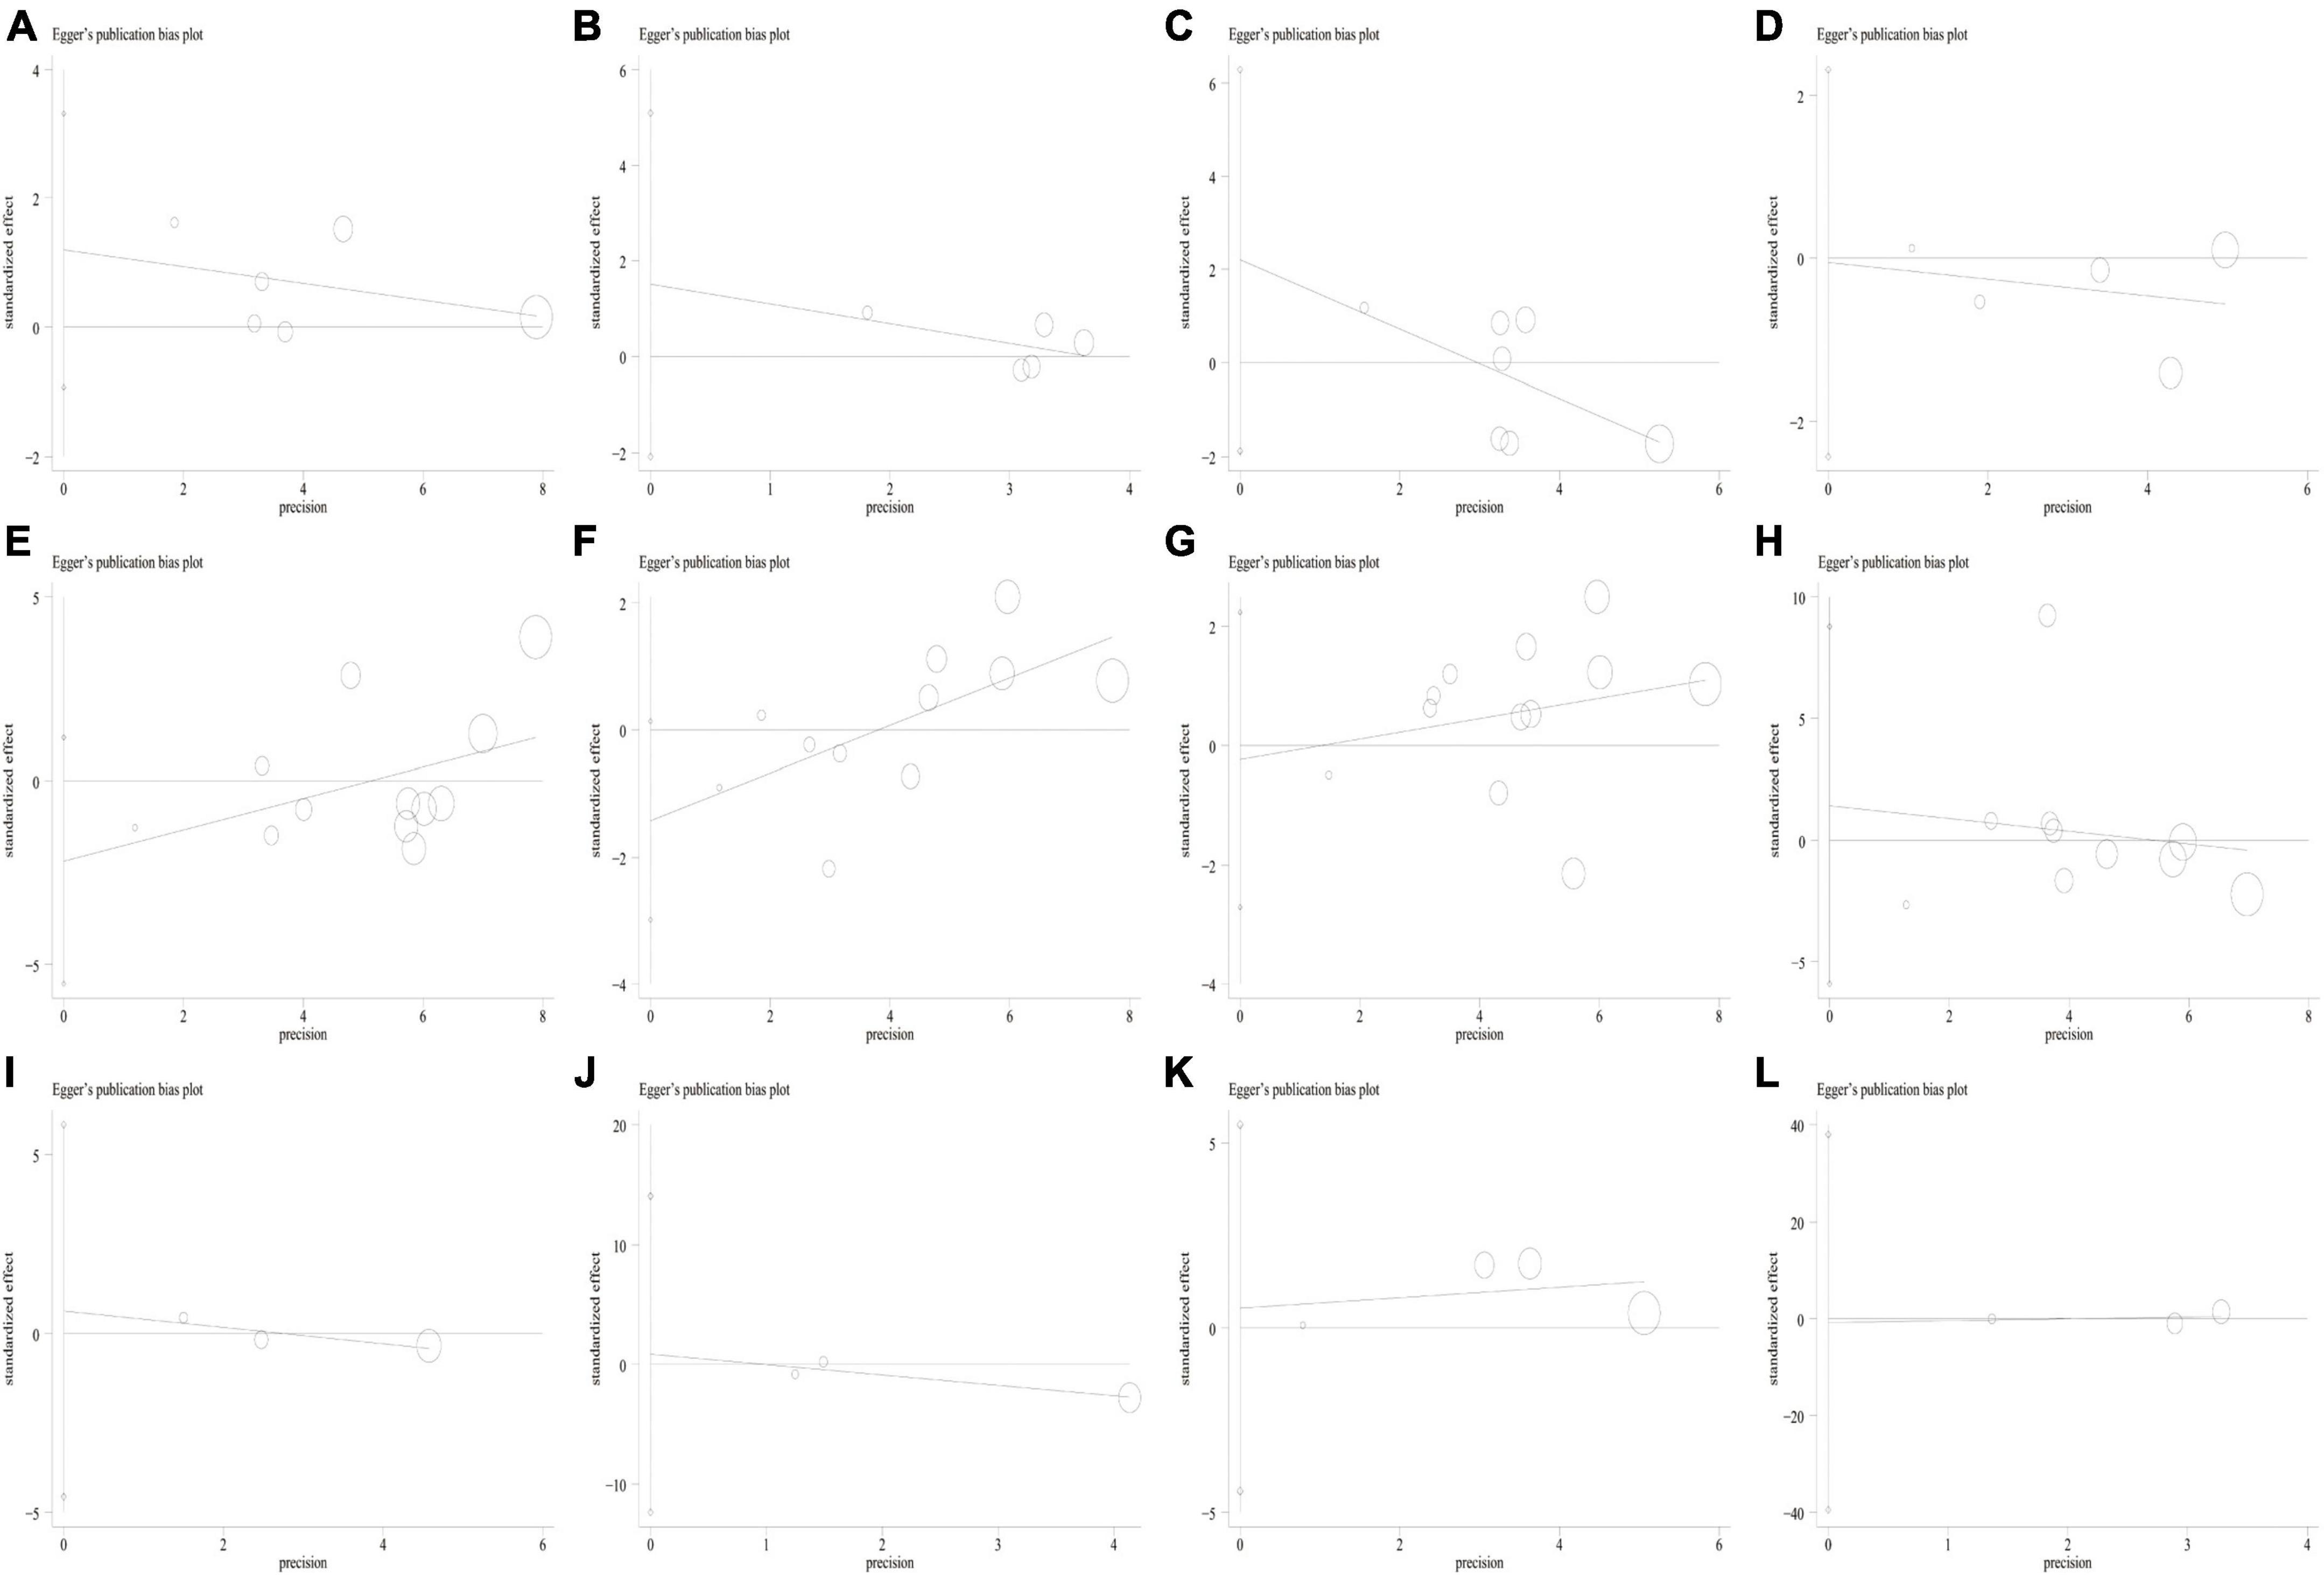
Figure 7. Egger’s linear regression plot for detecting the publication bias in the dominant model of VDR SNPs. (A) FokI polymorphism and AD risk; (B) BsmI polymorphism and AD risk; (C) TaqI polymorphism and AD risk; (D) ApaI polymorphism and AD risk; (E) FokI polymorphism and PD risk; (F) BsmI polymorphism and PD risk; (G) TaqI polymorphism and PD risk; (H) ApaI polymorphism and PD risk; (I) FokI polymorphism and MCI risk; (J) BsmI polymorphism and MCI risk; (K) TaqI polymorphism and MCI risk; (L) ApaI polymorphism and MCI risk.
Table 7. Publication bias of the five genetic models for multiple VDR SNPs in AD, MCI, and PD.
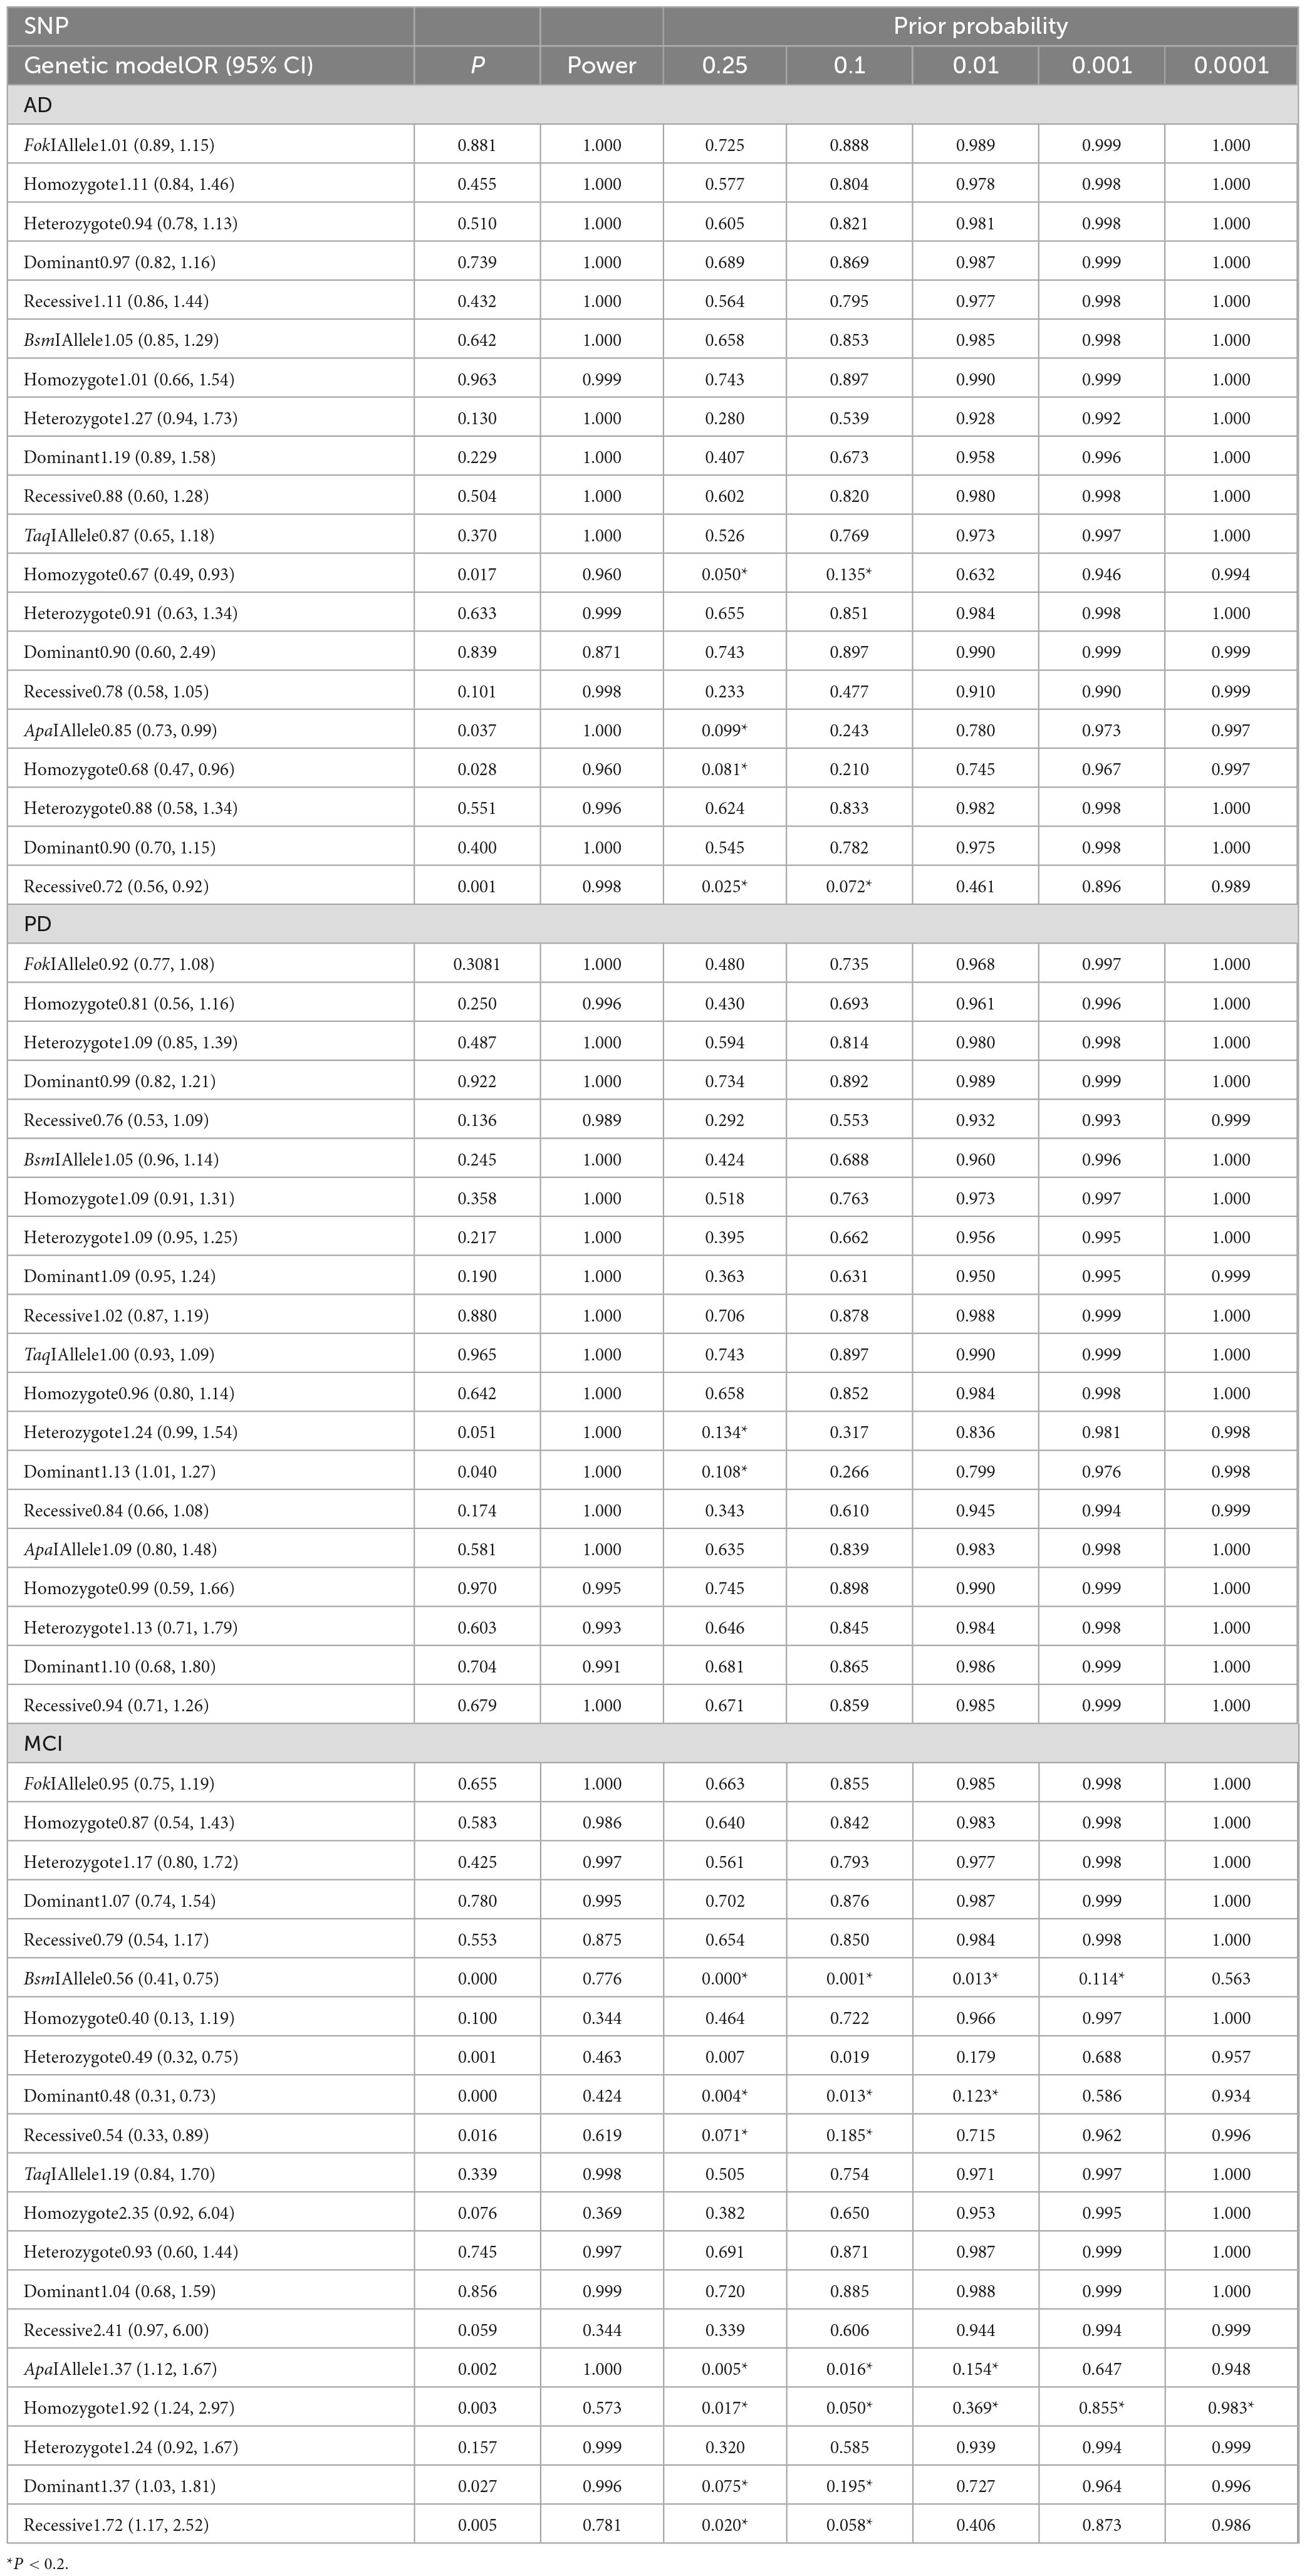
3.7 FPRP resultsWe explored determinants of FPRP across a range of probabilities to determine whether a given association of VDR SNPs with AD, PD, and MCI risk is deserving of attention or is noteworthy. In this respect, we detected that our main results were further supported by FPRP analysis. As shown in Table 8, with a prior probability <0.20, VDR TaqI and ApaI polymorphisms were significantly associated with the risk of AD. Similarly, with a prior probability of 0.20, the heterozygote and dominant models of the TaqI polymorphism was evidently related to PD risk. In addition, with a prior probability of 0.20, the BsmI and ApaI polymorphisms were notably correlated with MCI risk (P < 0.2).
Table 8. False-positive report probability analysis of the noteworthy results.
4 DiscussionVitamin D is an essential fat-soluble hormone that can be synthesized by skin synthesis through exposure to sunlight or dietary intake. It is involved in calcium homeostasis, cellular apoptosis, proliferation, differentiation, immunoregulation, and neuron protection (de Viragh et al., 1989; Garcion et al., 2002; Fernandes de Abreu et al., 2009). Besides, it is implicated in the brain function, exerting an important role in neuronal damage and neuroprotection (Cekic et al., 2009). Accumulative evidence has shown that vitamin D deficiency significantly attenuated the affinity of VDR to vitamin D, influenced the development, maintenance, and survival of neurons, and impaired other treatment of traumatic brain injury, resulting in neurodegeneration, neuronal aging and damage, which predicts a high risk of neurodegenerative diseases (Valdivielso and Fernandez, 2006; Vinh Quôc Luong and Thi Hoàng Nguyên, 2012). Mechanistically, vitamin D could upregulate the expression of microtubule-associated protein-2 (MAP2), growth-associated protein-43 (GAP43) and synapsin-1, induce Ca2+-binding protein synthesis in the cortex and hippocampus, and avoid calcium excitotoxicity, leading to clearance of brain Aβ, antioxidant and anti-inflammatory process (Taniura et al., 2006; Schlögl and Holick, 2014; Assmann et al., 2015; Landel et al., 2016). It has been reported that patients with AD, PD, and MCI have lower serum vitamin D level than age-matched control subjects, and its level was related to the severity of symptom (Sleeman et al., 2017; Larsson et al., 2018).
As a member of the nuclear steroid hormone receptor superfamily, VDR exerts a pivotal function in various biological processes (Weyts et al., 2004). VDR gene is located on the chromosome 12q13 with 2 promoter regions and 14 exons spanning approximately 75 kb (Gardiner et al., 2004; Marshall et al., 2012; Nurminen et al., 2018). It is widely expressed in the hypothalamus and in the dopaminergic neurons of substantia nigra (Eyles et al., 2005). Upon binding to the active form 1,25(OH)2D3, VDR is activated and interacts with vitamin D responsive elements in the promoters of vitamin D target genes to modulate their expression, increasing the translational efficiency (Mohri et al., 2009; Pan et al., 2009). Genetic variability in VDR could potentially affect vitamin D function and change affinity of the receptor, resulting in serious defects of receptor activation (Cai et al., 1993; Bouillon et al., 1998). Recent studies found that mice knockout VDR had muscular and locomotor impairments, but preserved the cognitive function (Burne et al., 2005). The VDR gene was prominently downregulated in the development of AD, PD, and MCI, and its expression is negatively related to the progression of these diseases (Gatto et al., 2016). It has been proposed that the expression level of VDR mRNA could be considered as a potential blood biomarker for these diseases (Scherzer et al., 2007; Wang et al., 2020).
It is generally accepted that different VDR polymorphisms have potential impact on VDR expression and vitamin D levels. Studies indicated that the FokI CC genotype carriers require a notably lower dose of 1,25-dihydroxyvitamin D3 than the CT genotype carriers by 50% (Colin et al., 2000). Similarly, the FokI C-allele carriers possessed higher capacity for intestinal calcium absorption, leading to higher vitamin D levels (Arai et al., 1997; Uitterlinden et al., 2004). A previous study demonstrated that the TaqI and ApaI polymorphisms were not correlated with AD risk in populations with a high sun exposure in view of the higher endogenous vitamin D production, rendering the VDR activity less dependent to its amount (Łaczmański et al., 2015). Moreover, the TaqI polymorphism did not cause any statistically significant difference in the serum vitamin D levels nor was it related to an enhanced risk of developing AD (Oliveira et al., 2018). It has been reported that the TaqI TT genotype had a 1.8-fold higher likelihood of developing AD, and the potential reason may be attributed to insufficient vitamin D effects associated with the TT genotype, resulting in lower VDR affinity and VDR mRNA expression levels (Dimitrakis et al., 2022b).
A total of 30 articles covering 81 studies were included in this meta-analysis to investigate possible genetic relationships between VDR SNPs and the risk of AD, PD, and MCI. Of these studies, 10 studies were involved in AD risk, 16 studies in PD risk, and 5 studies in MCI risk, respectively. Our findings confirmed an association of TaqI polymorphism and AD risk among Caucasians, and a negative relationship between ApaI polymorphism and AD risk in the allelic, homozygous and recessive models. Except for the dominant model of TaqI, we did not find any remarkable correlations between other three VDR gene polymorphisms and PD risk. Subsequently, the results indicated that VDR BsmI polymorphism was significantly linked with decreased MCI risk in Asian population, while the ApaI polymorphism was closely associated with elevated MCI risk in Caucasians and Asians. As for the MCI risk, the BsmI variant might confer a protective factor in the Asian population, but the ApaI variant served as a hazard factor among Caucasians and Asians. In addition to possible genetic heterogeneity between different ethnicity, the result difference could be explained by difficulties in measuring serum vitamin D status and determining the actual age at onset of disease.
Although VDR gene polymorphisms are a determinant of the VitD status, they act together on other genetic and environmental factors that are affected by sun exposure and diet. Genetic factors could mediate the influence of environmental factors on VDR regulation (Saccone et al., 2015). It is hypothesized that VDR gene polymorphisms takes part in the regulation of VDR activity, and the response to vitamin D supplementation varies widely between individuals (Barger-Lux et al., 1995; Arai et al., 1997). Usategui-Martín et al. demonstrated that the TaqI and FokI variants were associated with a better response to vitamin D supplementation (Usategui-Martín et al., 2022). The FokI variation exhibited a stronger impact on the response to 25(OH)D or bioavailable 25(OH)D than non-genetic factors, including body mass index, and sex (Yao et al., 2017). A randomized control study suggested that vitamin D3 supplementation could slow the progression of PD in patients with the FokI CT and TT genotypes (Suzuki et al., 2013). The TT genotype was also found to be associated with cognitive decline in PD (Gao et al., 2020), and with PD risk (Hu et al., 2020; Agliardi et al., 2021). Importantly, understanding the genotypes of patients in advance can compensate for lower VDR availability with vitamin D supplementation to prevent the development of neurological diseases (Fan et al., 2020).
As described in previous studies, vitamin D deficiency was more common in female participants (Keeney and Butterfield, 2015; Yeşil et al., 2015). Recent studies have shown that the clinical manifestations of late-onset AD mostly occur at postmenopausal ages, and low estrogen levels are conducive to the development of the disease (Dimitrakis et al., 2022a). Due to VDR SNPs, low vitamin D levels or the poor utilization of vitamin D in postmenopausal women increased the risk of developing AD (Kinuta et al., 2000). It has been proposed that vitamin D plays a crucial role in estradiol synthesis (Enjuanes et al., 2003). Functionally, the neuroprotective effects of estrogens in neural cells against amyloid β-induced neurotoxicity are based on amyloid degradation or other molecular mechanisms (Yagyu et al., 2002; Marin et al., 2003; Quintanilla et al., 2005; Amtul et al., 2010). A cohort study indicated female patients with poor cognitive performance is associated with insufficient levels of VitD, whereas no such association was observed in male patients (Arévalo et al., 2021). The possible hypothesis is that body fat in women is greater than in men, and in this way circulating vitamin D can be stored in adipose tissue and, given its lipophilic characteristics, would be less available in plasma (Oliveira et al., 2018).
There are some potential mechanisms that different VDR locus mediate the effects on diseases. VDR FokI polymorphism located in exon 2 at the 5′ coding region have no linkage disequilibrium with other VDR SNPs (Gross et al., 1998). It has been found that the F-allele changes the first start codon later than the f-allele, generating a three-amino-acids shorter protein form with efficient transcription activity. However, difference in length may bring about the altered VDR function. BsmI, ApaI (intron 8), and TaqI (exon 9) are located near 3′-untranslated region (3′-UTR) and then affect the expression, structure, and stability of VDR mRNA without alteration of the amino acid sequence (Ingles et al., 1997; Bretherton-Watt et al., 2001). Although the probability that these three sites directly affected VDR function is relatively low, they may be in linkage disequilibrium with genetic variability in another adjacent gene. This might influence VDR expression by altering the stability of VDR mRNA or interfering with different splicing regulatory elements (Morrison et al., 1994; Jehan et al., 1996). It has been found that the ApaI was in linkage disequilibrium with a poly-A repeat of the 3′-UTR and disturbed the stability of VDR mRNA, thereby affecting the cognitive function (Zmuda et al., 2000). Additionally, some underlying genes, such as CYP27A1 and CYP27B1, could affect the function of BsmI, ApaI, and TaqI (Cheng et al., 2004; Uitterlinden et al., 2004). The ApaI genotype was found to affects the mRNA expression of target gene, including P-gp, LRP1, and RAGE, facilitating brain Aß aggregation (Arévalo et al., 2021). The Apa1 and Taq1 polymorphisms have potential interaction with interleukin-10 (IL-10) SNP, suggesting that the candidate gene may have superimposed effects with the Apa1 or Taq1 in the AD progression (Lehmann et al., 2011).
There were several inherent limitations in the present study. Firstly, the number of individual studies and sample for certain VDR SNPs were relatively low, which may restrict the statistical power and decrease the reliability of the results. Secondly, some confounding factors, including gender, serum vitamin D concentration, vitamin D supplementation, calcium intake, and time exposed to sunlight may also influence the risk of AD, PD, and MCI. The results based on unadjusted estimates for raw insufficient data might suffer from potential confounding bias. Thirdly, all the studies mainly focused on the Asian and Caucasian population, limiting the general application of the results in other populations. Lastly, different studies included in our meta-analysis used different genotyping methods for polymorphism detection. These different genotyping methods have varying sensitivity, which may potentially impact the results to a minor extent.
5 ConclusionIn conclusion, our results indicated that VDR TaqI and ApaI polymorphisms were correlated with decreased susceptibility to AD, while no significant relationship of FokI, and BsmI polymorphisms with AD risk in overall analyses. Moreover, the dominant model of TaqI was slightly associated with PD risk. The BsmI polymorphism notably decreased the MCI risk, but the ApaI A-allele variant significantly enhanced the MCI risk. To further elucidate the findings, studies with a better design and larger sample size are needed in the future.
Data availability statementThe datasets presented in this study can be found in the article/Supplementary material.
Author contributionsYD: Data curation, Investigation, Visualization, Writing – original draft. PG: Conceptualization, Data curation, Software, Visualization, Writing – original draft. QC: Methodology, Software, Validation, Writing – original draft. LH: Formal analysis, Investigation, Visualization, Writing – original draft. LL: Data curation, Software, Writing – original draft. MY: Investigation, Methodology, Software, Writing – original draft. MT: Formal analysis, Visualization, Writing – review & editing. JM: Formal analysis, Visualization, Writing – review & editing. XS: Conceptualization, Supervision, Writing – original draft. LF: Conceptualization, Project administration, Supervision, Writing – review & editing.
FundingThe author(s) declare that no financial support was received for the research, authorship, and/or publication of this article.
AcknowledgmentsThe authors are grateful to the researchers who participated in data collection.
Conflict of interestThe authors declare that the research was conducted in the absence of any commercial or financial relationships that could be construed as a potential conflict of interest.
Publisher’s noteAll claims expressed in this article are solely those of the authors and do not necessarily represent those of their affiliated organizations, or those of the publisher, the editors and the reviewers. Any product that may be evaluated in this article, or claim that may be made by its manufacturer, is not guaranteed or endorsed by the publisher.
Supplementary materialThe Supplementary Material for this article can be found online at: https://www.frontiersin.org/articles/10.3389/fnagi.2024.1377058/full#supplementary-material
Supplementary Figure 1 | Forest plots for the association between VDR FokI polymorphism and AD risk in five models. (A) Allele model; (B) dominant model; (C) heterozygote model; (D) homozygote model; (E) recessive model.
Supplementary Figure 2 | Forest plots for the association between VDR BsmI polymorphism and AD risk in five models. (A) Allele model; (B) homozygote model; (C) heterozygote model; (D) dominant model; (E) recessive model.
Supplementary Figure 3 | Forest plots for the association between VDR TaqI polymorphism and AD risk in five models. (A) Allele model; (B) homozygote model; (C) heterozygote model; (D) dominant model; (E) recessive model.
Supplementary Figure 4 | Forest plots for the association between VDR FokI polymorphism and PD risk in five models. (A) Allele model; (B) homozygote model; (C) heterozygote model; (D) dominant model; (E) recessive model.
Supplementary Figure 5 | Forest plots for the association between VDR ApaI polymorphism and PD risk in five models. (A) Allele model; (B) homozygote model; (C) heterozygote model; (D) dominant model; (E) recessive model.
Supplementary Figure 6 | Forest plots for the association between VDR FokI polymorphism and MCI risk in five models. (A) Allele model; (B) homozygote model; (C) heterozygote model; (D) dominant model; (E) recessive model.
Supplementary Figure 7 | Forest plots for the association between VDR BsmI polymorphism and MCI risk in five models. (A) Allele model; (B) homozygote model; (C) heterozygote model; (D) dominant model; (E) recessive model.
Supplementary Figure 8 | Forest plots for the association between VDR ApaI polymorphism and MCI risk in five models. (A) Allele model; (B) homozygote model; (C) heterozygote model; (D) dominant model; (E) recessive model.
Supplementary Figure 9 | Sensitivity analysis for VDR gene polymorphism and AD risk in dominant model. (A) FokI polymorphism; (B) BsmI polymorphism; (C) TaqI polymorphism; (D) ApaI polymorphism.
Supplementary Figure 10 | Sensitivity analysis for VDR gene polymorphism and MCI risk in dominant model. (A) FokI polymorphism; (B) BsmI polymorphism; (C) TaqI polymorphism; (D) ApaI polymorphism.
Supplementary Figure 11 | Begg’s funnel plot for detecting the publication bias in the dominant model of VDR SNPs. (A) FokI polymorphism and AD risk; (B) BsmI polymorphism and AD risk; (C) TaqI polymorphism and AD risk; (D) ApaI polymorphism and AD risk; (E) FokI polymorphism and PD risk; (F) BsmI polymorphism and PD risk; (G) TaqI polymorphism and PD risk; (H) ApaI polymorphism and PD risk; (I) FokI polymorphism and MCI risk; (J) BsmI polymorphism and MCI risk; (K) TaqI polymorphism and MCI risk; (L) ApaI polymorphism and MCI risk.
Supplementary Table 1 | Newcastle-Ottawa Scale for VDR gen polymorphisms in the AD, PD, and MCI.
AbbreviationsAD, Alzheimer’s disease; PD, Parkinson’s disease; MCI, mild cognitive impairment; VDR, vitamin D receptor; SNP, single nucleotide polymorphism; CI, confidence interval; HWE, Hardy–Weinberg equilibrium; NOS, Newcastle Ottawa Scale; OR, odds ratio.
ReferencesAgliardi, C., Guerini, F. R., Zanzottera, M., Bolognesi, E., Meloni, M., Riboldazzi, G., et al. (2021). The VDR FokI (rs2228570) polymorphism is involved in Parkinson’s disease. J. Neurol Sci. 428:117606. doi: 10.1016/j.jns.2021.117606
PubMed Abstract | Crossref Full Text | Google Scholar
Agúndez, J. A. G., García-Martín, E., Alonso-Navarro, H., Rodríguez, C., íez-Fairén, M. D., Pastor, P., et al. (2022). Vitamin D receptor and binding protein gene variants in patients with essential tremor. Mol. Neurobiol. 59, 3458–3466. doi: 10.1007/s12035-022-02804-8
PubMed Abstract | Crossref Full Text | Google Scholar
Amtul, Z., Wang, L., Westaway, D., and Rozmahel, R. F. (2010). Neuroprotective mechanism conferred by 17beta-estradiol on the biochemical basis of Alzheimer’s disease. Neuroscience 169, 781–786.
Arai, H., Miyamoto, K., Taketani, Y., Yamamoto, H., Iemori, Y., Morita, K., et al. (1997). A vitamin D receptor gene polymorphism in the translation initiation codon: Effect on protein activity and relation to bone mineral density in Japanese women. J. Bone Miner. Res. 12, 915–921. doi: 10.1359/jbmr.1997.12.6.915
PubMed Abstract | Crossref Full Text | Google Scholar
Arévalo, N. B., Castillo-Godoy, D. P., Espinoza-Fuenzalida, I., Rogers, N. K., Farias, G., Delgado, C., et al. (2021). Association of Vitamin D receptor polymorphisms with amyloid-β transporters expression and risk of mild cognitive impairment in a chilean cohort. J. Alzheimers Dis. 82, S283–S297. doi: 10.3233/jad-201031
PubMed Abstract | Crossref Full Text | Google Scholar
Assmann, K. E., Touvier, M., Andreeva, V. A., Deschasaux, M., Constans, T., Hercberg, S., et al. (2015). Midlife plasma vitamin D concentrations and performance in different cognitive domains assessed 13 years later. Br. J. Nutr. 113, 1628–1637. doi: 10.1017/s0007114515001051
PubMed Abstract | Crossref Full Text | Google Scholar
Barger-Lux, M. J., Heaney, R. P., Hayes, J., DeLuca, H. F., Johnson, M. L., and Gong, G. (1995). Vitamin D receptor gene polymorphism, bone mass, body size, and vitamin D receptor density. Calcif. Tissue Int. 57, 161–162. doi: 10.1007/bf00298438
留言 (0)