
記住我


Alzheimer's disease (AD), mainly accompanied by progressive, irreversible cognitive decline, is considered the main cause of dementia (Scheltens et al., 2021). Mild cognitive impairment (MCI) is the intermediate state between normal aging and AD, mainly accompanied by memory impairment (Anderson, 2019). It is reported that AD is a disconnection syndrome (Delbeuck et al., 2003), and abnormal brain networks in MCI and AD have been proven to be associated with cognitive decline (Celone et al., 2006; Yao et al., 2010), indicating that the application of network-based methods is of significance for understanding the mechanisms of MCI and AD.
The perfusion-based functional network plays an important role in characterizing the synchronous changes of perfusion in different regions and promotes signal transmission between regions (Melie-Garcia et al., 2013; Zhu et al., 2013). The cerebral blood flow (CBF) based network is commonly constructed for functional connectivity by providing associations between non-independent regions and their properties of interregional covariation, which can be obtained by calculating the Pearson correlation coefficient (Melie-Garcia et al., 2013). It has been proven that CBF correlation networks are related to metabolic and vascular information (Luciw et al., 2021). Importantly, group-level correlation analysis is necessary for CBF networks and the stable relationship of inter-regional CBF across subjects can be captured (Melie-Garcia et al., 2013; Zhu et al., 2015). A previous study demonstrated that the episodic memory decline in MCI is associated with the alteration of the global modularity in CBF-based networks constructed with single-photon emission computed tomography (SPECT) data (Sanchez-Catasus et al., 2018). However, there are some limitations in SPECT, such as the non-repeatable examinations caused by invasive radioactive tracers, low spatial resolution, and high time consumption.
To avoid that, arterial spin-labeling (ASL) magnetic resonance imaging (MRI), with the advantages of rapid imaging and lower costs, could be applied as a strategy for measuring arterial blood flow as an endogenous tracer to assess tissue perfusion and vitality (Detre et al., 1994). Much evidence has proved that ASL MRI has a strong correlation with the functional changes related to AD and some neurodegenerative diseases (Alsop et al., 2010; Wolk and Detre, 2012). Several studies have shown that the progression of MCI and AD can be estimated by the regional CBF values with a three-dimensional pseudo-continuous ASL (3D PCASL) (Binnewijzend et al., 2013, 2016; Suzuki et al., 2023), a widely recognized technique with high labeling efficiency, repeatability, and temporal and spatial signal-to-noise ratio (Alsop et al., 2015; Dolui et al., 2017), whereas the topological properties of CBF-based networks among CN, MCI, and AD have not been estimated in earlier studies. To follow the progression of MCI and AD, we applied the 3D PCASL to detect the disrupted CBF correlation networks in MCI and AD. Graph theory was used to characterize the topologies by exploring the regional and global properties, and significant differences (p < 0.05) were obtained by comparing the results between each two groups. Finally, a z-statistic was calculated to obtain the significantly altered connections with the false discovery rate (FDR) correction.
2 Materials and methods 2.1 3D PCASL data from ADNIThe 3D PCASL data for this study were acquired from the Alzheimer's Disease Neuroimaging Initiative (ADNI) database (adni.loni.usc.edu). ADNI was launched in 2003 as a public–private partnership, led by Principal Investigator Michael W. Weiner, MD. The primary goal of ADNI has been to test whether serial MRI, positron emission tomography (PET), other biological markers, and clinical and neuropsychological assessments can be combined to measure the progression of MCI and early AD. For up-to-date information (see www.adni-info.org).
Each subject is assigned a unique identification number. CN subjects have a Memory Box score of 0, a Clinical Dementia Rating (CDR) of 0, and a Mini-Mental Status Exam (MMSE) score between 24 and 30. Participants with memory loss and who have a Memory Box score of at least 0.5, a CDR score of 0.5, and an MMSE score between 24 and 30 are diagnosed as having MCI. Subjects diagnosed with AD have a CDR of 0.5 or 1.0 and a MMSE score between 20 and 24 following the National Institute of Neurological and Communicative Disorders and Stroke-Alzheimer's Disease and Related Disorders Association (NINCDS/ADRDA). Detailed inclusion and exclusion criteria can be found at https://adni.loni.usc.edu/wp-content/themes/freshnews-dev-v2/documents/clinical/.
2.2 Clinical assessmentAll subjects from ADNI completed a comprehensive neuropsychological assessment based on standardized tests. Measures associated with cognitive domains include MMSE, Montreal Cognitive Assessment (MoCA), and Alzheimer's Disease Assessment Scale-Cognitive (ADAS13). The demographic and clinical information was statistically analyzed by using MATLAB, one-way analysis of variance (ANOVA), and post hoc tests were applied to compare variables (age, education level, MMSE, MoCA, and ADAS13) among three groups. Chi-squared test was used to determine if there is any significant relationship between sex (male/female) and subjects with CN, MCI, and AD.
2.3 Image acquisitionBoth high-resolution structural MRI data and resting PCASL data were downloaded for 53 CN subjects, 43 MCI subjects, and 30 AD subjects. The structural images were acquired using an accelerated sagittal inversion recovery fast spoiled gradient recall (IR-FSPGR) T1-weighted sequence with the following parameters: repetition time (TR)/echo time (TE)/inversion time (TI) = 7.39/3.06/400 ms, 196 sagittal slices, slice thickness = 1.0 mm, within the plane field of view (FOV) =256 × 256 × 196 mm3, voxel size = 1 × 1 × 1 mm3.
3D PCASL data (label/control images) were acquired by a 3.0 T MRI scanner (Discovery MR 750, GE Medical Systems) with background suppression and no vascular suppression. The acquisition parameters were as follows: TR/TE = 4,888/10.5 ms, TI = 2,025 ms, post labeling delay (PLD) = 2,000 ms, slice thickness = 4.0 mm, FOV = 24 × 24 cm2, weighting = proton density (PD).
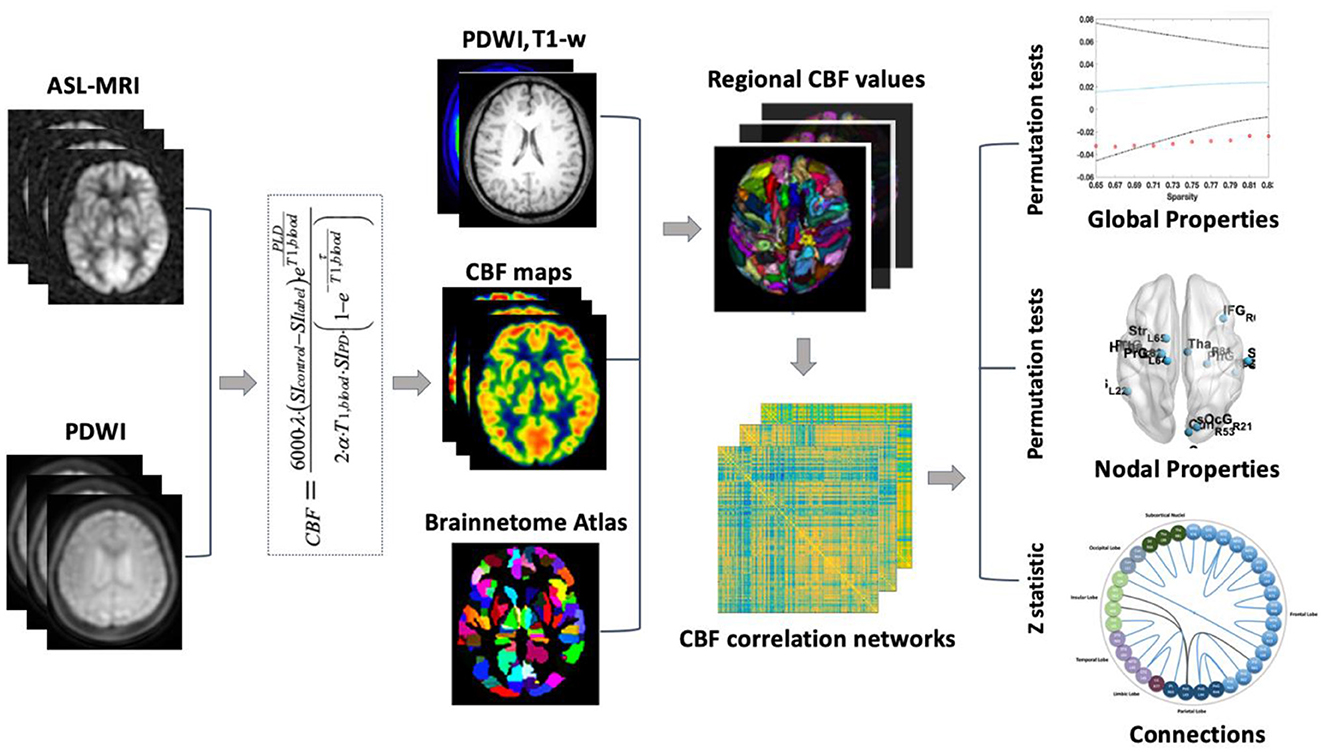
2.4 Overview of CBF correlation network analysisThe processing steps of CBF correlation network analysis by using the 3D PCASL MRI are shown in Figure 1. First, the 3D PCASL MRI and PDWI were applied to calculate the CBF map (see “2.5 CBF maps Calculation”). Second, the Brainnetome Atlas (Fan et al., 2016) was registered from MNI space to individual space with T1 and proton density-weighted images (PDWI). Thus the CBF map was divided into 246 regions in gray matter. Third, the Pearson coefficient between regional CBF values at the group level was calculated for the construction of the correlation networks (see “2.6 Network Construction”). Finally, the changes in global properties (see “2.7 Global Properties Analysis”), hub regions (see “2.8 Hub regions in CBF correlation networks”), and nodal property (see “2.9 Nodal Property Analysis”), as well as altered connections were analyzed (see “2.10 Connection Analysis”).
Figure 1. Study procedure of CBF correlation network analysis.
2.5 Calculation of CBF mapsThe data of 3D PCASL (label/control images) and PDWI were converted into the 4D.nii.gz in NIFTI from DICOM format by using the tools of dcm2nii (https://www.nitrc.org/projects/dcm2nii). Then they were processed by FSL (https://fsl.fmrib.ox.ac.uk/fsl/fslwiki/) with motion correction and brain tissue extraction to benefit the following processing and analysis.
CBF=6000·λ·(SIcontrol-SIlabel)·ePLDT1,blood2·α·T1,blood·SIPD·(1-e-τT1,blood)The above formula was applied to calculate CBF in the whole brain. The scan parameters are as follows: T1 of blood is assumed to be 1.4 s, the factor τ represents the label duration which is 1.5 s, λ is the brain/blood partition coefficient whose value is 0.9 (ml/g), PLD is the time of post-labeling delay and is set to 2.025 s, α is the labeling efficiency factor with a value of 0.8.
2.6 Network constructionGray matter brain regions were obtained from CBF maps by using the FSL tools. Each subject's PDWI image was first registered to T1 data linearly, and a matrix with mutual information was obtained, with linear and non-linear methods. We normalized T1 data to MNI space. Next, the co-registered PDWI image in structure space was warped by the transform field normalized from T1 to MNI. Then, the Brainnetome Atlas in MNI space was registered to individual PCASL and PDWI space through the results we obtained in the last step (Yuan et al., 2017). Thus 246 regions in each subject were obtained with the individual atlas and whole brain CBF maps.
To construct the CBF connectivity network, three CBF data matrices for CN (53 × 246), MCI (43 × 246), and AD (30 × 246) were prepared, in which rows represent the number of subjects and columns represent the number of brain regions, and Pearson's correlation index between each two brain regions across subjects was calculated and three CBF connectivity networks were constructed. Then the CBF connectivity networks after normalization were calculated at different sparsity from 0.65 to 0.83 with the step size 0.02.
2.7 Analysis of global propertiesTo analyze the global properties of the CBF connectivity network, we calculated the global network efficiency, clustering coefficient, characteristic path length, and small-world properties. The global efficiency is the average inverse shortest path length in the network and is inversely related to the characteristic path length. The clustering coefficient is the fraction of triangles around a node and is equivalent to the fraction of the node's neighbors that are neighbors of each other. The small-world properties are related to the normalized average clustering coefficient and the average shortest path length. When the small-world coefficient value is >1, we consider it to have the small-world property.
We applied the non-parametric permutation approach (1,000 permutations) to compare the global network properties between every two groups. In each permutation, regional CBF values were randomly reassigned and the number of subjects in each randomized group was the same as that in the original group with CN (53 × 246), MCI (43 × 246), and AD (30 × 246), and the correlation connectivity network was constructed for each randomized group. We obtained the global parameters of randomized matrices at a range of sparsity 0.65–0.83 with step size 0.02 in each group with correlation connectivity networks constructed by each randomized group. Finally, the difference in the global network parameters of original networks was compared to that of randomized networks (null distributions) and the relative positions of difference as nonparametric p-values were obtained, in which parameters with p-values under 0.05 were considered to be significant.
2.8 Hub regions in CBF correlation networksThe MATLAB-based Brain Connectivity Toolbox (BCT) for complex brain network analysis (Rubinov and Sporns, 2010) was applied to analyze the properties of the CBF connectivity network in CN, MCI, and AD groups.
We identified the hub regions with node measure betweenness centrality (BC) and the fraction of all shortest network paths containing a given node, which is applied most widely in characterizing the importance of nodes in a network (Freeman, 1977). In the current study, nodes with BC two times higher than the mean value of all the nodes were defined as hub regions. Hub regions in the CN group were first detected, and then the corresponding BC values of regions in MCI and AD groups were calculated.
2.9 Nodal property analysisTo detect the changes in nodal properties of the CBF connectivity network among CN, MCI, and AD groups, the non-parametric permutation approach (1,000 permutations) was applied. With the same method described in the global properties analysis, we constructed the original and randomized correlation networks, and then BC values of nodes in original and randomized matrices at a sparsity of 0.83 in each group were obtained. Finally, the difference of BC values of nodes in the original networks was compared to that of randomized networks (null distributions), and the relative positions of difference as non-parametric p-values were obtained, nodes with significant differences were identified with p-values below 0.05.
2.10 Analysis of connectionsSignificant differences in the connections of CBF connectivity networks with a sparsity of 0.83 between every two groups (CN vs. MCI, CN vs. AD, and MCI vs. AD) were tested. z-values were obtained from the correlation coefficients with Fisher's z-transformation. Then a z-statistic was obtained, and connections with significantly different values survived with false discovery rate (FDR) correction (p < 0.001).
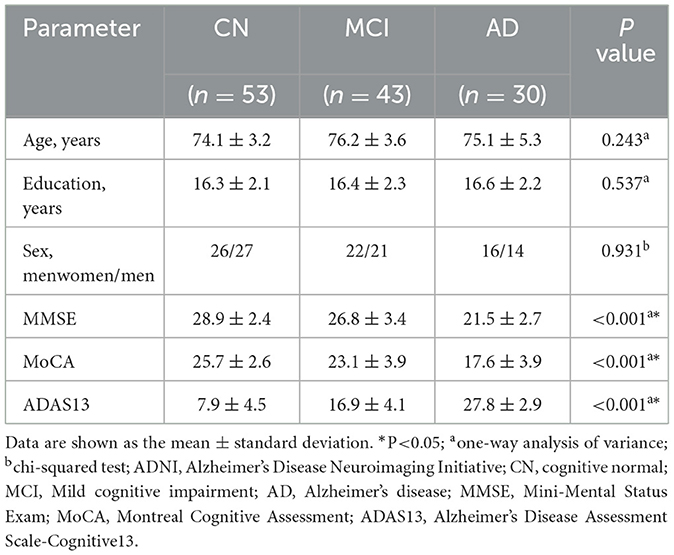
3 Results 3.1 Demographic and clinical characteristics of ADNI subjectsThe demographic and clinical characteristics of subjects from ADNI are shown in Table 1. Significant differences (p < 0.001) were found among CN, MCI, and AD in MMSE, MoCA, and ADAS13. No significant difference was found among the three groups in terms of age, sex, and education level.
Table 1. Demographic and clinical characteristics of ADNI subjects.
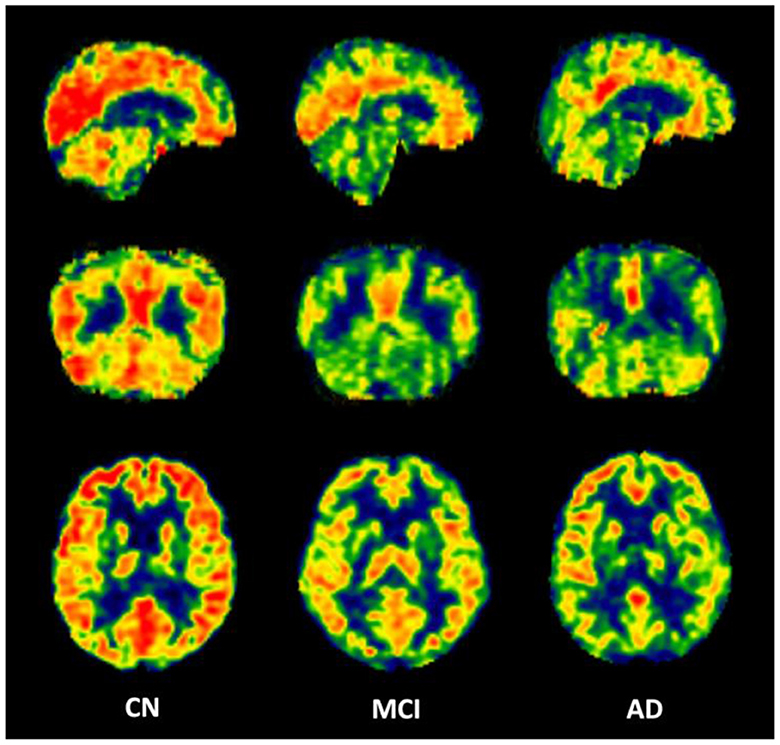
3.2 Calculated CBF maps and regional CBF valuesThe calculated whole brain CBF maps of CN, MCI, and AD are shown in Figure 2. After the registration of the Brainnetome Atlas to CBF maps in individual space, 246 regional CBF values in gray matter were obtained. Regional CBF with significant differences among CN, MCI, and AD were statistically analyzed with double t-tests and FDR correction (p < 0.05). Compared with CN, nine regions decreased significantly in MCI, mainly distributed in the frontal gyrus, middle temporal gyrus, parahippocampal gyrus, parietal lobe, and occipital lobe. Compared with CN and MCI, nine regions with significant differences were found in AD, they are mainly in the frontal gyrus, temporal gyrus, parahippocampal gyrus (e.g., entorhinal cortex), and hippocampus. Figure 3 shows the spatial location of the regions mentioned above, and the regional values with significant differences are listed in Supplementary Table 1.
Figure 2. Representative CBF maps from CN, MCI, and AD groups.
Figure 3. The spatial locations of regions with significant differences in CBF values among CN, MCI, and AD groups.
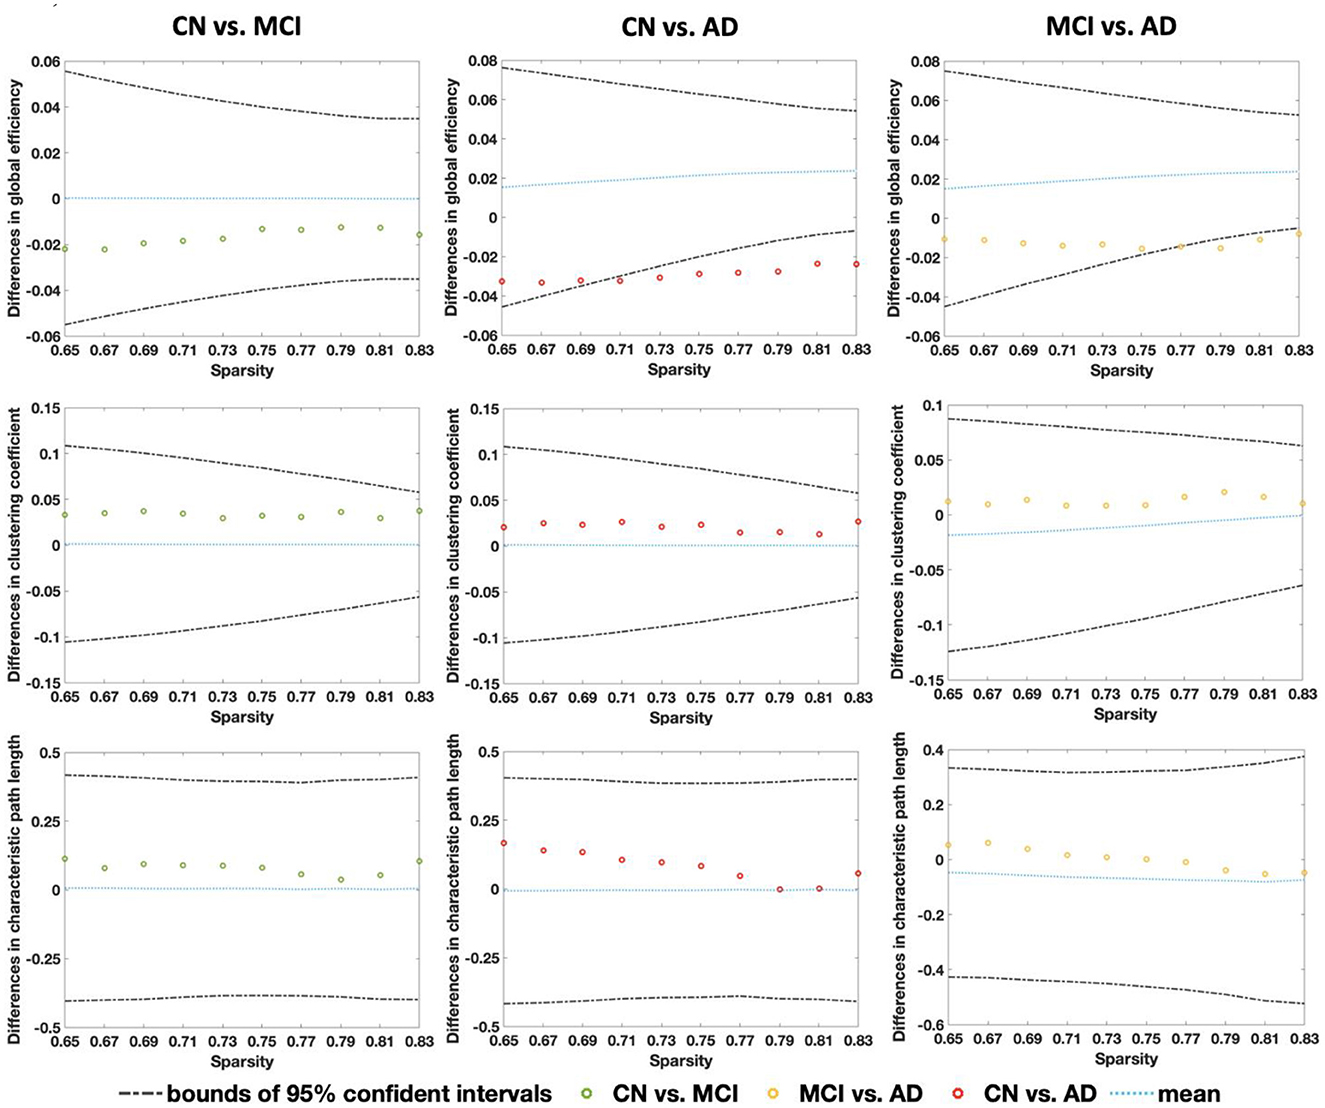
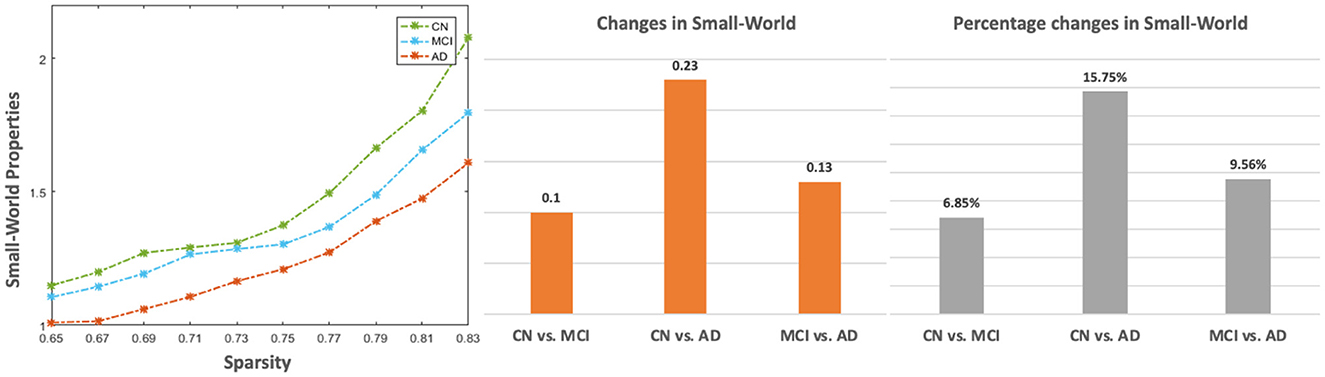
3.3 Global properties of CBF correlation networksFrom Figure 4, global efficiency shows a significant decrease in the AD group compared with the CN group under the sparsity of 0.71 (p = 0.031), 0.73 (p = 0.016), 0.75 (p = 0.009), 0.77 (p = 0.002), 0.79 (p = 0.002), 0.81 (p < 0.001), and 0.83 (p < 0.001). A significant decrease was also found from a comparison between MCI and AD at the sparsity of 0.77 (p = 0.027), 0.79 (p = 0.018), 0.81 (p = 0.003). No significant changes were found among the CN, MCI, and AD for clustering coefficient and characteristic path length. Figure 5 shows that all three groups exhibit small-world topologies across the sparsity from 0.65 to 0.83, and the intermediate state of MCI is shown between CN and AD in the small-world properties across all the sparsity values. From the bar plot in Figure 5, we found that, compared with CN, the mean small-world value of all sparsity in MCI decreased by 0.1 (6.85%), and that in AD decreased by 0.23 (15.75%). Meanwhile, the mean small-world value in AD decreased by 0.13 (9.56%) compared with MCI.
Figure 4. Relative differences in global properties of CBF correlation networks (global efficiency, clustering coefficient, and characteristic path length) between CN-MCI, CN-AD, and MCI-AD across the sparsity from 0.65 to 0.83. The non-parametric permutation tests (1,000 permutations) were conducted showing the results of the mean value (blue lines) and 95% confidence intervals (dashed lines).
Figure 5. The small-world properties of the CBF correlation network in CN, MCI, and AD groups. The left sub-figure is the small-world values across the sparsity from 0.65 to 0.83. The two sub-figures on the right are absolute and percentage changes in mean small-world by averaging across all sparsity levels among CN, MCI, and AD, respectively.
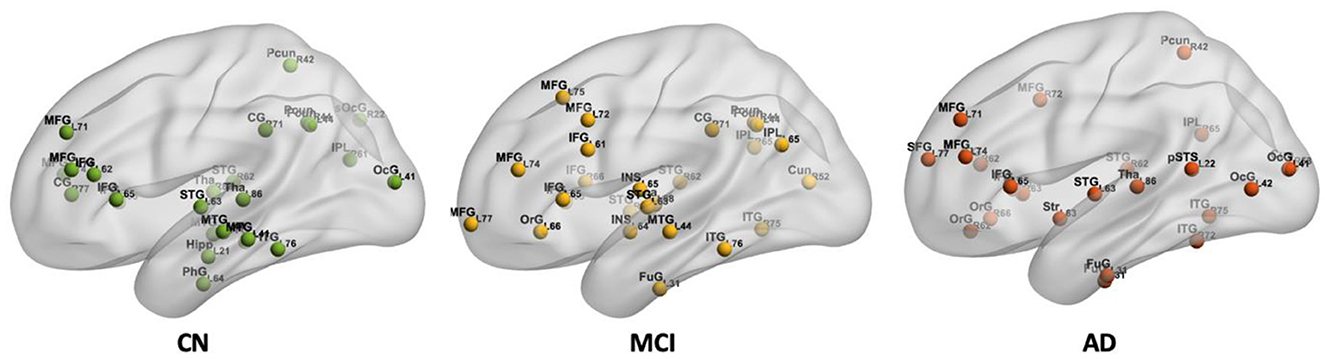
3.4 Hub regions in CBF correlation networksHub regions in the CN, MCI, and AD are shown in Figure 6. Twenty-five hub regions were identified in CN, while the number of hub regions is 25 in MCI and 24 in AD. Hub regions were identified in three groups distributed in the inferior and middle frontal gyrus, orbital gyrus, inferior and superior temporal gyrus, precuneus, and occipital gyrus. The identified hub regions are listed in Supplementary Table 2.
Figure 6. The spatial locations of hub regions in CN, MCI, and AD.
In addition, the middle temporal gyrus, inferior parietal lobule, and cingulate gyrus including cingulate gyrus (CG)_R_7_1 (i.e., posterior cingulate cortex, PCC) were found as hub regions in CN and MCI but disappeared in AD. Identical hub regions such as parahippocampal gyrus (PhG)_L_6_4 (i.e., entorhinal cortex), and hippocampus (Hipp)_L_2_1 were also found only in CN. For both MCI and AD groups, hub regions were found in the insular gyrus and cuneus. Additionally, hub regions in the striatum and posterior superior temporal sulcus were also observed.
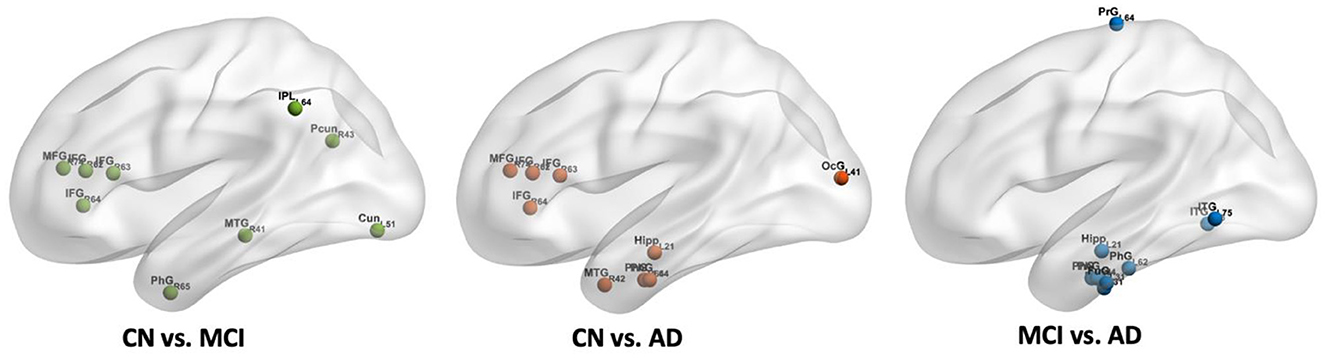
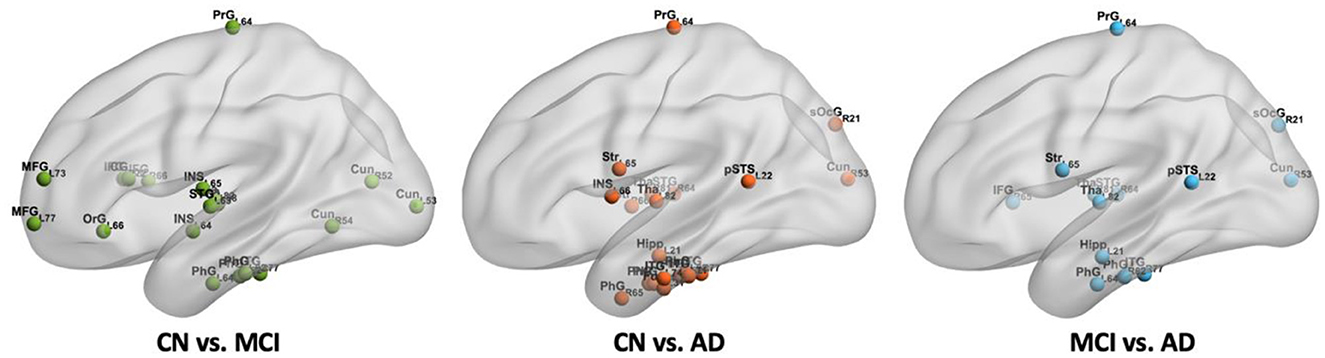
3.5 Altered nodal property in CBF correlation networksFrom Figure 7, we found that 18 regions with significantly different BC values in the CBF correlation networks between CN and MCI groups, including the inferior frontal gyrus, middle frontal gyrus, dorsal anterior insula, inferior temporal gyrus, orbital gyrus, cuneus, parahippocampal gyrus, superior temporal gyrus, and thalamus. Between CN and AD groups, 20 regions were detected with significant differences. They were distributed in the parahippocampal gyrus, cuneus, caudoventral anterior insula, inferior temporal gyrus, superior temporal gyrus, striatum, thalamus, fusiform gyrus, hippocampus, posterior superior temporal sulcus, and superior occipital gyrus. Compared with the MCI group, 13 regions were found to be decreased in the AD group, which include the cuneus, hippocampus, inferior frontal gyrus, inferior temporal gyrus, parahippocampal gyrus, posterior superior temporal sulcus, superior occipital gyrus, superior temporal gyrus, striatum, thalamus, and precentral gyrus. In addition, we found cuneus, inferior temporal gyrus, parahippocampal gyrus, superior temporal gyrus, and thalamus changed significantly between every two groups. Importantly, the significantly changed BC value of PhG_L_6_4 (i.e., entorhinal cortex) was found in MCI and AD. We found that there is no region with significant differences between CN and MCI in the hippocampus, and with progression and the BC value of Hipp_L_2_1 in the hippocampus decreased significantly in AD. We also found that with progression, significantly different regions in the frontal lobe decreased, while some regions in the occipital lobe increased significantly in AD. The regions with significantly different BC values are listed in Supplementary Table 3.
Figure 7. The spatial locations of regions with significant differences in nodal BC value in CBF correlation networks among CN, MCI, and AD groups.
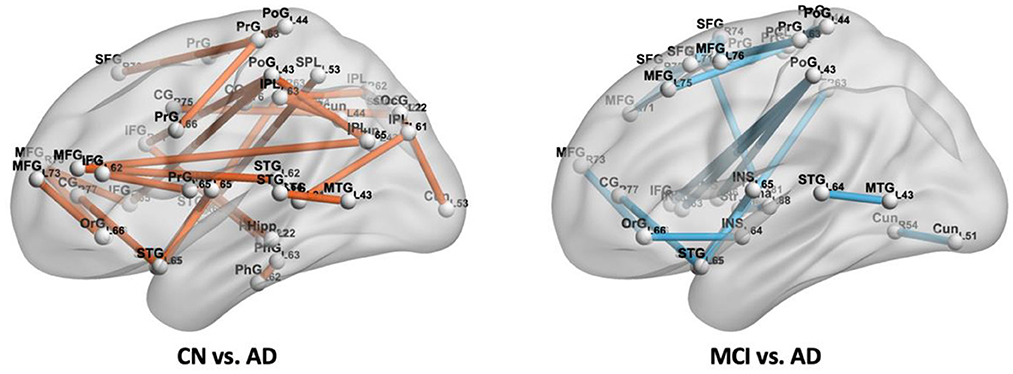
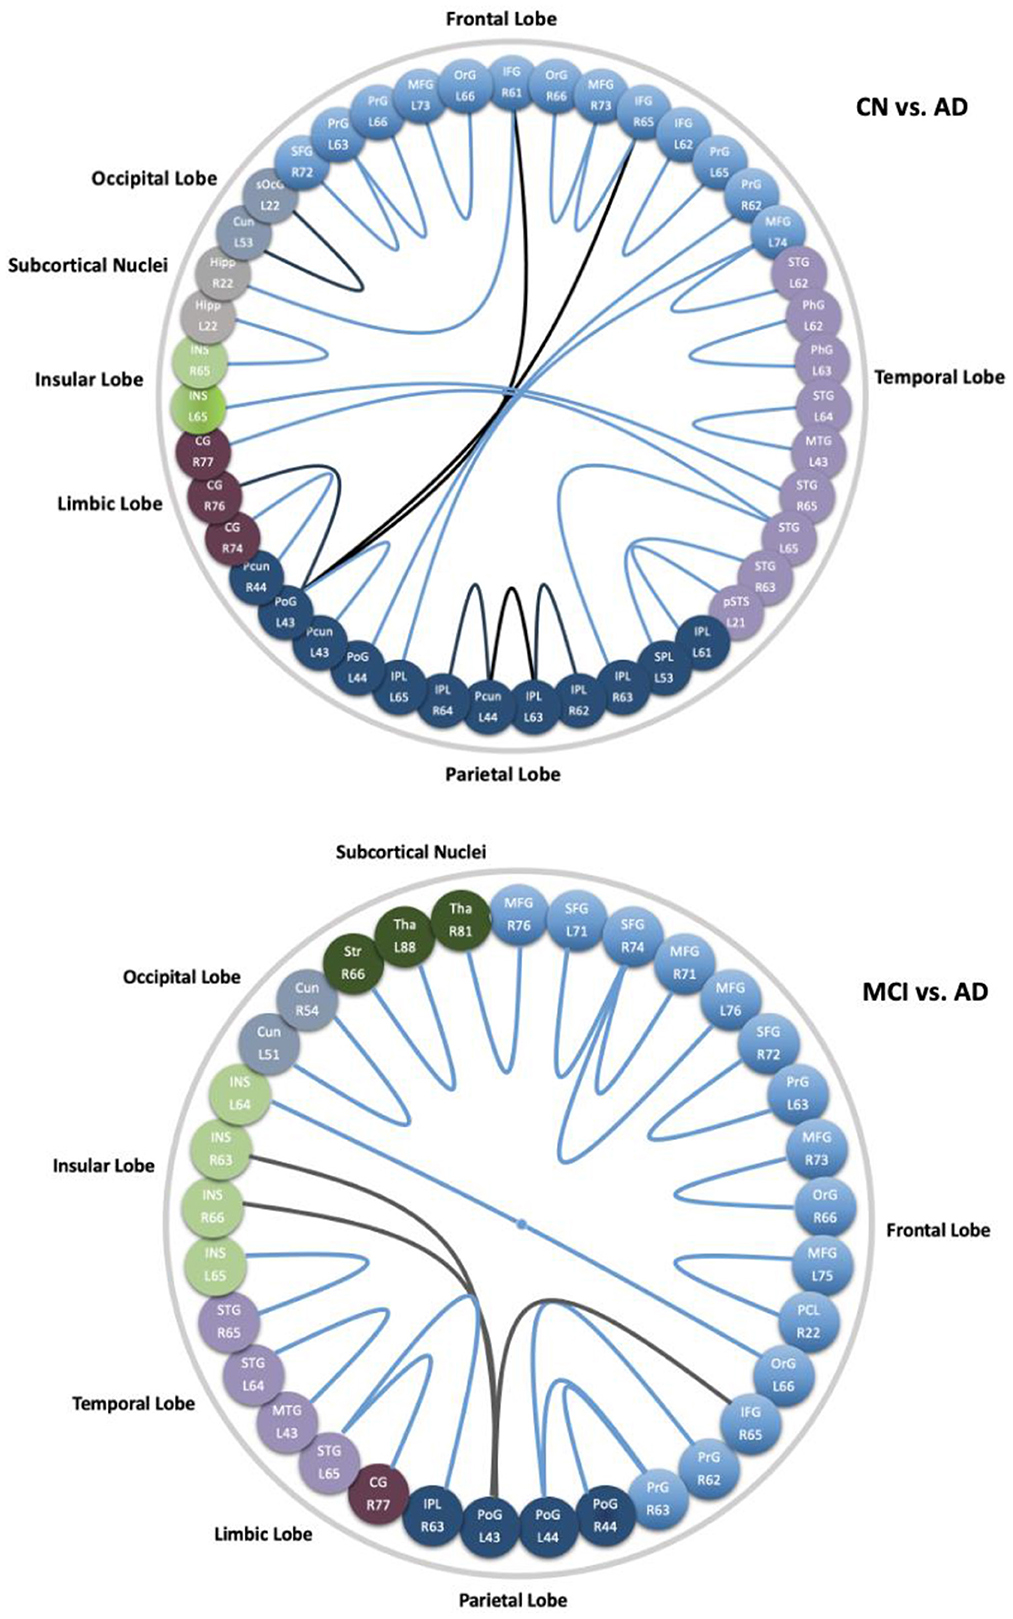
3.6 Altered connections in CBF correlation networksWe did not find a connection with significant differences between CN and MCI. While 27 connections were found with significant differences between CN and AD, they were distributed in the frontal lobe (middle and inferior frontal gyrus, orbital gyrus, precentral gyrus), temporal lobe (superior and middle temporal gyrus, parahippocampal gyrus, posterior superior temporal sulcus), parietal lobe (superior parietal lobule, angular gyrus, supramarginal gyrus, precuneus, postcentral gyrus), insular lobe (rostrodorsal posterior insula), limbic lobe (cingulate gyrus), occipital lobe (cuneus, superior occipital gyrus), and subcortical nuclei (hippocampus), and those spatial distributions mentioned above are shown in Figure 8 (left). From Figure 9 (top), we found most of the connections were significantly decreased, except for seven connections in the frontal, parietal limbic, and occipital lobes were increased. Compared with MCI, we found 20 connections with significant differences in the AD group, which were distributed in the frontal lobe (superior, middle and inferior frontal gyrus, orbital gyrus, precentral gyrus, paracentral lobule), temporal lobe (superior and middle temporal gyrus), parietal lobe (supramarginal gyrus, postcentral gyrus), insular lobe (dorsal anterior insula, ventral posterior insula, rostrodorsal posterior insula, caudoventral anterior insula), limbic lobe (cingulate gyrus), occipital lobe (cuneus), and subcortical nuclei (striatum, thalamus). The spatial distributions of these connections are shown in Figure 8 (right). From Figure 9 (bottom), three edges in the frontal, parietal, and insular lobe increased significantly, and the other edges reduced significantly in AD compared with MCI.
Figure 8. Connections with significant difference (P < 0.001) between CN and AD, MCI and AD.
Figure 9. Subregions and lobes to which the corresponding connections with significant differences of CN vs. AD (top), and MCI vs. AD (bottom). Connections in blue decrease significantly in AD, while the black ones are increased edges in AD.
4 DiscussionWe used a 3D PCASL technique to investigate the altered topological properties of CBF correlation networks in subjects identified as having CN, MCI, and AD. In earlier studies, correlation networks have been detected with different techniques for MCI or AD, including functional networks with SPECT data, fluorodeoxyglucose positron emission tomography (FDG-PET) data, blood oxygen level-dependent (BOLD) MRI, and cortical networks with T1-weighted MRI (Yao et al., 2010; Seo et al., 2013; Dai and He, 2014; Sanchez-Catasus et al., 2018). However, CBF correlation networks were only analyzed in MCI with SPECT (Sanchez-Catasus et al., 2018), where the global efficiency of MCI was found to be reduced compared to the control group. Although FDG-PET, SPECT, and ASL are widely applied to measure cerebral metabolism, ASL has the advantages of rapid imaging, non-invasive, and low costs compared with the others. BOLD and ASL are both commonly used to estimate functional networks calculated by interregional correlation coefficients. Using BOLD, time series were used to examine the connectivity at the individual level, which can reflect temporal synchronization of the inter-regional neural activity (Biswal et al., 1995), while the interregional CBF-related networks are obtained at the group level and cannot be compared between individuals. Moreover, CBF connectivity as a single physiological parameter might be more relevant for characterizing cerebral metabolism, whereas BOLD connectivity is influenced by several parameters including CBF, cerebral blood volume, cerebral metabolic rate of oxygen, and oxygen metabolism (Buxton et al., 2004).
There are five main findings revealed in this study: (1). The CBF correlation networks of CN, MCI, and AD showed small-world properties. (2). Compared with CN, global efficiency showed a significant decrease in AD. (3). A loss of hub regions in the middle temporal lobe was found in MCI and AD. (4). Significant differences in the nodal properties of BC are observed in both MCI and AD in the middle temporal lobe; in addition, in the frontal lobe, BC was found to be reduced in MCI while it increased in the occipital lobe in AD. Both regional CBF values and BC decreased in the entorhinal cortex and hippocampus in AD. (5). Connections in AD showed significant differences compared to those in CN and MCI. The findings mentioned above are discussed in the following subsections.
4.1 Global properties of CBF correlation networksCompared with matched random networks, small-world networks have higher local clustering and similar path lengths, thus improving the communication efficiency of the brain (Bullmore and Sporns, 2009). In this study, the CN, MCI, and AD groups all exhibited small-world properties, which are consistent with other studies including FDG-PET-based functional and cortical networks in MCI and AD (Supekar et al., 2008; Yao et al., 2010; Seo et al., 2013; Xu et al., 2020), indicating that the 3D PCASL-based CBF correlation networks of CN, MCI, and AD present an optimal balance between local specialization and global integration processes.
In comparison with CN and MCI, the global efficiency was reduced in AD, which is consistent with a prior study (Liu et al., 2014), where the lower global efficiency of BOLD functional MRI networks in AD was reported. While in other studies, significantly reduced global efficiency or the clustering coefficient of networks were found (Berlot et al., 2016; Sanchez-Catasus et al., 2018; Zhou, 2020), in this study, MCI shows no apparent differences in properties of global efficiency, clustering coefficient, and characteristic path length over the entire range of sparsity thresholds. The intermediate state of MCI of the small-world in CBF correlation networks between CN and AD is consistent with prior studies (Liu et al., 2012; Dai and He, 2014).
4.2 Hub regions in CBF correlation networksThe hub regions identified in our study are largely consistent with previous reports. For instance, in CN, hub regions in the middle temporal gyrus, inferior frontal gyrus, and orbital gyrus occurred in a previous study in which cortical networks were characterized by gray matter volumes (Yao et al., 2010). Hub regions in the precuneus, medial frontal gyrus, inferior parietal cortex, and thalamus in current findings are consistent with the results in a study where nodal strength was used to identify hubs in functional networks (Dai et al., 2015). For the altered hub regions in brain connectivity in MCI and AD, some of our results are consistent with previous studies. Hub regions in the right precuneus were defined in all three groups, with left parahippocampal gyrus (e.g., entorhinal cortex) only appearing in the CN but missing in MCI and AD (Seo et al., 2013; Khazaee et al., 2017). In agreement with earlier studies (Seo et al., 2013; Grajski et al., 2019; Hrybouski et al., 2023), hub regions were found in the left precuneus and PCC only in CN and MCI, while in MCI and AD, hub regions occurred in the right angular gyrus (right inferior parietal lobe). Moreover, hub regions in the middle temporal gyrus in CN disappearing in MCI an AD was also proved. Of note, the loss of hubs in the hippocampus and entorhinal cortex in MCI and AD are subregions of the core memory-associated middle temporal lobe, which might be related to the dysfunction of the memory (Fjell et al., 2015; Hrybouski et al., 2023).
4.3 Altered CBF values and nodal properties in CBF correlation networksBrain regions with abnormal nodal properties (in terms of BC) and regional CBF values in AD are mainly distributed in the parahippocampal gyrus (e.g., entorhinal cortex), temporal gyrus, and hippocampus. The regions with significant differences in the entorhinal cortex and hippocampus are also identified as the loss hub regions, which is consistent with prior research and related to the impairment of memory (Seo et al., 2013; Hrybouski et al., 2023). Compared with CN, altered BC was found in the inferior frontal gyrus in MCI, which was revealed in a prior study (Seo et al., 2013). The superior temporal gyrus was found to decrease significantly in BC in MCI and AD, which was also marked in a previous study (He et al., 2008; Zhang et al., 2021), which involved auditory (e.g., language) processing and social cognition (Bigler et al., 2007). Additionally, significant BC increased in the occipital gyrus (e.g., cuneus). The increased hub region in AD, is consistent with a study in which structural connectivity was applied to understanding the association between disrupted integrity of the network and the underlying cognition (He et al., 2008), and which may serve as a compensatory system.
A previous study proved that regional CBF values decreased in patients with AD, and they were mainly distributed in the entorhinal cortex and hippocampus. The regional CBF values in the parietal cortex and precuneus were reduced in MCI when compared with CN, and our findings are consistent with these results (Binnewijzend et al., 2013; Mattsson et al., 2014). Moreover, a higher amyloid-β load was considered to have associations with those lower regional CBF values mentioned above (Maier et al., 2014; Mattsson et al., 2014). Although we did not estimate the association between the amyloid-β load and network-based changes of CBF, the abnormality of hub regions and connections in the entorhinal cortex and hippocampus in AD in this study may be related to the high load of amyloid-β.
4.4 Altered connections in CBF correlation networksIn Figure 9, details of the changes with significant differences (P < 0.001) of groups with CN-AD and MCI-AD are shown. Compared with CN, the decreased correlations in AD are mainly distributed in the frontal lobe, temporal lobe (e.g., middle temporal gyrus and parahippocampus), parietal lobe (e.g., precuneus and cingulate gyrus), and subcortical nuclei (e.g., hippocampus). The disrupted hub regions with apparently reduced BC are also linked by significantly decreased edges. They occurred in parahippocampus, precuneus, and hippocampus. Most of the altered connections in the hippocampus, middle temporal gyrus, cingulate gyrus, and precuneus in current CBF correlation networks are consistent with changes in the functional networks of AD in earlier studies (Wang et al., 2006; Zhou et al., 2008; Seo et al., 2013). Specifically, the alteration of the hippocampal–cortical (e.g., hippocampal-inferior frontal gyrus) connectivity is consistent with previous studies (Wang et al., 2006; Allen et al., 2007) and may link the decline of memory and cognitive function in AD since the hippocampal-cortical memory system contains interacting brain regions that are activated during episodic memory retrieval (Vincent et al., 2006; Buckner et al., 2008). In addition, the connection of the hippocampus to the right insular reduced in AD is in agreement with a prrevious study (Wang et al., 2011) and the changes in connections may underlie memory impairment. In earlier studies, the inferior parietal gyrus and/or precuneus were proved to have an association with mental orientation in CN and aMCI (Peer et al., 2015; Oishi et al., 2018). Our findings in this study showed the connection of the precuneus to the inferior parietal lobe decreased significantly, which may be the underlying reason for cognitive dysfunction of disorientation.
Moreover, the disruption of hub regions with altered connections occurred in the middle temporal gyrus, middle frontal gyrus, and cingulate gyrus. Of note, connectivity between precuneus and PCC decreased significantly in AD, which is consistent with prior studies (Rami et al., 2012; Yokoi et al., 2018). The functional connectivity with significantly decreased precuneus/PCC was assumed to have an association with cognitive function and plays a key role in developing AD (Yokoi et al., 2018).
4.5 LimitationsThis study has several limitations. First, the modest sample size of 3D PCASL data from the ADNI database may limit its statistical power. Second, the results of the CBF map calculations were affected by the parameters selected. Third, in this study, we only studied the group-level correlation networks due to the limitations of time series with current GE ASL data, and the individual-level networks were not analyzed. Finally, we found significant differences in cognitive scores (MMSE, MoCA, and ADAS13) among the three groups, while no correlation analysis of cognitive scores and network parameters of CN, MCI, and AD was performed in this study.
5 ConclusionIn this study, we estimated the abnormality of the topological organization of 3D PCASL-based CBF correlation networks in subjects with MCI and AD. The CBF correlation networks of CN, MCI, and AD all showed small-world properties. Compared with CN, global efficiency decreased significantly in AD. Significant differences in nodal properties and a loss of hub regions were observed in the middle temporal lobe in both MCI and AD. In the frontal lobe, BC was reduced in MCI while it increased in the occipital lobe in AD. The identified altered hub regions with significant differences in MCI and AD were mainly distributed in the hippocampus and entorhinal cortex. In addition, disrupted hub regions in AD with significantly decreased connections were mainly found in the precuneus/PCC and hippocampus-cortical cortex. The observed disruptions in the topological organization of 3D PCASL-based CBF correlation networks may underlie the cognitive decline and provide new insight into understanding the mechanism of MCI and AD.
Data availability statementPublicly available datasets were analyzed in this study. This data can be found here: Alzheimer's Disease Neuroimaging Initiative (ADNI) database (www.adni-info.org).
Ethics statementThe studies involving humans were approved by according to Good Clinical Practice guidelines, US 21Code of Federal Regulations Part 50– Protection of Human Subjects, and Part 56 –Institutional Review Boards/Research Ethics Boards, and under state and federal HIPAA regulations. The studies were conducted in accordance with the local legislation and institutional requirements. The participants provided their written informed consent to participate in this study.
Author contributionsML: Conceptualization, Data curation, Formal analysis, Investigation, Methodology, Software, Writing – original draft. TZ: Investigation, Writing – review & editing. YK: Conceptualization, Supervision, Writing – review & editing. SQ: Conceptualization, Funding acquisition, Supervision, Writing – review & editing.
FundingThe author(s) declare that financial support was received for the research, authorship, and/or publication of this article. This work was funded by the Fundamental Research Funds for the Central Universities N2324004-13 and the Natural Science Foundation of Liaoning Province 2020-BS-049. Data collection and sharing for this project was funded by the Alzheimer's Disease Neuroimaging Initiative (ADNI) (National Institutes of Health Grant U01 AG024904) and DOD ADNI (Department of Defense award number W81XWH-12-2-0012). ADNI was funded by the National Institute on Aging, the National Institute of Biomedical Imaging and Bioengineering, and through generous contributions from the following: AbbVie, Alzheimer's Association; Alzheimer's Drug Discovery Foundation; Araclon Biotech; BioClinica, Inc.; Biogen; Bristol-Myers Squibb Company; CereSpir, Inc.; Cogstate; Eisai Inc.; Elan Pharmaceuticals, Inc.; Eli Lilly and Company; EuroImmun; F. Hoffmann-La Roche Ltd and its affiliated company Genentech, Inc.; Fujirebio; GE Healthcare; IXICO Ltd.; Janssen Alzheimer Immunotherapy Research & Development, LLC.; Johnson & Johnson Pharmaceutical Research & Development LLC.; Lumosity; Lundbeck; Merck & Co., Inc.; Meso Scale Diagnostics, LLC.; NeuroRx Research; Neurotrack Technologies; Novartis Pharmaceuticals Corporation; Pfizer Inc.; Piramal Imaging; Servier; Takeda Pharmaceutical Company; and Transition Therapeutics. The Canadian Institutes of Health Research is providing funds to support ADNI clinical sites in Canada. Private sector contributions are facilitated by the Foundation for the National Institutes of Health (www.fnih.org). The grantee organization is the Northern California Institute for Research and Education, and the study is coordinated by the Alzheimer's Therapeutic Research Institute at the University of Southern California. ADNI data are disseminated by the Laboratory for Neuro Imaging at the University of Southern California. The funders were not involved in the study design, collection, analysis, interpretation of data, the writing of this article, or the decision to submit it for publication.
Conflict of interestThe authors declare that the research was conducted in the absence of any commercial or financial relationships that could be construed as a potential conflict of interest.
Publisher's noteAll claims expressed in this article are solely those of the authors and do not necessarily represent those of their affiliated organizations, or those of the publisher, the editors and the reviewers. Any product that may be evaluated in this article, or claim that may be made by its manufacturer, is not guaranteed or endorsed by the publisher.
Supplementary materialThe Supplementary Material for this article can be found online at: https://www.frontiersin.org/articles/10.3389/fnagi.2024.1345251/full#supplementary-material
ReferencesAllen, G., Barnard, H., Mccoll, R., Hester, A. L., Fields, J. A., Weiner, M. F., et al. (2007). Reduced hippocampal functional connectivity in Alzheimer disease. Arch. Neurol. 64, 1482–1487. doi: 10.1001/archneur.64.10.1482
PubMed Abstract | Crossref Full Text | Google Scholar
Alsop, D. C., Dai, W., Grossman, M., and Detre, J. A. (2010). Arterial spin labeling blood flow MRI: its role in the early characterization of Alzheimer's disease. J. Alzheimers. Dis. 20, 871–880. doi: 10.3233/JAD-2010-091699
PubMed Abstract | Crossref Full Text | Google Scholar
Alsop, D. C., Detre, J. A., Golay, X., Gunther, M., Hendrikse, J., Hernandez-Garcia, L., et al. (2015). Recommended implementation of arterial spin-labeled perfusion MRI for clinical applications: a consensus of the ISMRM perfusion study group and the European consortium for ASL in dementia. Magn. Reson. Med. 73, 102–116. doi: 10.1002/mrm.25197
PubMed Abstract | Crossref Full Text | Google Scholar
Berlot, R., Metzler-Baddeley, C., Ikram, M. A., Jones, D. K., and O'sullivan, M. J. (2016). Global efficiency of structural networks mediates cognitive control in mild cognitive impairment. Front. Aging Neurosci. 8, 292. doi: 10.3389/fnagi.2016.00292
PubMed Abstract | Crossref Full Text | Google Scholar
Bigler, E. D., Mortensen, S., Neeley, E. S., Ozonoff, S., Krasny, L., Johnson, M., et al. (2007). Superior temporal gyrus, language function, and autism. Dev. Neuropsychol. 31, 217–238. doi: 10.1080/87565640701190841
PubMed Abstract | Crossref Full Text | Google Scholar
Binnewijzend, M. A., Benedictus, M. R., Kuijer, J. P., Van Der Flier, W. M., Teunissen, C. E., Prins, N. D., et al. (2016). Cerebral perfusion in the predementia stages of Alzheimer's disease. Eur. Radiol. 26, 506–514. doi: 10.1007/s00330-015-3834-9
PubMed Abstract | Crossref Full Text | Google Scholar
Binnewijzend, M. A., Kuijer, J. P., Benedictus, M. R., Van Der Flier, W. M., Wink, A. M., Wattjes, M. P., et al. (2013). Cerebral blood flow measured with 3D pseudocontinuous arterial spin-labeling MR imaging in Alzheimer disease and mild cognitive impairment: a marker for disease severity. Radiology 267, 221–230. doi: 10.1148/radiol.12120928
PubMed Abstract | Crossref Full Text | Google Scholar
Biswal, B., Yetkin, F. Z., Haughton, V. M., and Hyde, J. S. (1995). Functional connectivity in the motor cortex of resting human brain using echo-planar MRI. Magn. Reson. Med. 34, 537–541. doi: 10.1002/mrm.1910340409
PubMed Abstract | Crossref Full Text | Google Scholar
Buckner, R. L., Andrews-Hanna, J. R., and Schacter, D. L. (2008). The brain's default network: anatomy, function, and relevance to disease. Ann. N. Y. Acad. Sci. 1124, 1–38. doi: 10.1196/annals.1440.011
PubMed Abstract | Crossref Full Text | Google Scholar
Bullmore, E., and Sporns, O. (2009). Complex brain networks: graph theoretical analysis of structural and functional systems. Nat. Rev. Neurosci. 10, 186–198. doi: 10.1038/nrn2575
PubMed Abstract | Crossref Full Text | Google Scholar
Buxton, R. B., Uluda,g, K., Dubowitz, D. J., and Liu, T. T. (2004). Modeling the hemodynamic response to brain activation. Neuroimage 23, S220–233. doi: 10.1016/j.neuroimage.2004.07.013
PubMed Abstract | Crossref Full Text | Google Scholar
Celone, K. A., Calhoun, V. D., Dickerson, B. C., Atri, A., Chua, E. F., Miller, S. L., et al. (2006). Alterations in memory networks in mild cognitive impairment and Alzheimer's disease: an independent component analysis. J. Neurosci. 26, 10222–10231. doi: 10.1523/JNEUROSCI.2250-06.2006
PubMed Abstract | Crossref Full Text | Google Scholar
Dai, Z., and He, Y. (2014). Disrupted structural and functional brain connectomes in mild cognitive impairment and Alzheimer's disease. Neurosci. Bull. 30, 217–232. doi: 10.1007/s12264-013-1421-0
PubMed Abstract | Crossref Full Text | Google Scholar
Dai, Z., Yan, C., Li, K., Wang, Z., Wang, J., Cao, M., et al. (2015). Identifying and mapping connectivity patterns of brain network hubs in Alzheimer's disease. Cereb. Cortex 25, 3723–3742. doi: 10.1093/cercor/bhu246
PubMed Abstract | Crossref Full Text | Google Scholar
Detre, J. A., Zhang, W., Roberts, D. A., Silva, A. C., Williams, D. S., Grandis, D. J., et al. (1994). Tissue specific perfusion imaging using arterial spin labeling. NMR Biomed. 7, 75–82. doi: 10.1002/nbm.1940070112
PubMed Abstract | Crossref Full Text | Google Scholar
Dolui, S., Vidorreta, M., Wang, Z., Nasrallah, I. M., Alavi, A., Wolk, D. A., et al. (2017). Comparison of PASL, PCASL, and background-suppressed 3D PCASL in mild cognitive impairment. Hum. Brain Mapp. 38, 5260–5273. doi: 10.1002/hbm.23732
留言 (0)