
記住我


Thirty-eight patients diagnosed with HR + HER2- MBC and a PIK3CA mutation, treated with alpelisib at TAMC between October 2015 and July 2023, met eligibility criteria and were included in the analysis. Patient clinical characteristics, body composition measures and toxicity outcomes are described in Table 1. The median age was 70 years (interquartile range [IQR], 57–78). Approximately half of the women (n = 20, 53%) were treated with alpelisib up to third line or below, 18 (47%) patients received alpelisib as fourth or greater line of treatment, with a median of 3 prior lines of therapy (IQR, 2–4). Patient mean weight was 60 kg (standard deviation [SD] ± 14). Mean BMI was 23.9 ± 5.9 kg/m2, and among the study population, 10 (26%) patients were obese. Median BSA was 1.6 m2 (IQR, 1.5–1.7).
Table 1 Patient characteristics, body composition measures and toxicity outcomesCT-based body composition indices were available and calculated for all patients. Patient mean SMI was 35.5 cm2/m2 as demonstrated in Fig. 1, and a median SMG of 1142 AU (IQR, 935–1511). Patient median LBM was 34.4 kg (IQR, 31–37.1). The mean SMA was 87.9 cm2 ± 29.6 [SD]), and SMD was 32 HU.
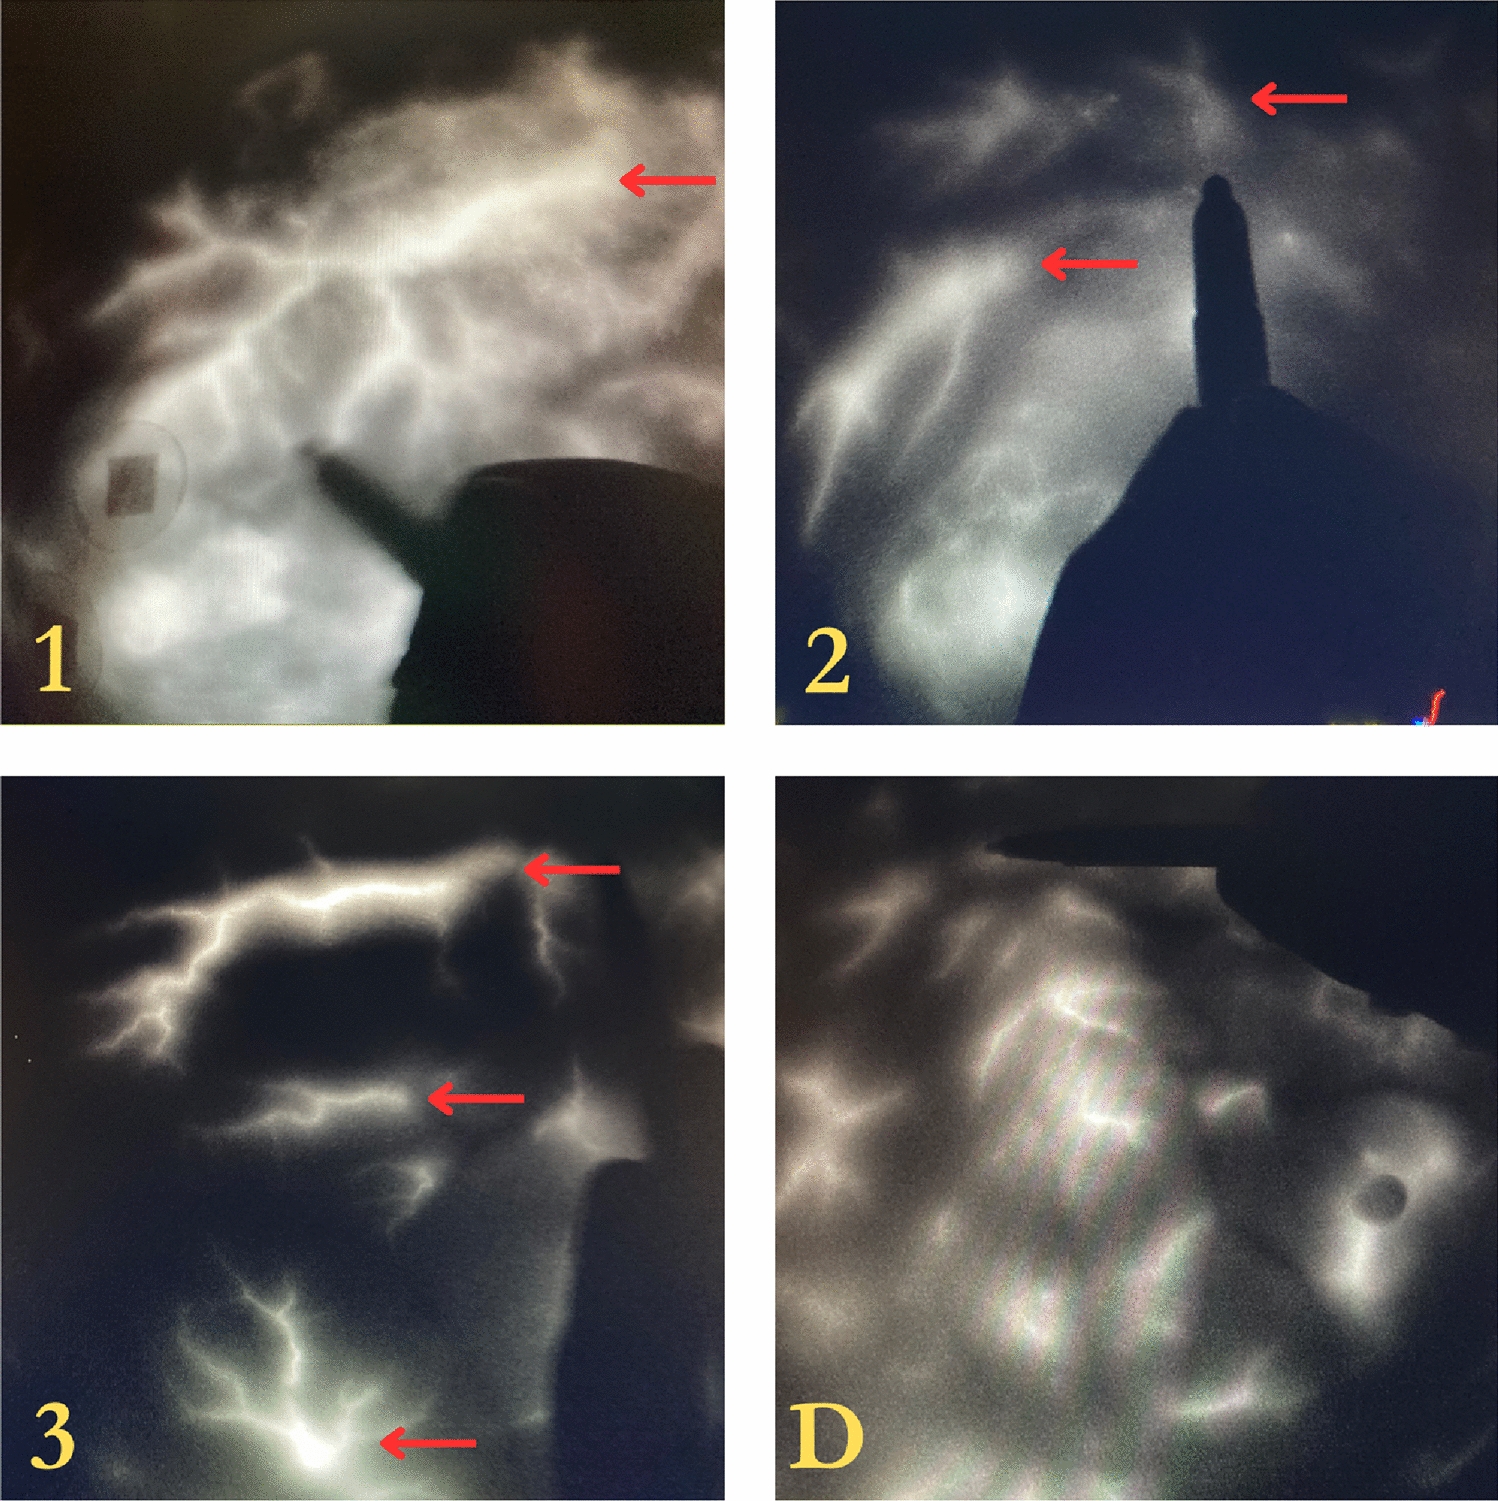
Fig. 1
Example of sarcopenia, two patients with metastatic breast cancer, Left, normal SMI (43cm2/m2) non sarcopenic; Right, low SMI (30.6 cm2/m2) sarcopenic
Half of the patients were sarcopenic, (n = 19, 50%). The study population PIK3CA mutations are presented in Supplementary Table 1.
Toxicity outcomesAmong the study population, almost half of the patients had a dose reduction of alpelisib (16, 42.1%), and 26 patients (68.4%) a dose interruption of therapy (Table 1).
A minority were hospitalized resulting from toxicity of the treatment (n = 6, 16%). Only 3 (8%) patients did not experience any AE. The majority of patients encountered AE grade ≥ 2 (n = 31, 81.6%) and 15 women (39.5%) suffered from grade ≥ 3 AE.
Body composition as a predictor of increased Alpelisib toxicityAmong women with grade ≥ 2 AE, age, treatment line, ECOG PS, sarcopenia (SMI < 38, and SMI teritial divisions), SMG, and LBM tertiles did not provide additional measures in determining the likelihood of increased drug toxicity (gastrointestinal, haematological, hyperglycaemia, and rash), hospitalizations, dose reductions and interruptions of alpelisib, as demonstrated in Table 2.
Table 2 Association of baseline characteristics, treatment, with adverse events grade ≥ 2Patients with a lower tertiles SMG were likely to have increased risk of Severe toxicity, (22.6%, the upper two thirds which were 3.2%, and 6.5%, respectively, P = 0.02).
When evaluating each toxicity independently, age, ECOG, dose reductions and body composition measures (including BMI, BSA, VAT, SAT, SMA, SMI, SMG), they were not associated with increased toxicity from alpelisib (Table 3).
Table 3 Body metric parameters predictive of independent toxicitiesRisk of hyperglycemia was associated with lower mean VAT (40 ± 32.8 [SD] cm2 vs. 103.3 ± 57.7 [SD] cm2, P = 0.023), mean SAT (100.8 ± 74.6 [SD] cm2 vs. 183.4 ± 66.5 [SD] cm2, P = 0.016), mean SMD (41.6 ± 11.6 [SD] HU vs. 29.6 ± 9.2 [SD] HU, P = 0.015), median VAT density, − 76.36 HU (IQR, − 85.31, − 60.27) vs. − 91 HU(IQR, − 98.79, − 81.14, P = 0.009), and median SAT density (− 83.23 HU (IQR, − 97.78, − 81.28) vs. − 101 HU (IQR, − 105.2, − 94.12), P = 0.021). The risk of hyperglycaemia grade ≥ 1 was not associated with age, BMI, BSA, height, SMI, SMG, and LBM.
Among the body composition measures, mean SMD was associated with grade ≥ 2 hyperglycemia, (38 ± 9.6 [SD] HU vs. 28.9 ± 9.7 [SD] HU, P = 0.024). Median VAT was marginally associated with grade ≥ 2 hyperglycemia, − 79.69 HU (IQR, − 92.9, − 75.26) vs. − 91 HU (IQR, − 98.79, − 83.14), P = 0.05).
Rash grade ≥ 2 was associated with lower median VAT (− 88.35 HU (IQR, − 94.43, − 78.22) vs. − 97.8 HU (IQR, − 172, − 89.85), P = 0.043). While grade ≥ 2 rash, was associated with an increased hospitalization (8% of patients hospitalized with a rash vs. 75.7% of patients who were not hospitalized and without a rash, P = 0.042).
Among patients with Severe toxicity, they had a higher risk of developing grade ≥ 2 hyperglycaemia (OR = 9.58, P = 0.01).
None of the body composition metrics were found to be significantly associated with an increased likelihood of having hematological, and gastrointestinal toxicity.
Among the population of patients with sarcopenia (SMI < 38) who were overweight or obese, 8 (23%) women experienced any toxicity grade ≥ 2, 21% hyperglycemia grade ≥ 2, 16% had a dose reduction or delay, 21% experienced Severe toxicity, while none were hospitalized or experienced rash (grade ≥ 2).
Oncological outcomesWe performed an analysis of TTF and OS and found that they were not statistically different across patients with various body composition metrics, drug toxicity, and dose reductions.
留言 (0)