The biotinylated capture antibody (polyclonal NT-proBNP sheep-IgG-biotin, cAb), antigen (NT-proBNP (1–76) amid) in whole blood, probe antibody (monoclonal NT-proBNP mouse-IgG), probe antibody–modified fluorescence nanoparticles (Ab-fluorescence NPs), albumin (97%), and poly streptavidin (pSA) were provided by Roche Diagnostics GmbH (Mannheim, Germany). Hydrochloric acid (HCl, 0.1 M, 1 M), sodium chloride (NaCl, p.a.), bovine serum albumin (BSA, > 96%), poly(diallyldimethylammonium chloride) (PDDA, Mw 200,000–350,000, 20 wt.% in H2O), poly(acrylic acid, sodium salt) solution (average Mw 15,000, 35 wt.% in H2O), ethylenediaminetetraacetic acid (EDTA, ≥ 98.5%), sodium hydroxide (NaOH, 1 M), poly(ethylene glycol)-block-poly(propylene glycol)-block-poly(ethylene glycol) (Synperonic® PE/P84), sodium azide, and Tween 20 (> 97%) were supplied from Sigma-Aldrich (www.sigmaaldrich.com). HetaSep™ (www.stemcell.com) was utilized as agglutination agent.
Lateral flow channel fabrication with filter trench
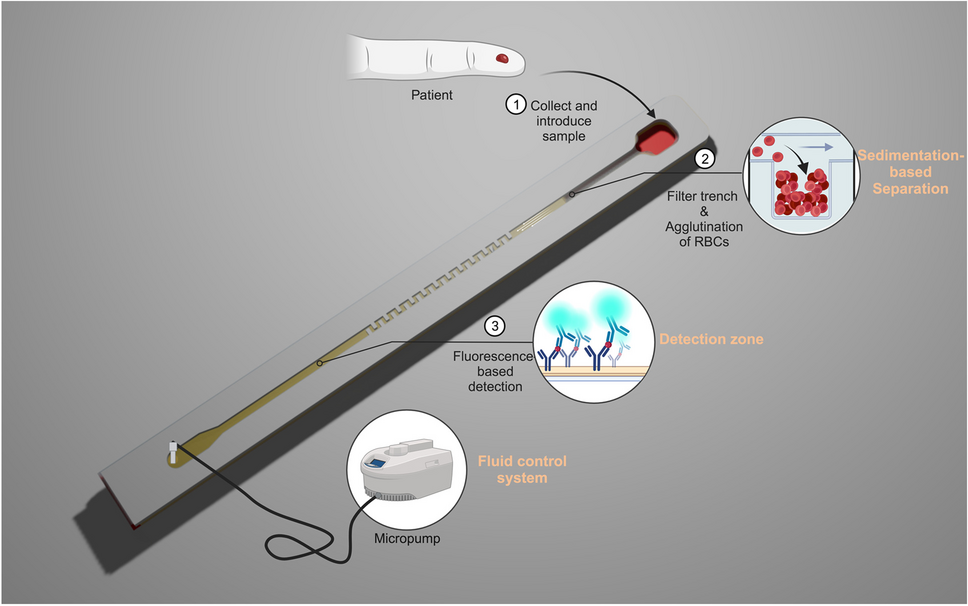
The lateral flow channel was composed of an inlet, a channel, a filter trench, a detection zone, and an outlet that was connected to the micropump (Fig. S1). For the construction of the lateral flow channel, a slightly modified procedure of Yang et al. was used [24]. The platform is built-up out of four layers: (1) the substrate (Melinex®329, 175 µm), (2) a capillary-given spacer (Melinex®329, 250 µm), both were purchased from Dupont Teijin Films (www.dupontteijinfilms.com), (3) the filter trench-given foam spacer was customized by ATP Adhesive Systems (atp-ag.com), and (4) the cover foil Hostaphan RN 100 was purchased from Mitsubishi Polyester Film (www.m-petfilm.de). The capillary-given spacer and the filter trench-given spacer were coated with double-sided adhesive tape on both sides, which was supplied by Henkel-Adhesives (www.henkel-adhesives.com). The channel (dimension: 90 mm × 1.5 mm × 0.28 mm), filter trench (dimension: 10 mm × 1.5 mm × 3 mm), the inlet (dimension: 4.5 mm × 3 mm × 0.28 mm), and outlet (dimension: Ø 1.5 mm) were designed by using the CorelDraw 2016 software and were then engraved.
To create the all-in-one, single-step immunoassay, the bio-recognition line on the substrate (Melinex®329, 175 µm) was patterned perpendicular to the flow direction with 1-mm-wide lines of a polyelectrolyte-poly streptavidin multilayer using the layer-by-layer approach before assembling the device. Briefly, poly streptavidin (500 µL, 10 mg∙mL−1) and polydiallyldimethylammonium chloride (500 µL, 0.5% (w/v)) were mixed at pH 7.4 and 150 mM NaCl to produce PDDA-poly streptavidin complexes. To assemble the detection zone, the PDDA-poly streptavidin complexes and polyacrylic acid (0.5% (w/v), pH 4.55, PAA) were alternately deposited for 60 s onto the plastic slide through a shape-giving mold. The repetition of this alternative coating procedure was carried out for four cycles to create the detection zone. Capture Abs at a concentration of 2.5 µg∙mL−1 and the Ab-fluorescence NPs at a concentration of 2% (w/v) were individually dispensed onto the immunoassay support, with 2 µL of each reagent. For the plasma separation, 6 µL of the aggregation agent was dispensed in the sample application zone. The dispensed reagents were then dried using a drying cabinet at a temperature of 50 °C for a duration of 10 min. Following the drying process, the support, spacer, and cover foil were assembled as shown in Figure S1 of the Electronic Supplementary Material (ESM).
Human blood sample
Samples of human blood from healthy donors were provided from Roche Diagnostics (Mannheim, Germany) in vacutainers with 7.2 mg K2 ethylenediaminetetraacetic acid (EDTA).
Quantification of the plasma purity
For the quantification of the plasma purity, we followed the procedure of Sneha Maria et al. with slight changes [25]. Briefly, the plasma purity was examined in the lateral flow channel by comparing the grayscale intensities of the plasma obtained by the proposed device (Igtrench) and the plasma obtained from the centrifuge (Igcentrifuge). As RBCs are darker in color than plasma, their presence in the sample can reduce the grayscale intensity of the channel. Hence, the plasma purity was expressed as followed:
$$purit_=100\%* \frac_}_}$$
(1)
Quantification of the recovered plasma volume
The volumes of the plasma present in the channel and the volume of the plasma in whole blood after centrifuge were measured, by comparing the distance of transported plasma in the channel, and the following formula was applied:
where, hchannel, wchannel, and dplasma represent the channel height, channel width, and traveled distance of plasma, respectively.
Performance of the bioassay
A sandwich immunoassay with spiked blood samples was carried out to investigate the assay performance of the lateral flow channel assay. The samples were prepared in human whole blood through dilution of an AG stock solution (0–9000 pg∙mL−1) for analysis. For the immunoassay, 25 µL of the spiked sample was applied on the sample application area. The sample was immediately transported to the filter trench with a flow rate of 60 µL∙min−1 by the external vent control. After the separation time of 10 min, the separated plasma was further transported to the outlet with a flow rate of 2 µL∙min−1, crossing the detection zone. The immunoassay was performed at room temperature and fluorescence signals could be obtained after 35 min. For the calculation of the limit of detection (LOD), the logistic fit parameter for the lower curve asymptote A and the standard deviation of the blank SD (blank):
$$LOD = A + 3.3 * SD(blank)$$
(3)
The concentration of the antigen in the sample is determined by correlating the fluorescence intensity to a calibration curve constructed using known antigen concentration standards.
Supporting instruments
The drying processes were carried out using a drying cabinet set at a temperature of 50 °C (FED 400 E2, www.binder-world.com). The fluid control equipment and software used in this study were custom-made and supplied by Roche Diagnostics GmbH (Mannheim, Germany) (Fig. S2a). The fluorescence images were captured using a fluorescence microscope equipped with a LINOS lens (www.excelitas.com) and an HTC camera featuring a Sony CCD sensor ICX285AL (www.sony.com) (Fig. S2b). Illumination was provided by a XENON XBO R 100W/45 OFR lamp (www.osram.com), and specific excitation and detection filters (633-nm excitation and 685-nm detection) were utilized (www.semrock.com). The imaging software used for data acquisition was provided by Roche Diagnostics (Mannheim, Germany). The fluorescence images were taken with an exposure time of 25 ms. Image processing and data analysis were carried out with ImageJ and Origin 2021.

留言 (0)