
記住我


This study is considered a secondary analysis of a prospective study. It is embedded in the BENEFIT study (trial number: NL8068; Netherlands Trial Register, also available from trialsearch.who.int), which was approved by The Medical Ethical Committee of the University Medical Center Groningen (UMCG). The main aim of the BENEFIT study is to assess the long-term effects of RRSO on BMD and muscle mass. Women were BRCA1/2 germline pathogenic variant (GPV) carriers who underwent RRSO ≥ 10 years ago before age 52 (natural menopause) and were included after written informed consent. Women were excluded if they had metastatic disease, insufficient understanding of the Dutch language, or if they were unable to visit the UMCG due to their physical condition.
DXAWomen included in the BENEFIT study underwent DXA WBC (Hologic Horizon DXA, Marlborough, MA, USA), which was analyzed with Hologic APEX software version 5.6.0.5 (HOLOGIC, Inc, Bedford MA, United Kingdom). The system uses high and low energy X-ray beams to measure body density and body composition. The system differentiates between bone and soft tissue, the latter being differentiated into muscle and fat according to the density of the tissue [17].
Collected dataThe following clinical characteristics of the study population were collected: age, length, weight, age at RRSO, and duration of menopause. Data that were collected from the DXA scan included: total grams bone mass, total grams muscle mass, and total grams fat mass.
Reliability, costs, and radiation doseReliability was assessed by calculating the inter- and intra-observer variability. For that, DXA scans were analyzed independently by two observers (I.S. and A.S.). Scans were assessed twice by both observers, each scan was analyzed four times in total. The time interval between the first and second measurement for the intra-observer variability was 2 to 3 h.
The costs of DXA, CT, and MRI were calculated according to the guidelines for economic evaluation of the Dutch National Health Care Institute (Zorginstituut Nederland) [18]. Costs were calculated separately for staff, equipment, and materials. For calculating the costs of the staff, wages were based on the ‘CAO Universitair Medische Centra 2022–2023’, the Collective Labor Agreement of University Hospitals in the Netherlands 2022–2023 [19]. For equipment (i.e., the scanners), an amortization scheme of 10 years was used. Maintenance costs for the scanners were considered 10% of its original list price at time of purchase per year. A percentage of 35% was used for housing and overhead costs. Costs for materials used were derived from invoices from the in-hospital order and delivery system.
Information on radiation dose for DXA and CT were collected from literature.
Protocol DXAA standardized protocol was used to make and analyze the scans, available in the Supplementary Materials. The scans were performed by trained technicians. Study participants were requested to remove all clothing, except underwear and socks. All metal items were removed before densitometry. For hygiene purposes, the table was covered with a sheath, but pillows were removed. Study participants were positioned perpendicular and in the middle of the table, with their hands next to their body, the fingers lightly spread, and the feet in slight endorotation. Participants were asked to look at the ceiling. After positioning the participant, the upper and lower borders of the scanning area were checked to ensure that the whole body was scanned. When the participant’s body was too large to fit both hands in the horizontal plane in the scanning area, the hands were placed vertically. If this did not fit, the participant was placed in such a way that the left arm was just out of the scanning field. During the analysis, the right arm was then copied to the left arm. During the scanning procedure, the DXA technicians asked patients to remain still. The scan was performed from cranial to caudal in three sequences.
The observers that analyzed the scans were medical interns at the time of analyzing the scans and had no previous experience with analyzing DXA scans. Both observers received a basic training under supervision of an experienced technician. Both legs were segmented into an upper and lower part, adding up to a total of four body regions. The upper border from the upper region being the femur neck, the lower border from the upper region being the most distal part of the femur. For the lower region, the upper border was the most proximal part of the tibia, and the lower border was the most distal part of the calcaneus. An example is displayed in Fig. 1. After manually drawing the regions, the body composition of the designated regions is calculated by the Hologic APEX software, version 5.6.0.5 (HOLOGIC, Inc, Bedford MA, United Kingdom), according to the NHANES reference database. Researchers were blinded for clinical data of the patient and for the previous results.
Fig. 1
An example of body regions of the lower extremities manually drawn by an observer
Sample sizeFor the current analysis, a consecutive series of 34 women included in the BENEFIT study from November 2019 until March 2020 were analyzed. A post hoc power analysis was performed to calculate the minimal detectable correlation.
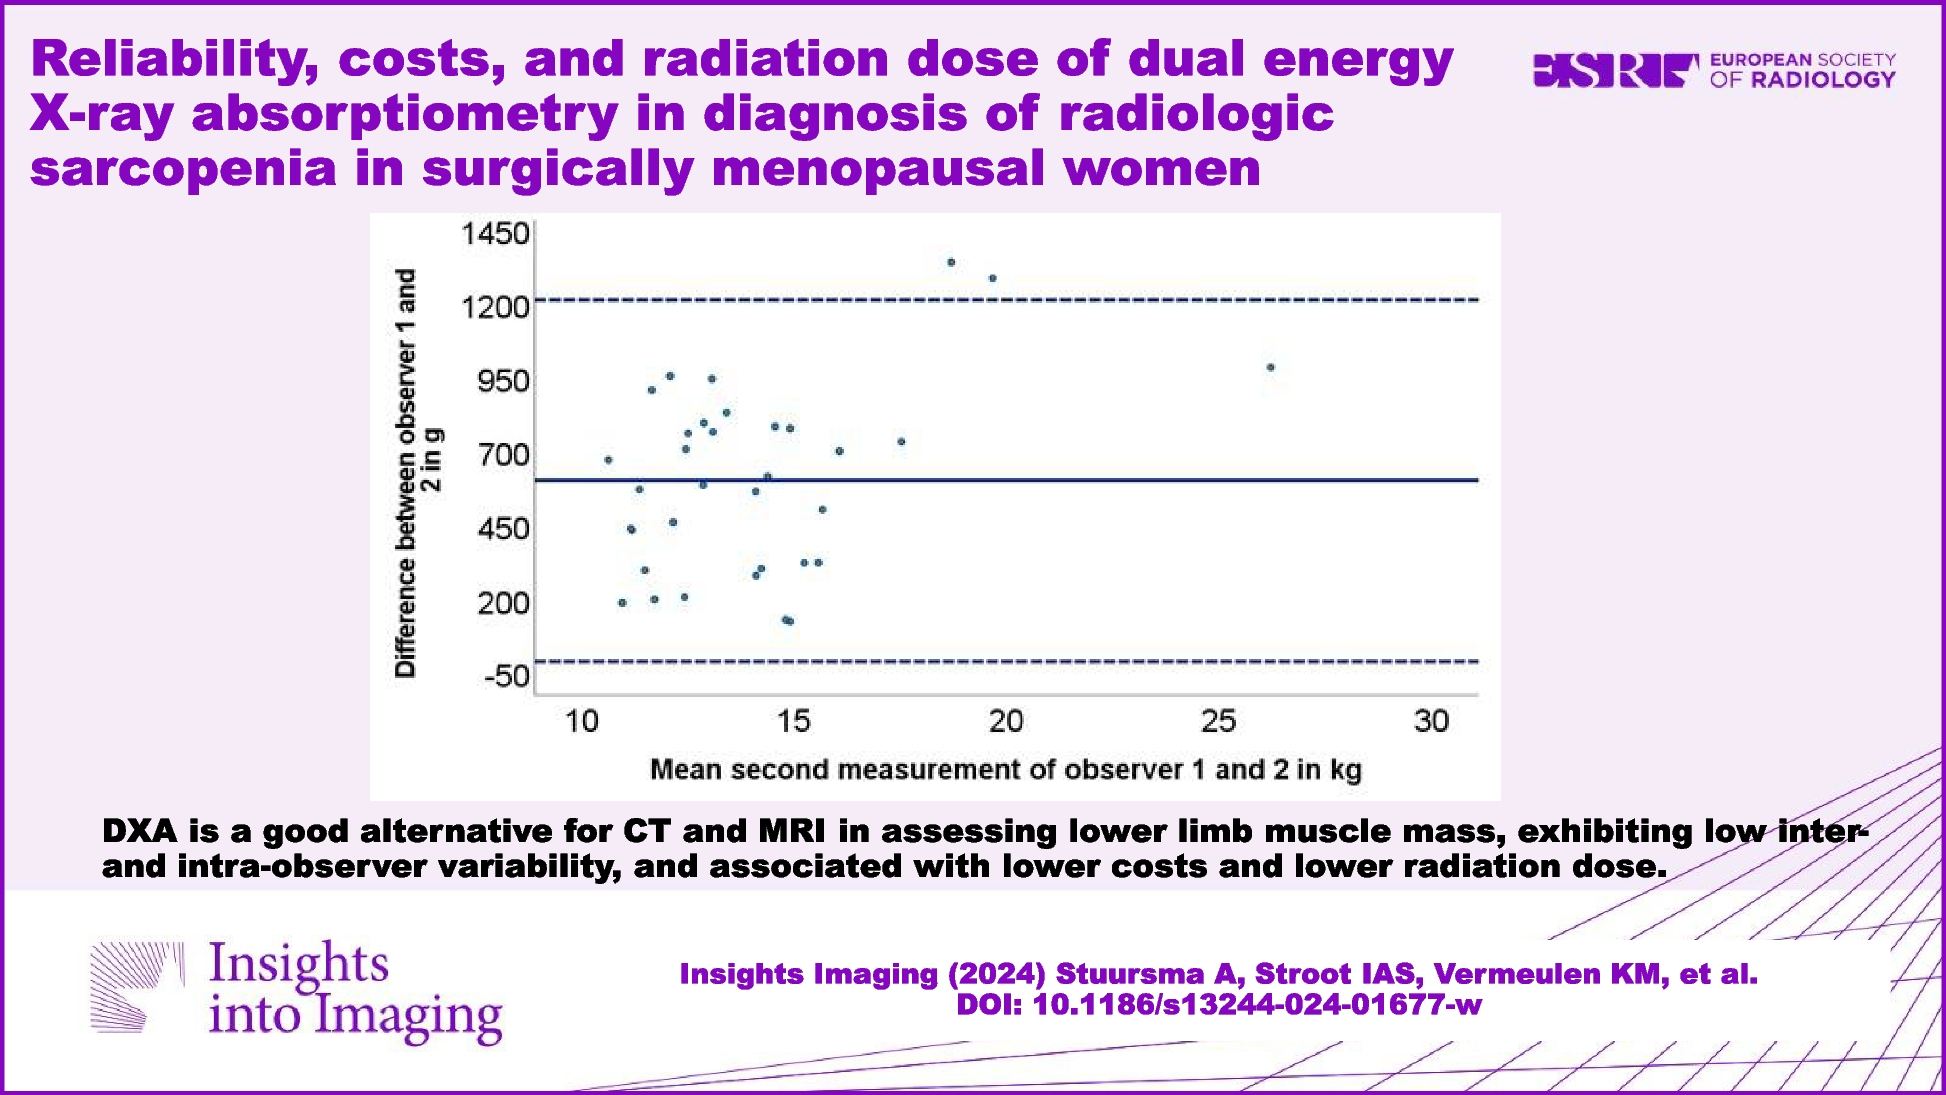
Statistical analysisDescriptive statistics were used to describe the study population and their body composition. Inter-observer variability was calculated from the absolute variability from the first round of assessments. The mean relative difference between observers in the muscle mass measured was shown in a Bland–Altman plot with 95% limits of agreement (± 1.96 SD). The intraclass correlation coefficient (ICC) was calculated to evaluate the consistency between the two observers [20, 21].
Intra-observer variability was expressed as the absolute and relative difference within the two observers. The mean difference with 95% limits of agreement (± 1.96 SD) was shown in a Bland–Altman plot and the ICC was calculated to evaluate consistency within the two observers.
Statistical tests were performed using IBM SPSS version 26.0 for Windows (Armonk, NY, USA). Significance was assumed when the two-sided p-value < 0.05. The ICC was regarded as good when > 0.75.
留言 (0)