
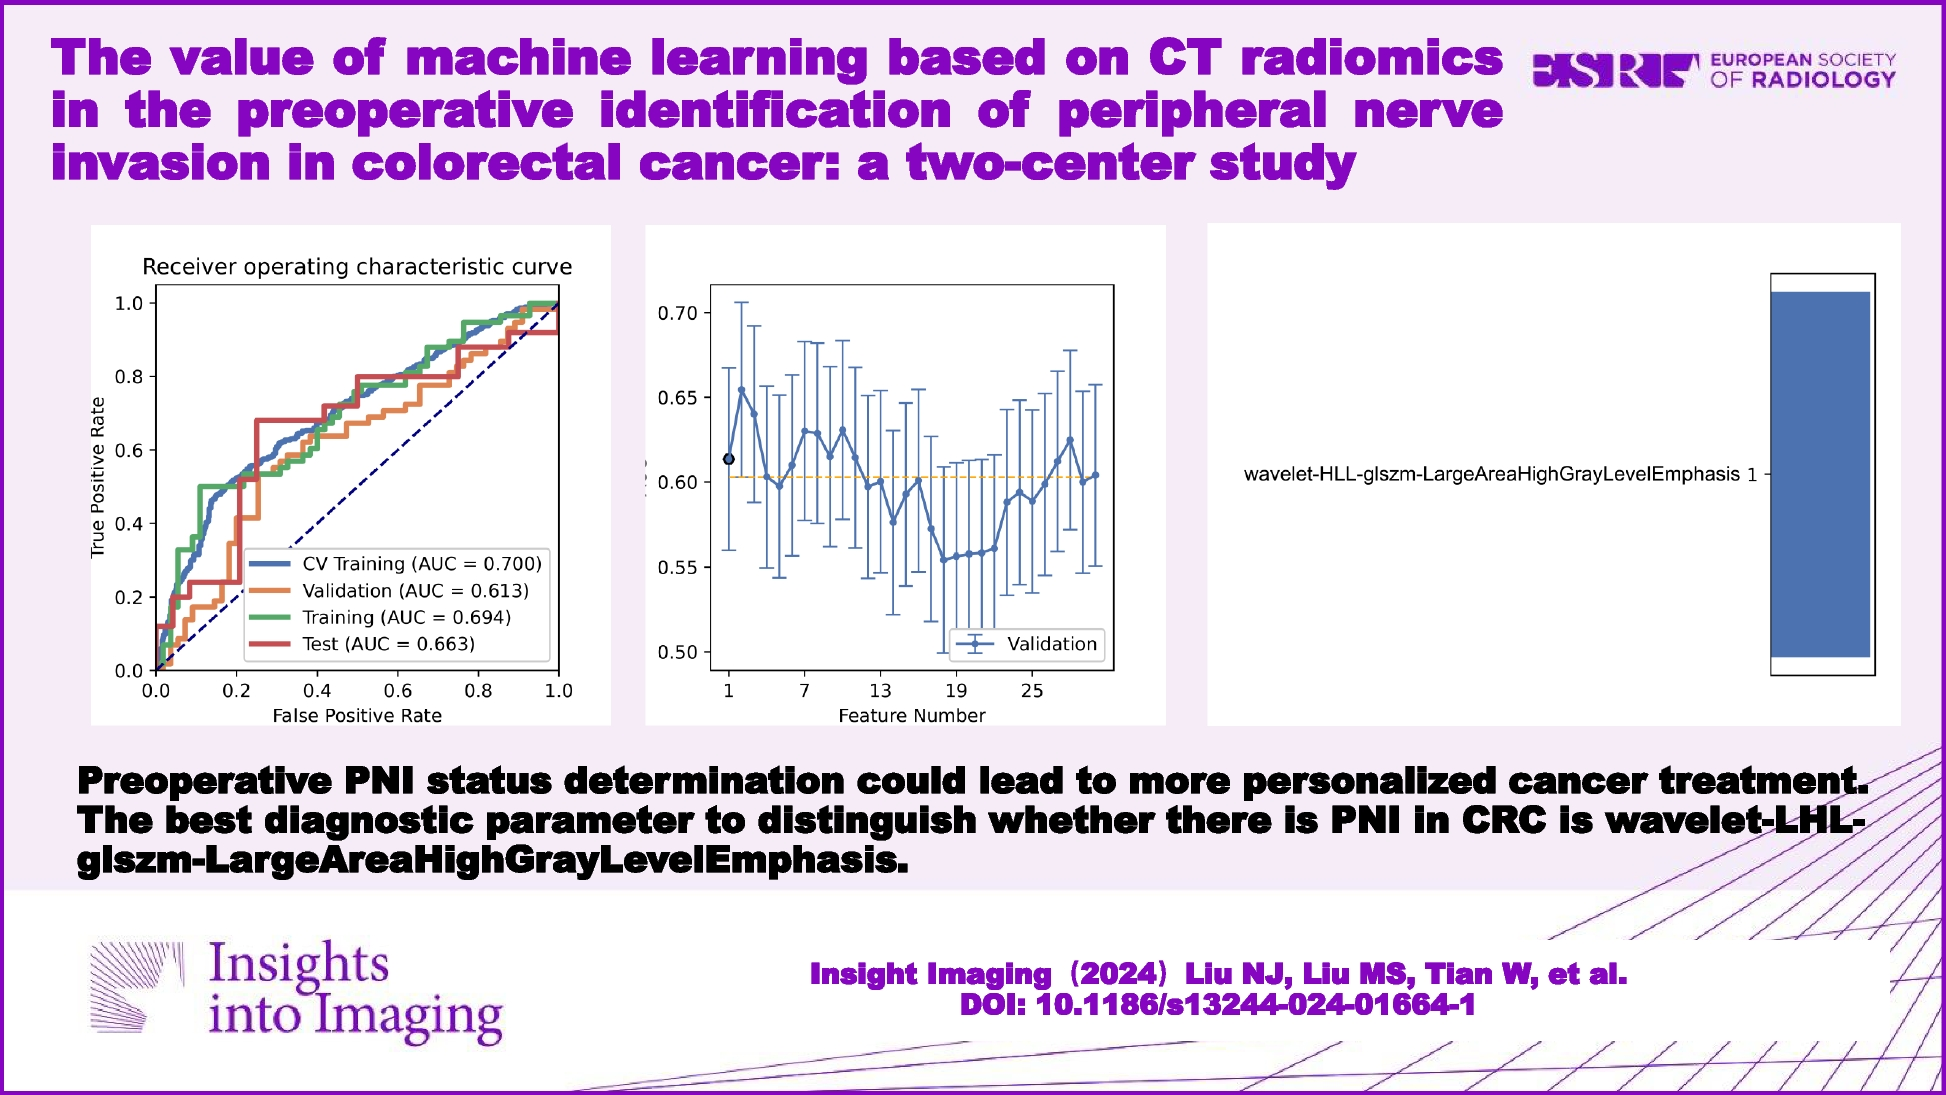
記住我


This retrospective observational diagnostic study was approved by the non-interventional clinical research ethics committee at Medipol University with reference number E-10840098-772.02-1232 (17,02.2022/decision number:187). This was a retrospective, anonymized diagnostic study, ensuring patient privacy and confidentiality. Therefore, informed consent could not be acquired nor was it required.
SubjectsOur electronic records between March 2022 and January 2023 were analyzed. Asymptomatic patients with screening tomosynthesis and same-day HbA1c% values were selected. A retrospective analysis was conducted on 2521 DBT examinations of women aged 40 years or older who underwent breast tissue screening via DBT at the Breast Imaging Unit of the Department of Radiology at Medipol Mega University Hospital. All patients (all females; mean age ± standard deviation 55 ± 10, between the ages of 40 and 77) were examined using the DBT method with Siemens Mammomat Revelation (Erlangen, Germany). The patients’ left mediolateral oblique (MLO) DBT exams, which demonstrate adequate levels of pectoral muscle, were documented. In Fig. 1, the “data selection flowchart” is reviewed.
Fig. 1
The following are the inclusion criteria:
1.Cases with imaging interpretation results categorized as BIRADS 1, 2, and 3
2.Cases categorized as BIRADS 0 but with BIRADS 1, 2, or 3 findings observed in the ultrasound examination performed during the same period as the complementary tests
The following are the exclusion criteria:
1.Images containing inadequate, blurry, or no pectoral muscle tissue
2.Imaging interpretation with suspicious masses (BIRADS 4, 5, 6)
3.Patients with a history of cancer surgery, radiation therapy, or chemotherapy
4.Patients on prescription for diabetes
5.Right MLO images: not included in the study because of the expected hypertrophy of the right pectoral muscle caused by the more frequent use of the right upper extremity in the general population compared with the left
Study designThe left DBT images of the 40-year and older female patients included in the study who applied to Medipol Mega Hospital for comprehensive health screening were collected consecutively and anonymously in DICOM format from the radiologic information system to create a data set. The HbA1c% values obtained from the blood samples taken for diabetes screening were recorded from the electronic hospital information system. The blood samples were collected from the patients on the same day of the DBT. No additional DBT or HbA1c tests were performed for this study.
In routine practice, plasma HbA1c is the standard diagnostic test for evaluating a patient’s chronic blood sugar level. The HbA1c values of patients with normal values (≤ 5.5%) constituted the control group. Cases with HbA1c values between 5.6 and 6.4%were categorized as prediabetic and those with ≥ 6.5% as diabetic and included in the study group. Each group was divided into three subgroups according to age: 40–49 years, 50–59 years, and 60 years and above. We tried to provide the minimum number of images to maintain successful learning by the AI. Therefore, a minimum of 1000 images were aimed to be collected for each category in each age range. In total, 13,927 images were collected first. More than one image from the same patient was entered into our dataset. To achieve cross-validation, all images from a single patient were analyzed either in the training group or in the testing group. This way, we attempted to prevent overfitting.
Before feeding the AI, image selection and some narrowing of groups were performed to prevent the model’s bias and to provide equal distribution among subgroups covering 3 age ranges (40–49 years, 50–59 years, and 60 years and over) for all three categories (normal, prediabetic, and diabetic). Overall, 11,594 pectoral muscle-containing images were entered into the model. Numbers belonging to all subgroups are shown in Table 1.
Table 1 Modified dataset: pectoral muscle containing image numbers per subgroupThe pectoral muscle images were cropped to include only the pectoral muscle. The cropped images were separated into three different categories (normal, prediabetic, and diabetic) according to the patients’ HbA1c levels and saved. These three categories formed the necessary dataset to train, evaluate, and test the AI model’s ability to distinguish between the groups. Our model determines the patients’ DM status (normal, prediabetic, or diabetic) by evaluating the density of the pectoral muscle.
Artificial intelligence modelThe modified dataset was split into 85% for training and 15% for testing the model’s performance, providing a clear separation for training and evaluation. The images mentioned above were used as the initial data and increased using data augmentation techniques, as a data replication/improvement method. Data augmentation was applied using the ImageDataGenerator from Keras with horizontal and vertical flips and rotation (-10, + 10 degrees). This was specified in the datagen object: ImageDataGenerator (horizontal_flip=True, vertical_flip=True). The techniques employed increased the diversity of the dataset and impacted the model’s accuracy positively. To further detail the deep learning methods for this image classification problem, convolutional neural networks (CNN) were used. Ready-made architectures that have proven successful in this field were taken, retrained to be used in our problem, and the model weights were updated.
The artificial neural network architecture we used was EfficientNetB5, which was adapted to our current classification problem. EfficientNet was developed by Google AI in 2019. When tested on ImageNet, a large visual database designed for visual object recognition software research, enterprise security architecture was found to produce classification models with faster and higher accuracy rates than other architectures because of its system for almost optimal scaling (Google Research, 2019). Figure 2 shows a comparison of success rates on ImageNet with other popular pre-trained architectures. As shown in this figure, EfficientNet models achieve higher accuracy and better efficiency with fewer parameters than current CNNs.
Fig. 2
Comparison of EfficientNet and other ESA models’ success rates
The EfficientNetB5 architecture was used for transfer learning and adapted to the specific classification problem of normal, prediabetic, and diabetic classes. At the end of the architecture, the SoftMax function was chosen as the activation function for multi-class classification problems. Labeled images belonging to three classes (normal, prediabetic, diabetic) that underwent data augmentation and were resized to (224, 224) were separated into training and testing sets. Examples of images fed into the model after the cropping and resizing processes are shown in Fig. 3.
Fig. 3
Examples of images that enter the model after cropping and resizing
The model training process was initiated using the parameters shown in Fig. 4. Training parameters, including the learning rate, were selected based on the architecture’s characteristics and best practices.
Fig. 4
During the model’s training process, Google Colab was used, which is specifically designed for machine and deep learning and has professional resources to obtain fast results, including NVIDIA Tesla T4 GPU and 27.3 GB RAM (Fig. 5).
Fig. 5
Details and information on Google Colab GPU and RAM
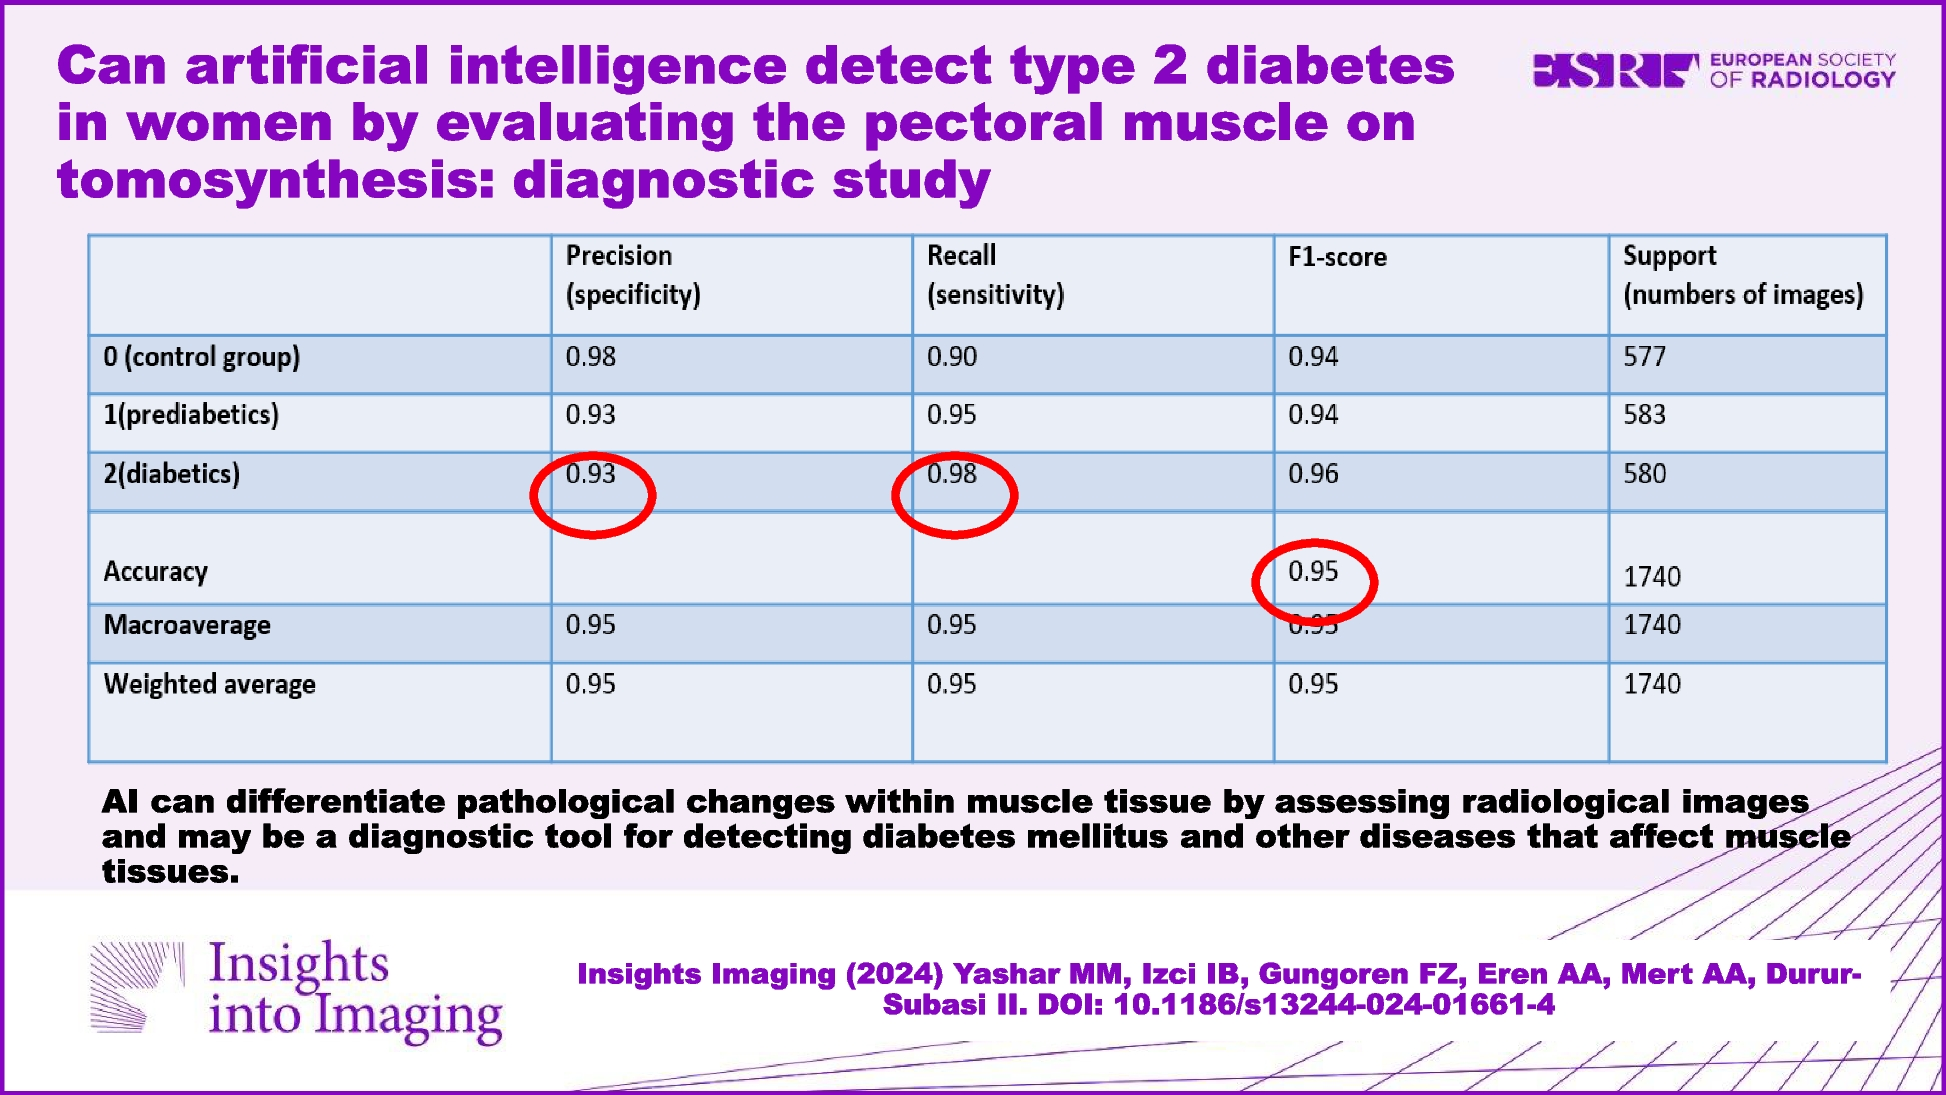
The validation process was present in the code using the validation data parameter in the model fit generator function. The validation data was provided as (x_val, y_val). However, details about external validation or a more comprehensive validation strategy were not explicitly mentioned in the provided code. The code includes the hyperparameter tuning for the learning rate (lr) using ReduceLROnPlateau. The learning rate is adjusted based on the validation loss. The code incorporates the model training, saving, and evaluation outcomes using the “Classification eport” from “scikit-learn,” providing metrics such as precision, recall, and F1-score for each class. We used these performance indicators to track the progress of our AI model. The priority was given to the accuracy rate. The accuracy rate is described as the ratio of the correctly predicted areas in the model to the total dataset. While the current code focuses on accuracy, precision, recall, and F1-score, additional metrics like area under the receiver operating characteristic curve (AUC-ROC), positive predictive value (PPV), and negative predictive value (NPV) were also calculated.
留言 (0)