
記住我


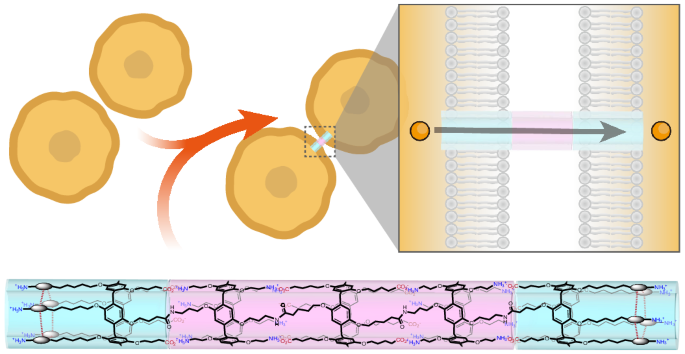

In this work, we explore the ability of a neat water-lean solvent to self-assemble into clusters with a shielded reactive site that enables atypical CO2 capture adduct (Fig. 1d) formation under mild conditions (temperature, T ≤ 313 K; CO2 equilibrium pressure, P < 15 bar; Fig. 1b). Single-component water-lean solvents, such as N-(2-ethoxyethyl)-3-morpholinopropan-1-amine (EEMPA, E), have emerged as promising for post-combustion CO2 capture. EEMPA has a higher solvent energy efficiency22 and lower capture costs23,24 than aqueous amines25 or two-component formulations in the peer-reviewed literature26,27,28,29,30,31,32. EEMPA and its diamine analogues were initially designed to form a stable intramolecularly hydrogen-bonded carbamic acid and adopt a folded hairpin structure33. Until now, experimental data could not support the formation of a carbamic acid under processing conditions (partial pressure p*(CO2) < 0.15 bar). Here we posit an alternative hypothesis, where the properties of EEMPA are directly related to its intermolecular self-assembly rather than intramolecular folding (Fig. 1b) after chemically fixing CO2. This is supported by the recent observation that water-lean alkoxyguanidines34,35,36,37 display a heterogeneous structure of aggregated ions upon loading (Fig. 1f). This spontaneous nanostructure formation may provide confined (re)active sites, likely explaining how E successfully performs the integrated capture and conversion of CO2 into fuels and chemicals including methanol38 and methane39.
NMR-based identification of molecular and supramolecular speciationTo elucidate the molecular features of CO2 capture by E and identify the supramolecular interactions during self-aggregation, quantitative 1H and 13C NMR spectra were recorded on a series of samples of neat E mixed with increasing molar ratios, x0, of CO2. Two sets of signals in slow exchange at the NMR timescale were observed. The signals correspond to free ammonium/amine and carbamic acid/carbamate pairs (respectively notated as E(0)(+) and E(1)(–); Supplementary Tables 1 and 2 for nomenclature), the former converting to the latter throughout CO2 absorption (Fig. 2a and Supplementary Figs. 12–17). Accurately quantifying both species produced the loading, α, that is, the molar fraction of CO2 effectively bound by E. Complemented at low x0 values by vapour–liquid equilibrium measurements (Supplementary Fig. 2)22, these data (Supplementary Fig. 5 and Supplementary Table 6) allowed us to plot the CO2 binding isotherm with its sigmoidal profile, typical of cooperative systems (Fig. 2b and Supplementary Figs. 10 and 11)7,8. Initial partial pressures of up to 70 bar CO2 (5 equiv. CO2 versus E) were required to reach a final α of almost 1, well above the 0.5 CO2 per EEMPA in unpressurized flue gas14. Under the studied experimental conditions, slow CO2 absorption by E, whose viscosity increases slightly, eventually leads to equilibrium pressure values no higher than 15 bar (Supplementary Figs. 6 and 47) and water content no higher than 700 ppm (an H2O:EEMPA molar ratio of <1:120). During loading, NMR peaks of both E(0)(+) and E(1)(–) underwent noticeable chemical shift perturbations (Supplementary Figs. 22–25) due to fast protonation and self-aggregation phenomena. Chemical shift perturbation mapping40 (Fig. 2a) and monitoring41 (Fig. 2c) confirmed that protonation occurred first on the most basic site (the secondary nitrogen atom of E(0); Supplementary Figs. 1 and 4), as expected, and then unexpectedly on the least basic site (the carbamic oxygen of E(1); Fig. 2c, inset). Together, these observations can be translated into a two-stage molecular scenario (Fig. 2d). Below partial pressures in CO2 of 1 bar, neat E(0) yields an equimolecular mixture of charged ammonium E(0)+ and carbamate E(1)–, which convert into pure carbamic acid E(1) upon gentle pressurization (equilibrium partial pressure p*f(CO2) < 20 bar; Supplementary Fig. 7). A convergent set of evidence (strong shielding of the carbonyl carbon42 and strong deshielding of the hydroxyl proton11 peaks in 13C and 1H NMR, respectively; Supplementary Figs. 15 and 17) supports the presence of this elusive adduct. The data indicate that carbamic acid formation begins at unexpectedly low loading values (around 0.3; Fig. 2c, inset). Experimental data, which encompass chemical shift perturbations Δδ(i), chemical loading values α and molar ratios x0, were fitted with a MATLAB in-house script (see Supplementary Fig. 3 for numbering i of each proton and carbon). Data processing provided the equilibrium binding constants of the two-stage covalent process and values of the chemical shifts δ(i) of the individual E(0), E(0)+, E(1)– and E(1) adducts (Supplementary Figs. 26 and 27). Interestingly, a conventional dimeric model (Fig. 2d) could not be reliably fitted to the experimental data (in particular the 13C chemical shift perturbation of the carbonyl group of E(1)(–); Fig. 2c, inset) in the absence or presence of an additional E(1)–E(1) dimerization equilibrium. Of all scenarios involving higher aggregates, the tetrameric model (Fig. 2g) provided the best match with the full set of experimental data (Fig. 2b,c, Supplementary Figs. 10, 11 and 22–25 and Supplementary Table 7).
Fig. 2: Tetrameric model based on EEMPA–CO2 constituents.
a, Chemical shift perturbation mapping from q13C NMR analyses on E(0)(+) and E(1)(−) (colour code reflects chemical shift perturbation amplitude; pKa1, pKa of the secondary amine; pKa2: pKa of the tertiary amine; pKa3: pKa of the carbamic acid). b,c, Fitting of the α and Δδ(i) values with increasing CO2/EEMPA initial molar ratio x0 by the dimeric E2 and tetrameric E4 models (dot, experimental; dashed line, model; R2α, R2δ and R2CO are root mean squared deviation values for α, δ(aliphatic) and δ(CO), respectively; DMF, N,N-dimethylformamide). d, The two-stage loading process of E(0) by CO2 yielding adducts E(0)+, E(1)– and E(1). e, CO2-binding Gibbs free energies (ΔG°DFT; filled bars), entropies (TΔS°DFT; empty bars) and enthalpies (sum) obtained from DFT and the thermodynamic model (ΔG°NMR; circles). f, The resulting speciation (x(i), the molar fraction versus α, the CO2 loading; vertical dotted line, loading selected for classical molecular dynamics modelling). g, Notation and schematic representation of oligomers and monomeric constituents.
Thermodynamic analysis of self-assembly and CO2 absorptionThe full picture of the covalent adduct and non-covalent cluster populations, or chemical speciation, could be simulated after parameter adjustment through fitting the NMR data. Figure 2f,e shows the speciation and Gibbs free energies of CO2 absorption for each successive tetramer E4(α), respectively (ΔG°DFT, DFT-computed Gibbs free energy; ΔG°NMR, Gibbs free energy computed from NMR data; TΔS°NMR, entropic contribution from NMR data). This information, derived from a thermodynamic model, is fully consistent with the experimental observations. Simulations (Fig. 2e, yellow curve), in agreement with NMR data (Fig. 2c), show that carbamic acid is a key component of the cluster E4(0.75) that emerges as loading reaches 0.3. Although EEMPA displays clustering similarly to haemoglobin, its stepwise CO2 capture is negatively cooperative (Fig. 2e), with a drop in Gibbs free energy of ~7 kJ mol–1 between the first, second and third binding steps. The free energy reduction explains why pressurization is needed, despite the thermodynamic stabilization provided by tetrameric self-assembly. Energies and structures of each covalent species, E(0), E(0)+, E(1)– and E(1), as well as of their dimeric and tetrameric clusters were assessed by density functional theory (DFT) calculations with an implicit model of the EEMPA–CO2 medium43. This approach provides a good estimation of energies, which can be further refined by explicitly taking into account the molecules surrounding the computed structures. This preliminary campaign was complemented with classical molecular dynamics simulations. Thermodynamic data of the non-covalent (dimerization and tetramerization) and covalent processes (CO2 capture) were obtained from the DFT-computed energies and compared to experimental measurements to assess the modelling results. Although sizeable differences between computed and experimental enthalpies and entropies are expected, leading to large deviations between Gibbs free energies, good agreement was found for the covalent capture of CO2 by the tetramers (Fig. 2e and Supplementary Fig. 44).
Computed enthalpies of CO2 absorption by tetramers at low loading (α = 0.07–0.22) perfectly match values derived from prior vapour–liquid equilibrium measurements on EEMPA (–79 versus –75 kJ mol–1)22, further supporting our tetrameric model (Supplementary Figs. 32 and 41). The computed entropies of CO2 capture by the tetramers (Supplementary Figs. 33 and 42) match the order of magnitude of values of aqueous amines44,45. With the exception of the first capture step (–200 J mol–1 K–1), these entropies are relatively constant along the loading process (~150 J mol–1 K–1). This agrees with the first capture reaction of the gaseous reactant being accompanied by the tetramerization of E, while subsequent absorption steps involve only the loss of translational and rotational freedom of the gaseous reactant. We experienced the limits of the DFT method while assessing the entropy of all non-covalent pairing processes (2E → E2 and 2E2 → E4; Supplementary Figs. 33, 36 and 39). Though the calculations confirmed that higher aggregates are systematically enthalpically favoured (Supplementary Figs. 32, 35 and 38) regardless of loading, enthalpy values were compensated for by overestimating computed entropies, leading to low positive Gibbs free energies of tetramerization46. This predicted endergonicity for dimerization and tetramerization (Supplementary Figs. 34, 37 and 40) is imputed to the limitation inherent to the solvent model. In fact, classical molecular dynamics simulations (1 μS trajectory) of the E/CO2 system at 298 K and 0.25 loading showed the coexistence of the E4(0.25) and E4(0.50) tetramers (defined by dominant hydrogen bonds; Supplementary Fig. 46) in proportions (18% and 22% of the whole system, respectively) that qualitatively agree with the NMR-data-derived MATLAB model. Complementary evidence supporting the existence of CO2-rich tetramers such as E4(0.75) and E4(1) was provided by Fourier transform infrared and wide-angle X-ray scattering (WAXS) spectroscopies (vide supra). Static DFT calculations confirmed that non-covalent clustering acts as a genuine thermodynamic driving force, stabilizing covalent adducts enthalpically by around 15 kJ mol–1 compared to the isolated species (Supplementary Figs. 32 and 35). Calculations revealed that combining unloaded E(0), partially loaded E(0)+E(1)– and fully loaded E(1) into clusters opens the door to a broad range of absorption enthalpies during CO2 capture (with values decreasing between from –80 to –20 kJ mol–1 along the E4(0)–E4(0.75) series; Fig. 2e), far beyond those observed on solid absorbents9. Consequently, clustering empowered by water-lean solvents may allow chemists to choose the thermodynamic features of the capture and release cycle on demand by setting the loading range, and thus selecting the active tetrameric species.
Structural analysis of the E4 clustersGiven the level of agreement with experimental data, DFT modelling could be exploited to gain insights about the non-covalent interactions (Figs. 3c,d and 4c) that govern self-assembly and the structural features of the tetrameric clusters (Figs. 3a and 4a and Supplementary Fig. 45). The self-assembly of subunits E(0), E(0)+, E(1)– and E(1) is driven by a network of hydrogen bonds between the amine, ammonium, carbamate and carbamic acid polar head groups that form the tetrad at the core of the re(active) site. Low-loading tetramers E4(0) and E4(0.25) result from packing unfolded E(0) (E(0)+ and E(1)–) into cylindrical bundle-like tertiary structures, where the basic moieties of the (re)active site are buried and poorly accessible. In E4(0.5), the E(0)+ and E(1)– subunit chains individually fold into turns, with the polyether moieties gathered in one hemisphere (Fig. 3a). As a result, the tertiary structure of E4(0.5) is a half ovoid, exposing the square planar hydrogen-bonded (re)active site (Fig. 3b,c). Incorporation of an additional CO2 molecule leads to dramatic structural changes, both locally and globally (Fig. 3a,d). While carbamic acid formation is accompanied by hydrogen bonding reorganization, the polyether chains remain folded into turns as in E4(0.5). This induces a conformational change of the polar group tetrad from square planar to tetrahedral (Fig. 3b), affecting the orientation of the side chains. Consequently, E4(0.75) adopts a star-shaped tertiary structure with spaced side chains roughly pointing towards the vertices of a cube, shielding the active site from the solution. In E4(1), gathered pairs of ether chains (experimentally confirmed by NMR; Supplementary Fig. 17) yield a flattened figure-eight global structure (Fig. 3a,d).
Fig. 3: Structural analysis of the E4 tetrameric clusters and of their packing in solution.
a, DFT-derived van der Waals surface of dominant tetramers and schematic tertiary structure (distances in nm). b–d, Simplified developed representation of the internal nitrogen-based tetrads (b) and of their hydrogen-bond network and tetramer packing modes (c and d; distances in nm; A, hydrogen-bond acceptor; D, hydrogen-bond donor). e, Stack of WAXS spectra recorded at increasing loading. Q, scattering vector; I, differential scattering cross-section per unit volume. Insets show zoomed-in views. f, Evolution of periodicity δ and correlation length ξ with loading. Data are presented as mean values. Details on error bar calculation are in the Supplementary Methods.
Fig. 4: Mechanism of carbamic acid formation involving anhydride intermediate within E4 clusters.
a, Zwitterion-mediated hypothetical carbamate to carbamic acid conversion pathway (path 1, steps 1–3; E4(0.5)N and E4(0.75)Z are neutral and zwitterionic intermediates, respectively). b, The q13C NMR carbonyl signal evolution upon CO2 loading above ambient pressure (step 4, bottom to top; * marks the additional CO signal from the anhydride). c, DFT-derived enthalpies (ΔH) of E2 and E4 clusters involved in the zwitterion-mediated (path 1, steps 1–3) and anhydride-mediated (path 2, steps 4–5 and 6–7) pathways. d, TMSCHN2 derivatization of 13C-labelled E(2)– into E(2)Me (schematic on top and snapshot of the carbonyl region of the 13C NMR spectrum on the bottom). e, Proposed mechanistic pathway. The asterisk marks a carbamic anhydride-containing intermediate.
Fourier transform infrared spectroscopy experimentally confirmed the presence of EEMPA clusters at high loading. While the conversion of ammonium carbamates to carbamic acid dimers is generally accompanied by a marked increase in the stretching frequency of the carbonyl signal47,48, the observed decrease (Supplementary Fig. 28) agrees with reports about higher carboxylic aggregates (Supplementary Fig. 29)13. WAXS analysis provided a second set of experimental evidence for the tetrameric clusters and information about their morphological features in pressurized and unpressurized conditions (Fig. 3e). The Q region (where Q is the scattering vector) exhibits a CO2 loading-dependent structure factor fit using the Teubner–Strey model49,50,51. The model qualitatively describes the segregation between the polar reactive moieties and ethoxyethyl and morpholinopropane arms encountered in the tetramers particularly well. The presence of this polar core provides the required electron density contrast and enables the observation of molecular-scale phase segregation at a CO2 loading above 0.6. The lack of phase segregation at lower CO2 loading values may be ascribed to the solution composition, which includes several tetramers (E4(0.25) to E4(0.75)) with differing morphologies poorly adapted to regular and dense packing. WAXS was used to probe the dimensions of these micelle-like clusters and their polar cores. The measured cluster dimensions, including a tetrad correlation length (ξ) of 5.8 Å and periodicity between adjacent tetrads (δ) of ~11.8 Å, quantitatively match with the DFT results (Fig. 3f and Supplementary Figs. 30, 31 and 45). The WAXS analysis also shows a cubic bicontinuous phase based on the head-to-hip packing of CO2-saturated tetramers (Fig. 3c,d). The WAXS data provide additional experimental evidence for the formation of tetramers, agreeing with the NMR-based speciation and DFT modelling.
Anhydride-based mechanism of CO2 captureThe molecular mechanism leading to the formation of carbamic acid-containing clusters was explored by a coupled experimental (NMR of neat pressurized samples) and theoretical (DFT calculations) approach. In the classical zwitterion model, the first CO2 addition proceeds via a carbamic acid intermediate, which converts into ammonium carbamate upon deprotonation by a second amine52. In this framework, carbamic acid can be produced only from a neutral amine precursor. In our system, carbamic acid-containing species E4(0.75) and E4(1) arise from E4(0.5) via a stepwise CO2 absorption. We expected that forming carbamic acid from the E4(0.5) ammonium carbamate tetrad would first require an energetically uphill proton transfer from the nitrogen atom of one ammonium group to a neighbouring carbamate oxygen (Fig. 4a, step 1). The free amine centre of the unstable intermediate E4(0.5)* would then bind to a third CO2 molecule (Fig. 4a, step 2), generating the zwitterion E4(0.75)z that would relax into E4(0.75) (Fig. 4a, step 3).
We exploited the viscosity increase that accompanies CO2 uptake by E4(0.5) to slow the decay of the elusive intermediates involved in the formation of E4(0.75) and E4(1). In practice, an EEMPA sample was overpressurized with CO2 (α = 0.8–1 range) until equilibrium was attained and then transferred into an NMR tube with a headspace under 1 bar of CO2. The quantitative 13C (q13C) NMR spectra were immediately recorded over time once the transfer was complete. The monitored phenomenon is governed by slow mass transfer within the viscous medium. It corresponds to the stripping of E4(0.75) back into E4(0.5) and gaseous CO2 through the intermediate(s) species. Examining the stack of spectra recorded over time in reverse order (from the end to the beginning of the experiment; Fig. 4b, bottom to top) provides a sequence of snapshots of the intermediate states encountered during the E4(0.5) + CO2 → E4(0.75) absorption step (step 4; Fig. 4c,e). While the NMR signals of the aliphatic backbone for both E(0)(+) and E(1)(–) match those recorded at the same loadings at equilibrium (Supplementary Figs. 47 and 48 versus Supplementary Figs. 12–15), the carbamate signal displays a shouldered peak at high loadings (Fig. 4b and Supplementary Fig. 49). Relative integration of the signals corresponding to CO2-bearing versus CO2-free species in this loading range indicated that the CO2-bearing species is bound to more than one CO2 molecule on average.
To identify this carbamate-like intermediate species, we attempted in situ trapping via alkylation with trimethylsilyldiazomethane (TMSCHN2), previously employed for carbamate to urethane conversions53. To our surprise, traces of the methyl carbamic anhydride of EEMPA, notated as E(2)Me, could be directly detected by 13C NMR in the crude mixture (with 0.5 equiv. TMSCHN2; Supplementary Figs. 52 and 53). To confirm this observation and isolate the intermediate, CO2-free EEMPA was premixed with 1 equiv. TMSCHN2 and pressurized with CO2. Remarkably, E(2)Me formed at up to 37% conversion from the crude mixture. An analytically pure (99.5%) sample was recovered in a 24% isolated yield after column chromatography and characterized by mass spectrometry (Supplementary Figs. 63–65) and NMR spectroscopy (Fig. 4c and Supplementary Figs. 54–57). To further confirm the structure of this intermediate, the analogue E(2)tBu (tBu, tert-butyl) was synthesized ex situ from E with di-tert-butyldicarbonate54,55,56,57. Thus, we could compare the 13C NMR pattern of the intermediate trapped in situ with the spectra of these derivatives and unambiguously confirm the identity of E(2)Me. The most characteristic feature is the set of two doublets around 150 ppm in 13C NMR observed for both E(2)Me and E(2)tBu (Supplementary Figs. 55, 58, 61 and 66). This pattern is indicative of a non-symmetrical bis(carbonyl) system split given the bulkiness of the capping end group (tBu versus Me), explaining the slight difference in splitting patterns observed between the adducts (Fig. 4d).
DFT calculations confirmed that the anhydride intermediate is strongly stabilized within the reactive site of the tetrameric reverse-micelle-like clusters and favoured over the conventional zwitterion intermediate (Fig. 4a,c,e; Supplementary Figs.
留言 (0)