
記住我


This study was approved by Cincinnati Children’s Hospital Medical Center Institutional Review Board prior to study initiation. Written informed consent of subjects was waived by the Institutional Review Board for the following reasons: (1) All information was retrieved from existing medical records; there was no direct patient contact. (2) The study involves no more than minimal risk—No testing, time, risk, or procedures beyond those required by routine case were imposed on patients as a result of this study. (3) No data beyond that collected in the course of routine care were collected for this study and (4) it was not be possible to contact all patients as the study comprised a large time span. Patients may have been lost to follow-up or deceased. The study was conducted in compliance with the Health Insurance Portability and Accountability Act of 1996 (HIPAA) standards.
A retrospective review of Picture Archiving and Communication Systems (PACS) database was performed to identify pediatric and young adult subjects with normal cardiac anatomy on cross-sectional imaging. The imaging types included chest CT with contrast (CT-WC) and without contrast (CT-WO). Subjects with incomplete capture of cardiac structures or any clinically identified cardiac abnormality including nonspecific chamber dilation were excluded. To measure the performance of the model in heart transplant candidates, additional subjects with heart disease listed for heart transplant were included for testing. This included both subjects with cardiomyopathy (CM, Common Data Element Code C34830) and congenital heart disease (CHD, Common Data Element Code C95834). Demographic data were collected via chart review including age, sex, weight, height, diagnosis, and surgical history. Body surface area (BSA) and body mass index were derived from subject height and weight [12].
CTs were performed on an Aquillon One CT scanner (Canon Medical Systems, Otaware, Japan) between January 1, 2010, and January 1, 2020. There was variable slice thickness of the scans (range 0.5–1 mm), but most commonly 0.5 mm. CT-WC exams included both angiograms and delayed contrast images. CTs were performed as either helical or cone-beam acquisition. Cardiac gating was not routinely performed for all scans. The predominant scan acquisition was “Chest CT,” however, CT with an anatomic range that included neck, chest, abdomen, or pelvis were also included.
Ground Truth SegmentationCross-sectional imaging Digital Imaging and Communication in Medicine (DICOM) data were imported into Mimics 3D visualization software (version 23.0, Materialise, Belgium). De-identification was completed within Mimics and ground truth manual segmentation of the TCV was performed, as previously described [6, 7, 13, 14]. In brief, TCV was defined as the segmented myocardial mass and internal heart chamber volumes bounded at the levels of surgical anastomosis for bicaval orthotopic heart transplantation. The TCV measurements included the border of the myocardial mass to the junction of the superior and inferior vena cavae to the right atrial junction, the junction of the pulmonary veins to the left atrium, and the level of the aortic and pulmonary roots. The segmentation was performed by a single observer (NAS) with 7 years of segmentation experience. For diseased hearts with atypical anatomy (i.e., Fontan), the TCV segmentation likewise included the entirety of the cardiac mass that would be explanted at time of heart transplantation. Interobserver variability of this segmentation method has previously been reported on as highly reliable [14].
Export of Segmented MasksThe Mimics files were de-identified prior to export. The Mimics AI Assistant Plugin (Beta Version) was used to export raw data as NRRD (Nearly Raw Raster Data) file format. Both the raw imaging data and the ground truth segmentation files (i.e., TCV mask) were exported. The NRRD files were then imported into a custom-built DenseNet Deep Learning (DL) architecture described below. No resampling or normalization operations were used.
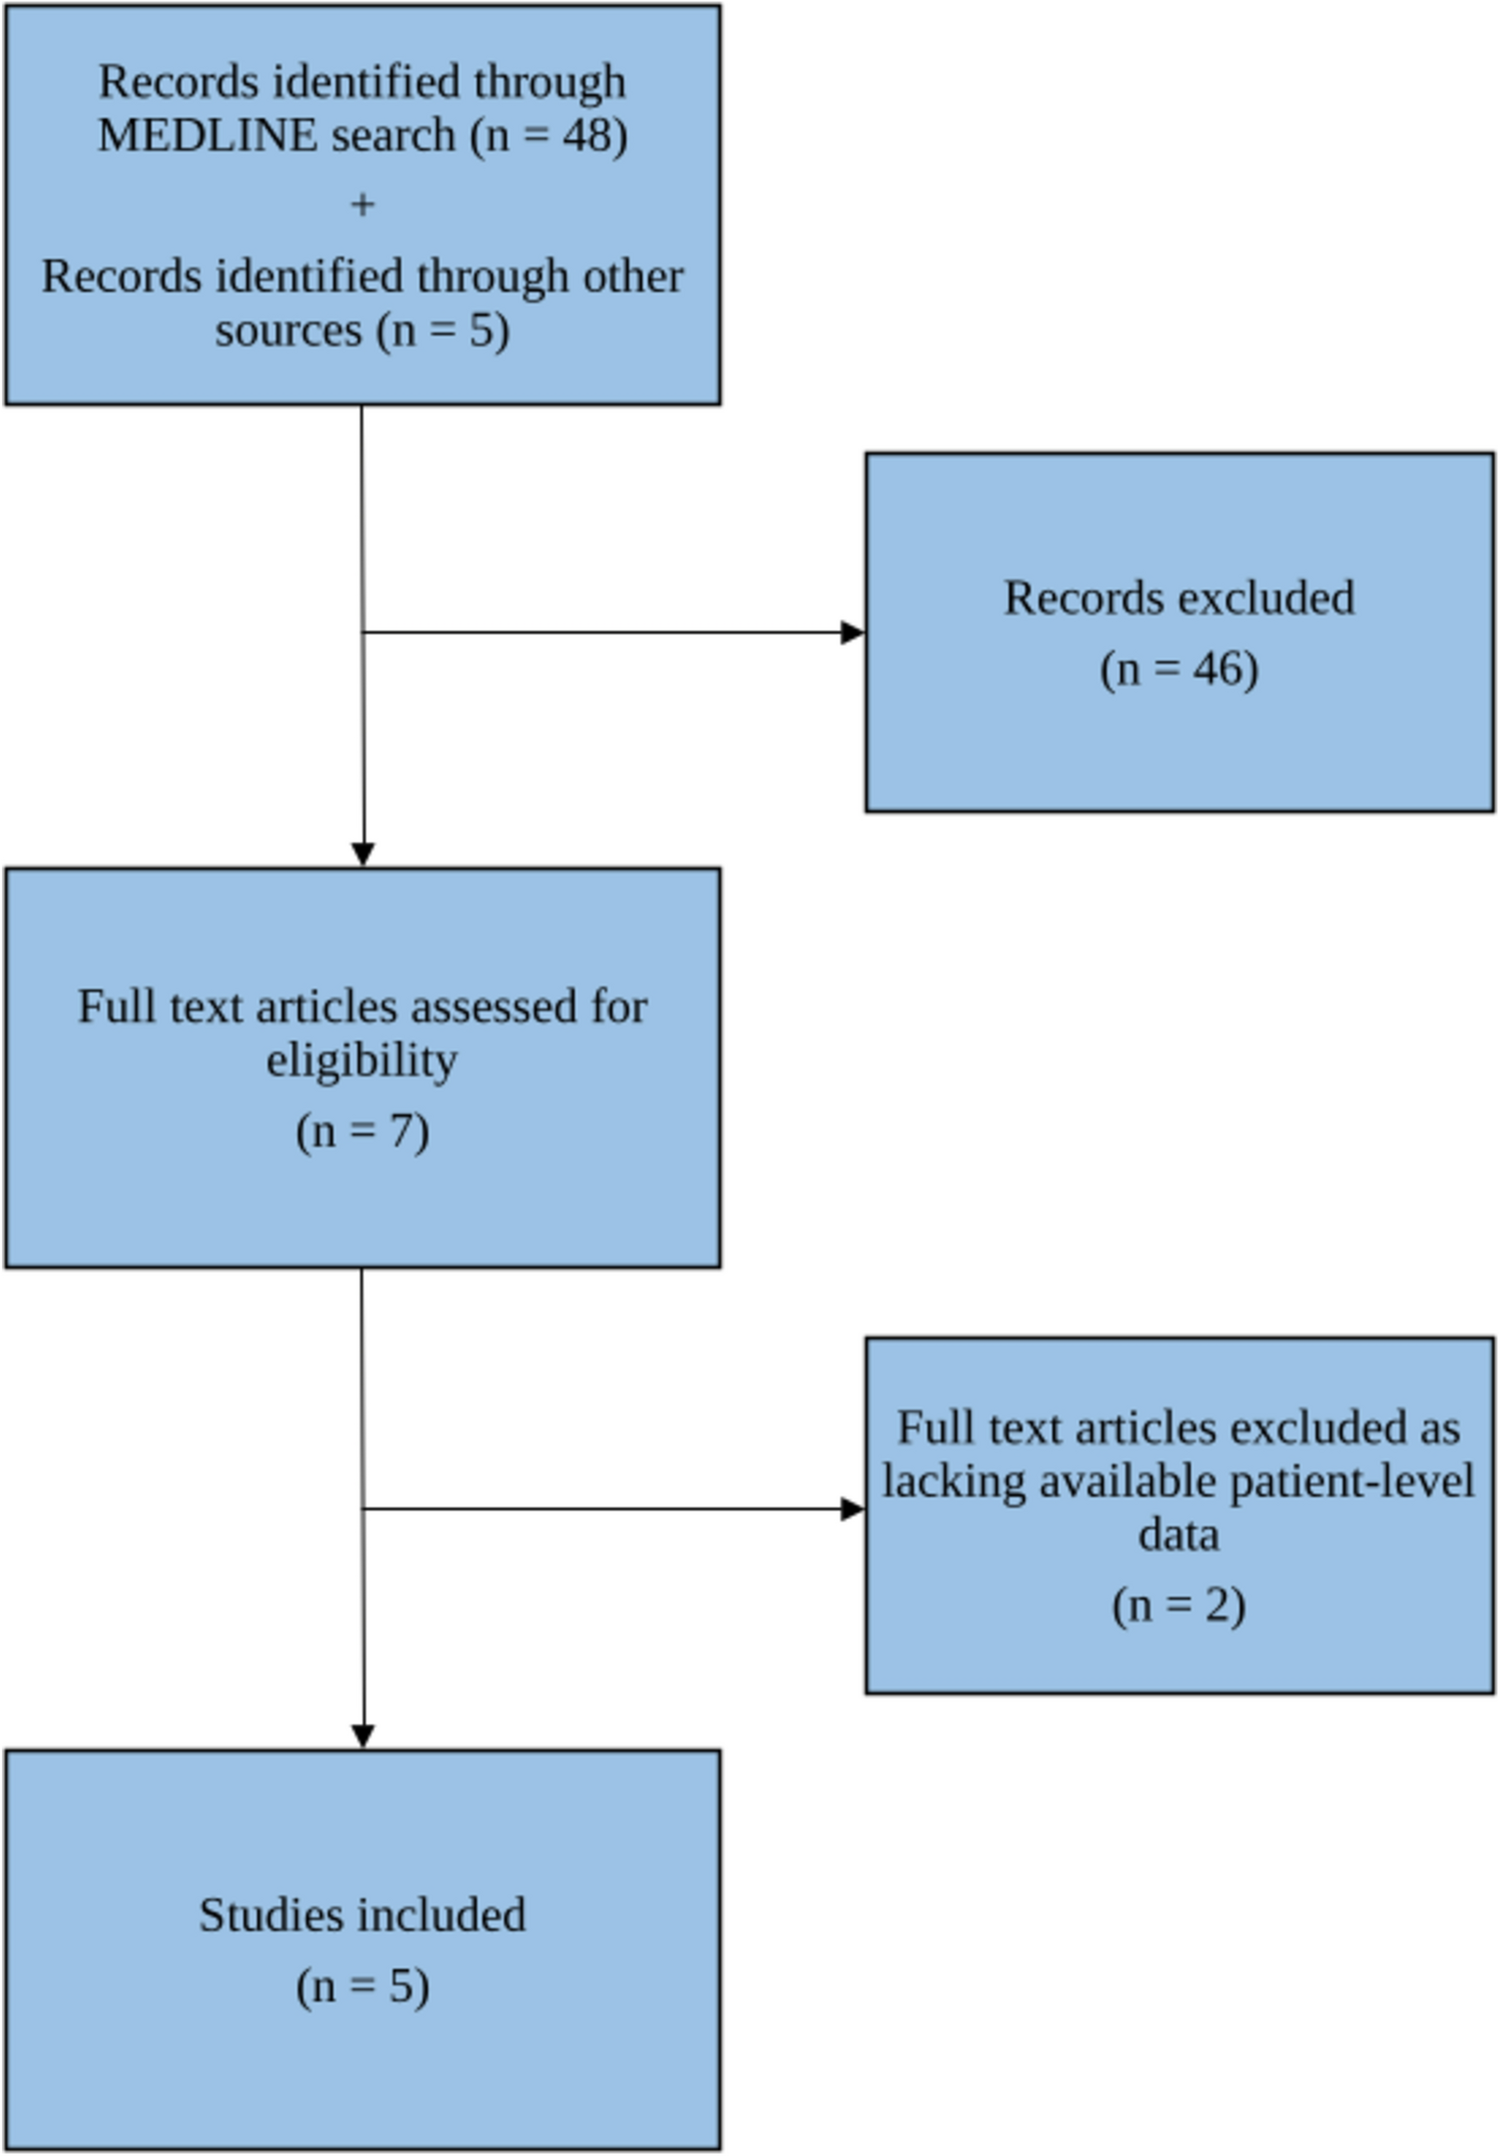
Training/Validation SetsThe dataset was split into a training set (n = 270, 86%) and a validation set (n = 44, 14%). The validation cohort was sized to fairly assess imaging and subject characteristics that may influence model accuracy such as the presence of contrast, age, weight, and sex.
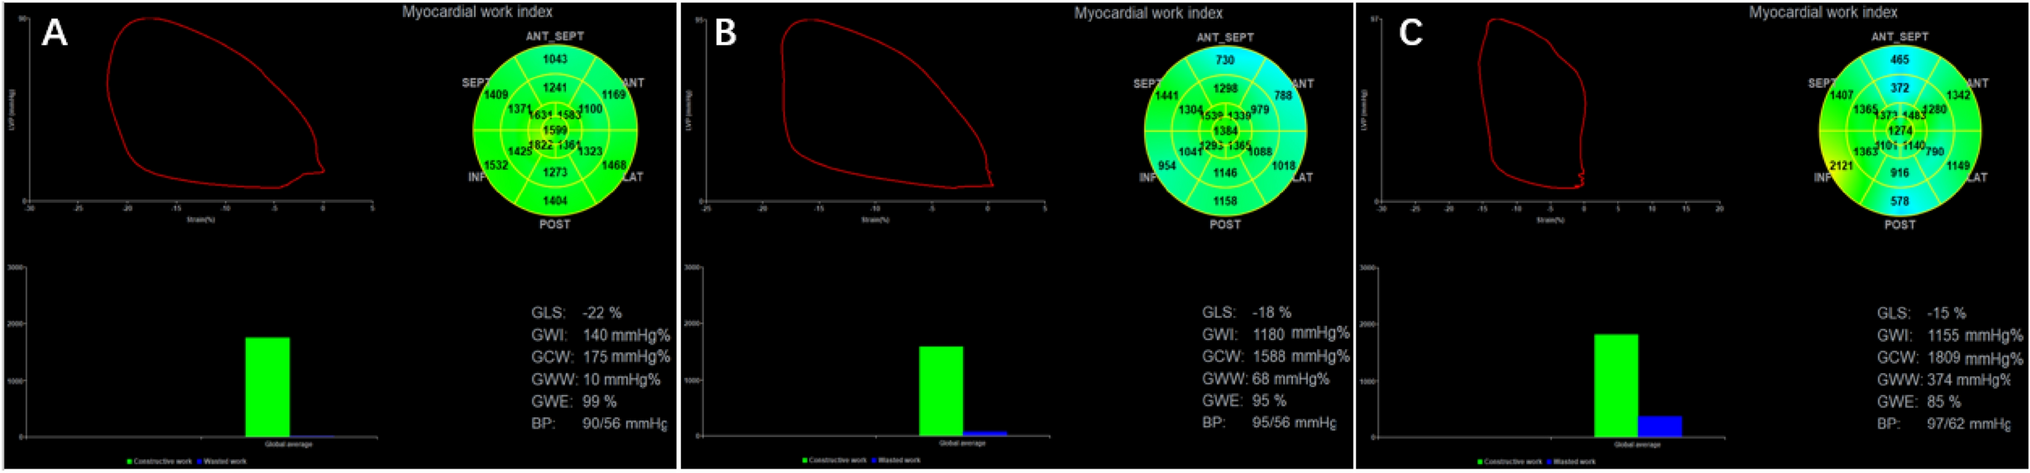
Deep Learning Model TrainingThe DenseNet architecture consists of an encoding section followed by a decoding section (Fig. 1a). In the encoding section, spatial information is mapped to feature space by convolutional blocks (blue). In each encoder convolutional block, an image's spatial volume is reduced, while the feature space volume increases. During decoding, deconvolution blocks concatenate features from the previous block and features from the encoding leg to generate the output mask.
Fig. 1
Deep learning architecture components. A DenseNet encoding section precedes the decoding section. B ResNet architecture maximized cross connections between convolutional layers preserving the gradients for small features throughout the pipeline. C Sigmoid activation of the final decoder block’s output is fed into a final convolutional layer for multi label object segmentation. TCV Total Cardiac Volume
For maximum accuracy, the convolution/deconvolution blocks are based on the DenseNet architecture which preserves the gradients for small features throughout the pipeline (Fig. 1b). The DenseNet architecture incorporates maximum cross connections between the blocks’ convolution layers. Each convolutional/deconvolutional layer within a block is followed by a batch normalization and ReLU activation.
A final max pooling of the block's output is performed before continuing to the next block. Sigmoid activation of the final decoder block’s output is fed into a final convolutional layer for multi label object segmentation (Fig. 1c). DenseNet model training is conducted using ground truth masks generated from training CT images. Model weights are adjusted by batch using the Adams Optimizer with a loss function equal to 50% Dice Loss and 50% Cross Entropy Loss.
Statistical AnalysisDemographic and clinical characteristics were described using means ± standard deviation for continuous variables and frequencies (percent) for categorical variables. Independent samples t-tests were used to test for differences in normally distributed, continuous variables and Wilcoxon rank-sum tests were used to test for differences in non-normally distributed, continuous variables. The accuracy of the deep learning model was evaluated with the Dice similarity coefficient (DSC), a statistical tool measuring the intersection of voxels of the ground truth and deep learning derived datasets. The deep learning derived and manually derived TCV segmentation was also used to calculate total cardiac volume. Mean Absolute Percent Error (MAPE), rather than absolute error, was used to compare accuracy of deep learning and manual TCV to allow parity of across the pediatric age range and size. The Fisher’s exact test was used to test for differences in categorical variables. Comparison of normally distributed continuous variables was performed using Pearson correlation. One-way Analysis of Variance (ANOVA) was used to test for differences in continuous variables across three or more groups. Tukey’s post hoc test was used for pair-wise differences between groups.
留言 (0)