
記住我


Data for this post hoc analysis were from the DELIVER clinical trial (NCT04418765)—a multinational, phase 3b, randomized, double-blind, placebo-controlled study that explored the safety and efficacy of eptinezumab treatment in patients with migraine and 2–4 prior preventive migraine treatment failures [15]. Conducted from June 1, 2020, to October 7, 2021, the placebo-controlled portion of DELIVER tracked patient change from baseline in MMDs over 24 weeks, after receiving up to 2 doses of eptinezumab (100 mg or 300 mg) or placebo [15]. Eptinezumab administration via intravenous infusion occurred at baseline (day 0) and Week 12 [15]. The primary endpoint was the mean change from baseline in MMDs over Weeks 1–12; secondary endpoints were PI-MBS, Patient Global Impression of Change (PGIC), and changes in the frequency of canonical symptoms [2].
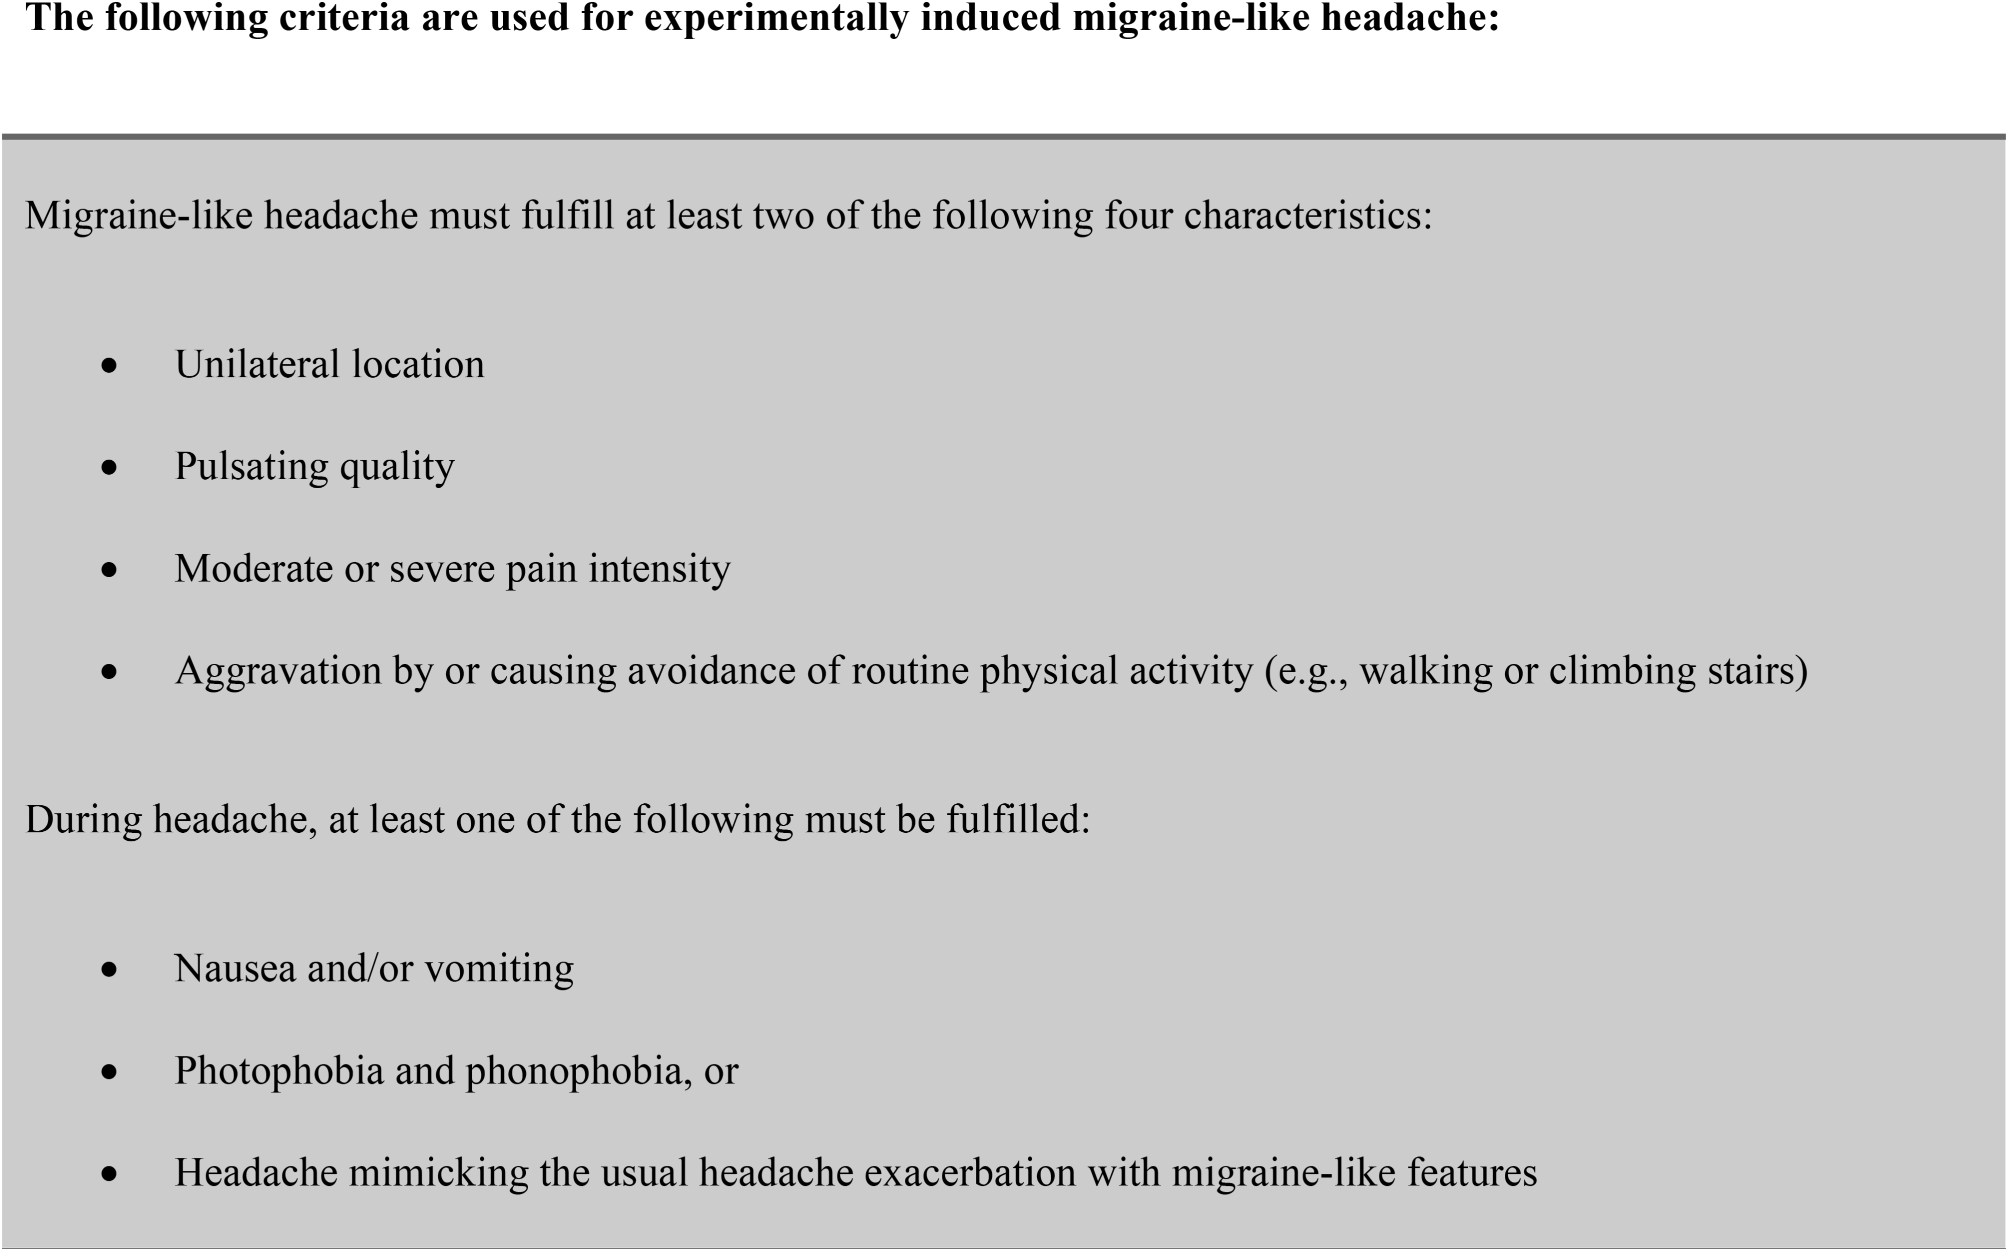
For each headache episode throughout the study, patients were to complete an electronic diary recording the headache episode start/stop date/times and the characteristics used for classifying headache episodes as migraine attacks (i.e., canonical symptoms). Based on International Headache Society guidelines [7], migraine days were study days that met one of the following criteria: the patient had a headache that lasted ≥4 hours and met International Classification of Headache Disorders, 3rd edition (ICHD-3) criteria C and D for migraine without aura; the patient had a 30-minute or longer headache and had migraine with aura; the patient had a 30-minute or longer headache that met two of the three ICHD-3 criteria B, C, and D for migraine without aura (probable migraine); or the patient believed they had a migraine and thus took acute migraine medication [15]. Migraine attacks are single continuous events and can last more than 24 hours. To determine if headache episodes were migraine attacks, the headache diary asked patients whether they experienced the canonical symptoms of migraine, as defined above [2].
The PI-MBS is a patient-reported outcome measure in which patients are asked to describe their most bothersome symptom at the baseline visit, which is then categorized by investigators into eight predefined symptom classes (nausea, vomiting, sensitivity to light, sensitivity to sound, mental cloudiness, fatigue, pain with activity, mood changes) or “other” with free text [17]. At 4- to 12-week intervals following identification, improvements in the PI-MBS were rated on a 7-point scale identical to the PGIC scale (“very much worse” [− 3] to “very much improved” [+ 3]). Data from PROMISE-2 showed that improvement scores on the PI-MBS were highly correlated with PGIC scores, and more correlated compared to PGIC scores and the primary endpoint, changes in MMDs [13].
Quality of life was assessed in the DELIVER trial with two instruments: the MSQ and the 6-item Headache Impact Test (HIT-6) [8, 9].
Analytical frameworkWe conducted the mediation analysis with structural equation modeling (SEM), an analytic tool that can consider the inclusion of variables that are not measured directly, but measured through their observable effects, and allows assessment of causal relationships and mediating factors [18, 19]. SEM can be thought of as combining path analysis, which aims at discerning causal pathways, with latent variables. The SEM models in this work had three components: a latent variable (HRQoL) and its related measurements, a treatment effect, and a set of variables mediating the treatment effect on HRQoL. Variables included in this analysis, including the change from baseline in MMDs, were reported monthly for the first 6 months of the trial (Weeks 1–4, Weeks 5–8, Weeks 9–12, Weeks 13–16, Weeks 17–20, and Weeks 21–24), meaning each patient had up to six values post baseline.
Latent variable identificationSEM involved constructing, in this analysis, an HRQoL latent variable, which can be thought of as the study outcome. The rationale for using a latent variable is that HRQoL cannot be directly observed and measured; however, it can be approximated by various measures such as patient-reported outcomes [4, 20]. We started by defining a single latent variable to represent HRQoL and included all individual items of the quality-of-life scales captured in the DELIVER trial as measures of this latent variable. This first model (Model A) included the 14 individual items of the MSQ and the HIT-6. We compared the fit of this model with more restricted versions, Model B including the individual items of the MSQ (excluding the HIT-6), and Model C combining the MSQ items into three domain scores: Role Function–Restrictive [RR], Role Function–Preventive [RP], and Emotional Function [EF] [8]. The latter model was found to have the best fit to data; results are presented in the Online Supplemental Material (see Model Details).
Mediation analysisThe mediating variables were variables that can potentially affect the outcome (i.e., improvement in the HRQoL latent variable) and may be affected by eptinezumab. Potential mediating variables considered in this analysis to explain HRQoL improvement included changes in: MMDs; monthly migraine attacks; proportion of severe migraine attacks; and proportion of migraine attacks with the following canonical symptoms: nausea, vomiting, light sensitivity, aura, aggravation by physical activity, throbbing/pulsating quality, one-sidedness, and sound sensitivity; and PI-MBS. Models with migraine frequency and PGIC instead of PI-MBS as mediator were also analyzed and found to have satisfactory fit statistics, but PI-MBS became the focus of this analysis given its high correlation with PGIC [13] while also encompassing improvement in a symptom specific to migraine.
Initially, all canonical symptoms per ICHD-3 diagnostic criteria [2] for migraine were identified as potential mediators, with the exception of “moderate or severe pain intensity,” which was limited to severe pain for these analyses and is labeled separately. A backwards elimination method (Supplemental Table 1) was used to identify mediators with P-values less than 0.05 for the association with HRQoL (for Models D, E, F, and G, see Model Details in Online Supplemental Material).
These mediators were then included in the final Model 1. Thus, Model 1 (Fig. 1A) variables were: change from baseline in MMDs and changes from baseline in the percentage of monthly migraine attacks with severe pain intensity, nausea, pulsating/throbbing quality, and light sensitivity.
Fig. 1
Structural equation diagrams for (A) Model 1 and (B) Model 2
Shapes: circle = latent variable; square/rectangle = measured variables. Color arrows: green arrows = paths (between variables); blue two-way arrows (between variables) = covariances; gray twoway arrows (variable to itself) = variances
Abbreviations: MMDs, monthly migraine days; MSQ, Migraine-Specific Quality of Life Questionnaire; MSQ-EF, MSQ Emotional Function; MSQ-RP, MSQ Role Function-Preventive; MSQ-RR, MSQ Role Function-Restrictive; PI-MBS, patient-identified most bothersome symptom; QoL, (health-related) quality of life; Sens., sensitivity
Given the hypothesis that HRQoL improvement would likely not be fully explained by Model 1, a second model was developed to include a new mediator representing migraine symptoms, i.e., the change from baseline in PI-MBS. Hence, Model 2 mediating variables were change from baseline in MMDs and change from baseline in PI-MBS (Fig. 1B). Since PI-MBS highlights the migraine-specific symptom that bothers the patient the most (and any improvement in that symptom by definition), all canonical symptoms included in Model 1 were excluded in Model 2. Predefined symptom categories for PI-MBS at baseline included pain with activity, fatigue, nausea, mental cloudiness, sensitivity to light, sensitivity to sound, vomiting, mood changes, and other (with free text) [17]. Because improvements in MMD and PI-MBS and between MMD and canonical symptoms could be correlated, both models allowed correlation between those variables (Fig. 1A and B).
In Models 1 and 2, eptinezumab treatment affected the latent variable (improvement in HRQoL) indirectly through several mediating variables capturing different aspects of treatment efficacy as well as directly (i.e., not otherwise explained by the efficacy mediators explored). The total effect of eptinezumab is the sum of the direct (coefficient of the effect on eptinezumab on latent variable) and indirect effects (multiplying the coefficient of the effect on eptinezumab on mediators by the coefficient of the effect of mediators on latent variable). The analyses were conducted using the average change from baseline during the double-blind period of DELIVER (Weeks 1–24). MMDs and canonical symptoms were analyzed monthly in the DELIVER double-blind period; thus, up to six data points per individual contributed to the average change over Weeks 1–24 in MMDs used in the model. However, PI-MBS and MSQ were captured at Weeks 12 and 24; thus, up to two measurements per individual contributed to the data. No imputations were run for missing PI-MBS, MSQ, or canonical symptoms data as the level of missingness was low (2.5% at 12 weeks and 6.1% at 24 weeks for PI-MBS).
Model estimationModels can only be estimated if they are identified, i.e., there is a sufficient number of observed variables in relation to parameters to be estimated. The number of free parameters to be estimated cannot exceed the number of observed variances/covariances, calculated as p*(p + 1)/2 where p is the number of observed variables. After confirming that models were identified, all models were estimated using maximum likelihood, with the nlminb optimizer. Goodness of fit of the model was evaluated based on the chi-square, comparative fit index (CFI), root mean square error of approximation (RMSEA), and standardized root-mean square residual (SRMR). An acceptable goodness of fit was defined as χ2/df (degree of freedom) < 2.0, CFI > 0.9, RMSEA < 0.05, and SRMR < 0.08 [21].
SoftwareAnalyses were conducted on pooled data from all DELIVER study visits during the double-blind portion of the trial (Weeks 1–24). SEM analysis was completed using the LAVAAN package (0.6–16) for R version 4.3.1.
留言 (0)