
記住我


Data augmentation is a strategy to increase the quantity and diversity of limited data, aiming to extract more useful information from limited data and generate value equivalent to more data. It is a technique with implicit robot automation to automatically expand training data. Aiming at the problem of model overfitting in training deep networks (Krizhevsky, 2009; Simonyan and Zisserman, 2014; He et al., 2016; Krizhevsky et al., 2017; Huang et al., 2019), data augmentation methods attempt to solve the problem from the root cause, namely, insufficient training samples (Wang et al., 2019; Liu et al., 2023). Data augmentation is widely used in text classification (Wei and Zou, 2019; Fang et al., 2022; Wu et al., 2022; Dai H. et al., 2023), image denoising (Eckert et al., 2020; Liu et al., 2020; Luo et al., 2021), video recognition (Cauli and Reforgiato Recupero, 2022; Gorpincenko and Mackiewicz, 2022; Kim et al., 2022), etc. In image recognition tasks, there are content-preserving transformations on input samples, such as rotation, horizontal mirroring, cropping and color jittering. Although these augmentation methods are effective, they cannot perform semantic transformations such as changing the background of an object or changing visual angle. The semantics-preserving transformations which preserve class identity can make data augmentation more powerful (Antoniou et al., 2017; Ratner et al., 2017; Bowles et al., 2018). For example, by training a generative adversarial network (GAN) for each class in training set, an infinite number of samples can be sampled from the generator. However, this process is computationally expensive, since both training generative models and inferring them to obtain augmented samples are difficult tasks. In addition, the training process may also be lengthened due to the additional augmented data. Brain-inspired methods are approaches that draw inspiration from the functionality and structure of the human brain and apply these mechanisms and principles to artificial intelligence and computer science (Zendrikov et al., 2023).
When encountering datasets with large style differences between training data and testing data, that is, multi-style datasets, common data augmentation methods cannot effectively enhance the generalization performance of the deep model (Li et al., 2022). Therefore, it is very important to study data augmentation methods for multi-style datasets. In this paper, we propose a brain-inspired computer vision image data augmentation method for multi-style datasets in the feature space with semantic preservation which is highly efficient.
Our approach is motivated from the following three aspects: (1) Existing data augmentation methods such as implicit semantic data augmentation (ISDA) (Wang et al., 2021) and so on mostly augment data by changing the image content without changing the image style. They can work well in situations where there are only content differences but not style differences between training data and testing data, such as CIFAR-10 and CIFAR-100 datasets. However, when there are large style differences between the training data and testing data, such as Photo, Art Painting, Cartoon, and Sketch (PACS) dataset, the common data augmentation methods cannot work well. Modeling Domain Shifts with Uncertainty (DSU) (Li et al., 2022) changes the image style, but it does not change the image content. From the perspective of brain inspiration, we can explore and utilize the structure and functionality of the human brain to improve the performance of data augmentation. For example, when we observe an image, we will pay attention to its content and style, such as a dog with painting style, a cat with sketch style, a car with photo style and so on. Therefore, to improve the diversity of data augmentation results, in the actual application process, we may need to perform both style transfer and content transfer when generating augmented images from original images. Previous studies did not combine style transfer with content transfer. In this paper, we combine content transfer and style transfer by performing style transfer on the feature map, and then performing content transfer on the feature vector learned by the feature extraction network. (2) Real data is often mixed with noise. When the training data is mixed with noise, the model often faces the problem of performance degradation, mainly because the noise will bring outliers, which deviate from the overall distribution. Outliers will interfere with the model, making the model unable to extract key features of the sample, or making the model learn wrong features. In this paper, we calculate feature statistics (mean and standard deviation) with robust statistics to weaken the influence of outliers, making the statistics close to the real values and improving the robustness of deep learning models. (3) From the perspective of brain-inspired computer vision, the distribution of sample data can be regarded as a “spherical space,” which can be regarded as a circle in two-dimensional space and a sphere in three-dimensional space (Jeon et al., 2022). For the convenience of expression, we use “sphere” to refer to the “spherical space” of any dimension. The data points are distributed layer by layer from the center of the sphere outward. Due to different positions, the data augmentation strategies of the sample points at the center of the sphere and the data augmentation strategies of the sample points at the outermost layer of the sphere should be different. However, the existing augmentation method does not consider the spherical distribution characteristics of the sample data, and treats all data equally. In this paper, from the perspective of brain-inspired computer vision, the data augmentation strategy of each point is determined according to the distance between each point and the center point.
According to DSU, it calculates the variance of all feature statistics in a mini-batch, and then uses the variance to generate random shifts to add to the original feature statistics. All feature statistics in a mini-batch share the same variance. However, we think that for all the feature statistics in a mini-batch, when considering their data distribution characteristics, the added shifts of the feature statistics distributed in the center of the group and at the edge of the group should be different. In order to keep the semantics unchanged, the shifts added to the feature statistics distributed at the edge of the group should be slightly smaller and in order to increase the coverage after shifting, the shifts added to the feature statistics near the center of the group should be slightly larger. DSU calculates the mean and variance by channel for each feature map, that is, calculates the mean and variance for all pixel values of each channel. However, this direct calculation of the mean and variance does not take into account the impact of outliers. The appearance of outliers will lead to great deviation in statistical results. In order to reduce the influence of outliers, this paper adopts the method of robust statistics to improve the stability of the model. In this paper, we improve DSU, and obtain the improved brain-inspired computer vision method using Robust statistics and controlling the Coefficient of variance for DSU (RCDSU), which calculates feature mean and standard deviation with robust statistics and controls the coefficient of variance to preserve semantics and increase shift range. According to ISDA, it enhances the generalization ability of the model through implicit semantic data augmentation. It works by computing the covariance of all features for each class, and then for each feature, using the covariance of corresponding class to generate a random shift to add to the original feature. This method needs to use the online algorithm to iteratively update the covariance matrix of each class, which is computationally intensive and the obtained covariance matrix is an estimated value rather than an accurate value most of the time. Therefore, this paper proposes a new augmentation method Feature Data Augmentation (FeatureDA), which calculates the variance of all features in a mini-batch, and then uses the variance to generate a random shift to add to the original feature. In order to keep the semantics unchanged, the shifts added to the features distributed at the edge of the group should be slightly smaller and in order to increase the coverage after shifting, the shifts added to the features near the center of the group should be slightly larger, similar to RCDSU. Our proposed method is simple and effective, and enhances the generalization ability and the stability against outliers of the model. Our brain-inspired computer vision method can be integrated into existing networks without introducing redundant model parameters or loss constraints. Experiments have proved that RCDSU and FeatureDA can improve the generalization ability of the model at the style level and at the content level respectively.
In summary, there are three major contributions in our work:
(1) In RCDSU, we calculate feature statistics (mean and standard deviation) with robust statistics to weaken the influence of outliers, making the statistics close to the real values and improving the robustness of deep learning models.
(2) In RCDSU and FeatureDA, we control the coefficient of variance to preserve semantics and increase shift range from the perspective of brain-inspired computer vision.
(3) We combine style transfer and content transfer (RCDSU + FeatureDA) by performing style transfer on the feature map, and then performing content transfer on the feature vector learned by the feature extraction network. We perform both style transfer and content transfer with implicit robot automation when generating augmented images from original images.
2 Related work 2.1 Data augmentationData augmentation is a method that uses a small amount of data to generate more similar synthetic data by prior knowledge to expand the training dataset. It is an effective way to improve generalization ability and alleviate model overfitting. In image recognition tasks, to enhance the geometric invariance of convolutional networks, augmentation methods such as rotation, mirroring and random flipping are often used (Simonyan and Zisserman, 2014; Srivastava et al., 2015; He et al., 2016; Huang et al., 2019). Discarding some information in training images is also an effective way to enhance training data. Random erasing (Zhong et al., 2020) and cutout (DeVries and Taylor, 2017) crop out random rectangular regions of the input image to execute augmentation. Furthermore, there are some studies on automatic data augmentation techniques. AutoAugment (Cubuk et al., 2018) uses reinforcement learning to search for a better augmentation policy among a large number of candidates. Besides, recent studies have shown that the transformations which preserve the class identity can also be seen as effective semantic data augmentation techniques (Jaderberg et al., 2015; Bousmalis et al., 2016; Antoniou et al., 2017; Ratner et al., 2017).
2.2 Uncertainty modelingSome previous work on deep learning with uncertainty (Gal and Ghahramani, 2015, 2016; Kendall and Gal, 2017) also assumes that the deep features or predictions of each sample follow a Gaussian distribution. In face recognition and person re-identification, probabilistic representations are used to resolve the problems of ambiguous faces (Shi and Jain, 2020; Amaya and Von Arnim, 2023) and data outliers/label noise (Yu et al., 2020). To simultaneously learn feature embeddings and their uncertainty, data uncertainty is applied where the uncertainty is learned via a learnable subnetwork to indicate the quality of the image (Chang et al., 2020; Shi and Jain, 2020).
2.3 Robust statisticsThe motivation of using robust statistics is to relieve the impact of outliers, which refer to values that are far from the true data. The appearance of outliers will lead to great deviation in statistical results. Robust statistics seek to provide methods that emulate popular statistical methods, but are not excessively affected by outliers or other small departures from model assumptions (Maronna et al., 2019). Robust statistics can be utilized to detect the outliers by searching for the model fitted by the majority of the data (Rousseeuw and Hubert, 2011; Feldotto et al., 2022). There are efficient robust estimators for a series of complex problems, including covariance estimation (Cheng et al., 2019; Diakonikolas et al., 2019a), sparse estimation tasks (Balakrishnan et al., 2017; Diakonikolas et al., 2019c; Cheng et al., 2022), learning graphical models (Cheng et al., 2018; Diakonikolas et al., 2021), linear regression (Klivans et al., 2018; Diakonikolas et al., 2019d; Pensia et al., 2020), stochastic optimization (Diakonikolas et al., 2019b; DeWolf et al., 2020; Prasad et al., 2020), etc. In RCDSU, we use the property that the median is highly resistant to outliers to enhance the robustness of the model.
2.4 Brain-inspired computer visionBrain-inspired methods are approaches that draw inspiration from the functionality and structure of the human brain and apply these mechanisms and principles to artificial intelligence and computer science (Zendrikov et al., 2023). Data augmentation is an important task in the field of computer vision, aiming to generate more similar synthetic data by prior knowledge to expand the training dataset. When applying brain-inspired methods to data augmentation tasks, we can explore and utilize the structure and functionality of the human brain from multiple perspectives to improve the performance of data augmentation. Designing neural network architectures inspired by brain is an important aspect. We can gain valuable insights from the visual processing mechanisms in the human brain and build neural network models with similar structures and connectivity patterns to mimic the processing and transmission of visual information (Qiu et al., 2023). We can design hierarchical neural networks where each module corresponds to different visual processing phases in the human brain (Cheng et al., 2023). For example, when we observe an image, we will pay attention to its content and style, such as a dog with painting style, a cat with sketch style, a car with photo style and so on. Therefore, we can perform style transfer and content transfer sequentially in data augmentation tasks. From the perspective of brain inspiration, the distribution of sample data can be regarded as a “spherical space”, which can be regarded as a circle in two-dimensional space and a sphere in three-dimensional space (Jeon et al., 2022). Therefore, the data augmentation strategy of each point can be determined by its position in the data distribution. Brain-inspired methods can draw inspiration from the collaborative work of multiple brain regions in the human brain, combining and analyzing data from different vision aspects (such as style and content) to improve the diversity and performance of data augmentation.
3 Method 3.1 PreliminariesIn the field of data augmentation, we have the following general formula:
where f denotes any transformation in the image space or in the feature space, x denotes the original image in the image space or the original feature in the feature space, and x~ denotes the augmented image or feature in the corresponding space.
In this paper, f represents DSU, RCDSU or FeatureDA transformation. In DSU and RCDSU transformations, x denotes the encoded features in the intermediate layers of the network, that is, the feature maps. In the FeatureDA transformation, x denotes the deep features learned by a special network, that is, the feature vectors.
DSU calculates the feature mean and standard deviation by channel for each feature map, that is, calculates the feature mean and standard deviation for all pixel values of each channel. Then it calculates the variance of all feature statistics in a mini-batch, and uses the variance to generate random shifts to add to the original feature statistics. All feature statistics in a mini-batch share the same variance. More details about DSU can refer to Li et al. (2022).
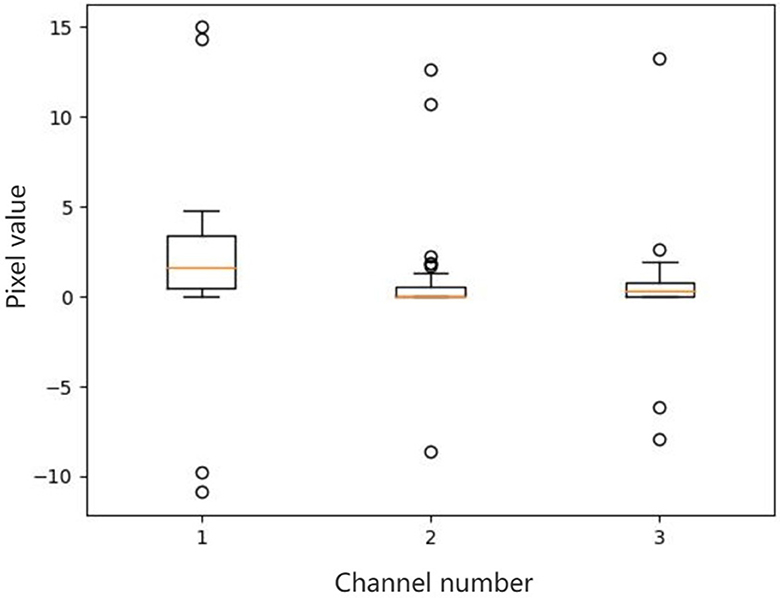
3.2 Robust statistics for DSUThere are outliers in some channels of a feature map. We select three channels which have outliers from a feature map, and then make box plots for all pixel values of each channel. The results are shown in Figure 1. For outliers, if not dealt with, they will affect the final mean and variance.
Figure 1. Box plots of all the pixel values of the selected channels in a feature map. There are outliers in some channels of a feature map. We select three channels which have outliers from a feature map, and then make box plots for all pixel values of each channel. For outliers, if not dealt with, they will affect the final mean and variance.
Therefore, when calculating the mean and variance by channel, in order to alleviate the impact of outliers on the mean and variance, a method of robust statistics is used. First arrange all the pixel values of each channel from small to large. Then divide all pixel values in a channel equally into S segments, and the number of pixels in each segment is HW/S. Find the median m of all pixel values in each segment. Then calculate the average of all medians in a channel as the mean of all pixel values and calculate the variance of all medians in a channel as the variance of all pixel values.
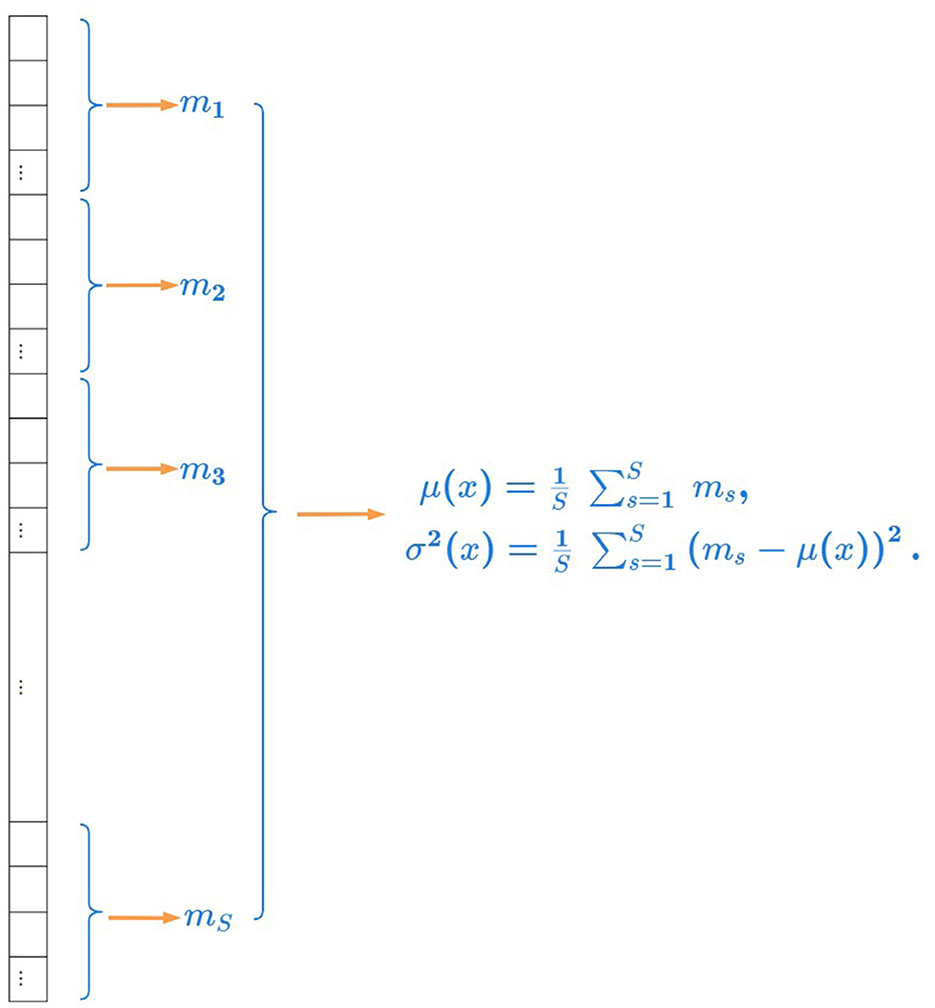
Given x ∈ ℝB×C×H×W to be the features which are encoded in the intermediate layers of the network, we divide all pixels in a channel into S segments and denote m ∈ ℝB×C×S as the median of each segment. The feature mean μ ∈ ℝB×C and standard deviation σ ∈ ℝB×C using robust statistics can be formulated as:
μ(x)=1S∑s=1Smb,c,s, (2) σ2(x)=1S∑s=1S(mb,c,s-μ(x))2, (3)where b represents the bth instance in a mini-batch, c represents the cth channel in a feature map, s represents the sth segment in a channel.
The illustration of robust statistics is shown in Figure 2. We calculate the average of all medians in a channel as the mean of all pixel values and calculate the variance of all medians in a channel as the variance of all pixel values.
Figure 2. Illustration of robust statistics. We calculate the average of all medians in a channel as the mean of all pixel values and calculate the variance of all medians in a channel as the variance of all pixel values.
Following DSU, we can calculate the variance of the feature statistics as follows:
Σμ2(x)=1B∑b=1B(μ(x)-?b[μ(x)])2, (4) Σσ2(x)=1B∑b=1B(σ(x)-?b[σ(x)])2, (5)where Σμ∈ℝC and Σσ∈ℝC represent the shift range of the feature mean μ and feature standard deviation σ, respectively.
3.3 Control the coefficient of variance for DSUIn the above, we calculate feature statistics with robust statistics for DSU to weaken the influence of outliers. Next we will control the coefficient of variance for DSU to make the feature statistics shift with semantic preservation and increase shift range.
According to the sphere distribution of the feature statistics, the closer to the outer layer of the sphere distribution the data point is, we hope that its shift will be smaller to avoid the semantic change of the feature statistic caused by the shift out of the boundary. And the closer to the center of the sphere distribution the data point is, we hope that its shift can be slightly larger to improve the coverage of the augmented feature statistics, increase the diversity of the augmented feature statistics and further enhance the generalization ability of the model. In order to achieve this goal, the size of the shift is controlled by multiplying a coefficient in front of the variance. We assign the coefficient of variance to each feature statistic by its Euclidean distance from the center vector. The larger the distance from the center vector is, the smaller the coefficient of variance corresponding to the feature statistic is, that is, the smaller the shift of the data point is. The smaller the distance from the center vector is, the larger the coefficient of variance corresponding to the feature statistic is, that is, the larger the shift of the data point is.
Given μi∈ℝC and σi∈ℝC to be the feature mean and standard deviation of the ith instance in a mini-batch, respectively, we denote ctμ∈ℝC and ctσ∈ℝC as the center of the feature statistics, which can be formulated as:
ctμ=1B∑i=1Bμi, (6) ctσ=1B∑i=1Bσi. (7)We denote dμi as the Euclidean distance between μi and ctμ, and denote dσi as the Euclidean distance between σi and ctσ, which can be formulated as:
dμi=||μi-ctμ||2, (8) dσi=||σi-ctσ||2. (9)Then sort all the distances of dμ∈ℝB and dσ∈ℝB in descending order respectively, and we can get the sorted distance lists, sorted_distanceμ and sorted_distanceσ.
We utilize nμi to indicate the corresponding position index of dμi in sorted_distanceμ and utilize nσi to indicate the corresponding position index of dσi in sorted_distanceσ, where the position index ranges from 1 to B.
Then the coefficients of variance are given by:
λμi=start+(nμi-1)(end-start)/(B-1), (10) λσi=start+(nσi-1)(end-start)/(B-1), (11)where start and end are the values set manually, and B represents the size of a mini-batch. start is the minimum value among all variance coefficients, while end is the maximum value.
We set λμi and λσi as the coefficient of variance to control the degree of shift. Then we obtain the augmented feature statistics:
μ~i=μi+X, X~N(0,λμiΣμ2), (12) σ~i=σi+Y, Y~N(0,λσiΣσ2), (13)where X and Y is a zero-mean multi-variate normal distribution, respectively.
The augmented feature statistics, mean μ~(x)~N(μ,λμΣμ2) and standard deviation σ~(x)~N(σ,λσΣσ2), can be randomly drawn from the corresponding distributions as:
μ~(x)=μ(x)+ϵμλμΣμ(x), ϵμ~N(0,1), (14) σ~(x)=σ(x)+ϵσλσΣσ(x), ϵσ~N(0,1). (15)The final formula of RCDSU is as follows:
RCDSU(x)=(σ(x)+ϵσλσΣσ(x))︸σ~(x)(x-μ(x)σ(x))+(μ(x)+ϵμλμΣμ(x))︸μ~(x), (16)where μ(x) and σ(x) are feature statistics calculated using the robust statistics formulas (Equations 2, 3).
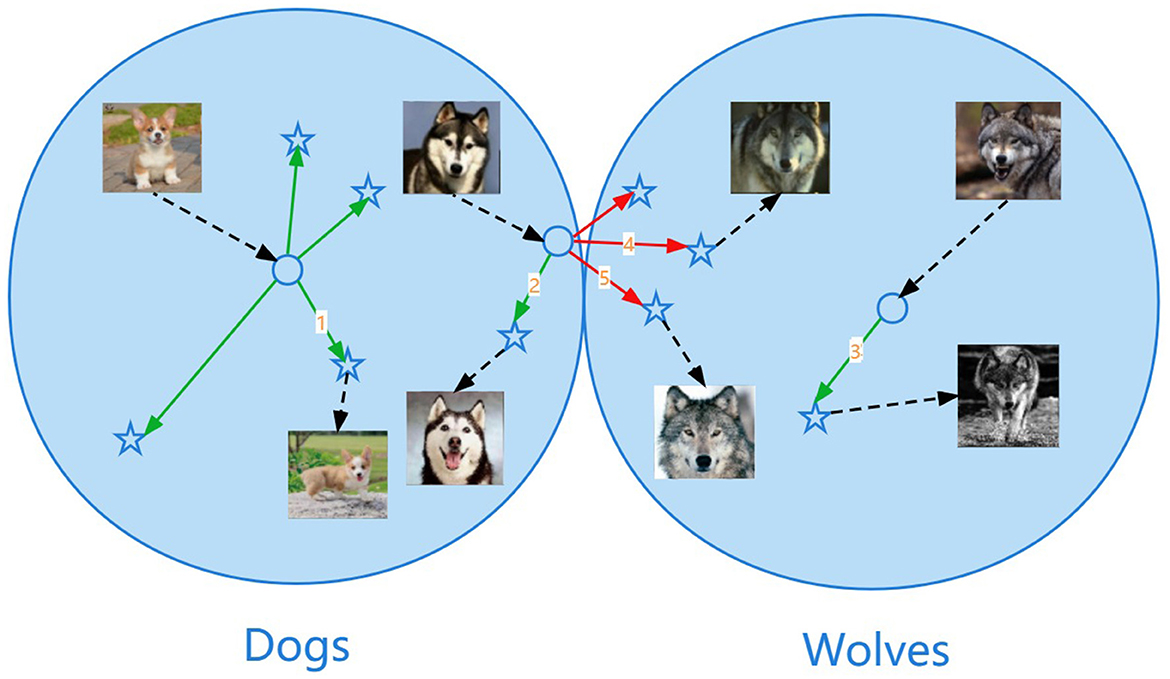
The illustration of the sphere data distribution is shown in Figure 3. The data points close to the center of the sphere are not easy to break through the class boundary when shifting. For example, the shift marked as number 1 or number 3 in the figure transforms without changing the class identity and it means that the semantics are preserved. The data points close to the outermost layer of the sphere are easy to break through the class boundary when shifting, resulting in semantic changes. For example, the shift marked as number 4 or number 5 in the figure transforms from dogs to wolves and it means that the shift is too large, resulting in a change in semantics, which is the wrong shift.
Figure 3. Illustration of the sphere data distribution. The data points close to the center of the sphere are not easy to break through the class boundary when shifting. For example, the shift marked as number 1 or number 3 in the figure transforms without changing the class identity and it means that the semantics are preserved. The data points close to the outermost layer of the sphere are easy to break through the class boundary when shifting, resulting in semantic changes. For example, the shift marked as number 4 or number 5 in the figure transforms from dogs to wolves and it means that the shift is too large, resulting in a change in semantics, which is the wrong shift.
3.4 Content transfer with FeatureDAIn the above, we introduce using Robust statistics and controlling the Coefficient of variance for DSU (RCDSU), which is utilized for style transfer. Next we will introduce Feature Data Augmentation (FeatureDA), which is utilized for content transfer. FeatureDA controls the coefficient of variance similarly to generate the augmented features with semantics unchanged and increase the coverage of augmented features.
According to the sphere distribution of the features, the closer to the outer layer of the sphere distribution the data point is, we hope that its shift will be smaller to avoid the semantic change of the feature caused by the shift out of the boundary. The closer to the center of the sphere distribution the data point is, we hope that its shift can be slightly larger to improve the coverage of the augmented features, increase the diversity of the augmented features and further improve the generalization ability of the model. In order to achieve this goal, the size of the shift is controlled by multiplying a coefficient in front of the variance. We assign the coefficient of variance to each feature by its Euclidean distance from the center vector. The larger the distance from the center vector is, the smaller the coefficient of variance corresponding to the feature is, that is, the smaller the shift of the data point is. The smaller the distance from the center vector is, the larger the coefficient of variance corresponding to the feature is, that is, the larger the shift of the data point is.
Given a ∈ ℝB×A to be the deep features and ai∈ℝA to be the deep feature of the ith instance in a mini-batch learned by a deep network, we denote Σa2 as the variance of all features in a mini-batch, which can be formulated as:
Σa2=1B∑b=1B(a-?b[a])2.
留言 (0)