
記住我
 Yamashita and Kitano: Role of contrast-enhanced harmonic endoscopic ultrasonography (EUS) and EUS elastography in pancreatic lesions
Role of contrast-enhanced harmonic endoscopic ultrasonography (EUS) and EUS elastography in pancreatic lesions
Abstract
Yamashita and Kitano: Role of contrast-enhanced harmonic endoscopic ultrasonography (EUS) and EUS elastography in pancreatic lesions
Role of contrast-enhanced harmonic endoscopic ultrasonography (EUS) and EUS elastography in pancreatic lesions
Abstract
Pancreatic cancers have a poor prognosis, and their incident rates have risen. Endoscopic ultrasonography (EUS) is an efficient and reliable diagnostic modality for pancreatic lesions, providing high spatial resolution. However, while EUS helps to detect minor pancreatic lesions, nearly all solid pancreatic lesions are hypoechoic, which creates difficulty in making differential diagnoses of pancreatic lesions. When diagnosing pancreatic lesions, the performance of image-enhanced EUS techniques is essential, such as EUS elastography or contrast-enhanced harmonic EUS (CH-EUS). CH-EUS diagnosis is based on assessing the vascularity of lesions, whereas tissue elasticity is measured via EUS elastography. Elastography is either strain or shear-wave, depending on the different mechanical properties being evaluated. The usefulness of enhanced EUS techniques is demonstrated in this review for the differential diagnosis of pancreatic lesions, including solid and cystic lesions, and pancreatic cancer staging.
INTRODUCTION When performing transabdominal ultrasound imaging, intervening gas, bone, and fat can create problems. Endoscopic ultrasonography (EUS) was developed as a solution. It also attains high spatial resolution imaging. EUS generally has a high spatial resolution.1-4 However, conventional EUS is subject to limitations in the differential diagnosis of pancreatic lesions because most solid lesions appear as hypoechoic masses. Evaluating the pancreatic lesions’ vascularity and tissue elasticity offers ways to improve their characterization. In clinical practice, contrast-enhanced harmonic EUS (CH-EUS) and EUS elastography have become increasingly used as adjunctive methods for characterizing pancreatic lesions. CH-EUS is based on assessing vascularity with contrast agents, whereas EUS elastography measures tissue elasticity. EUS elastography has two broad types according to the different mechanical properties under evaluation: shear-wave elastography (SWE) and strain elastography. CH-EUS and EUS elastography are increasingly being used in the differential diagnosis of pancreatic lesions, offering benefits over contrast-enhanced computed tomography (CT) and magnetic resonance imaging in cases in which there are contraindications to these modalities, such as those with patients with renal failure and patients with contrast allergy. Dynamic and repeat examinations are also possible. This review updates the literature on the present-day applications of these enhanced EUS imaging techniques. PRINCIPLES OF IMAGE-ENHANCED EUS CH-EUS We describe the concepts of contrast harmonic imaging. Upon exposure to ultrasound beams, microbubbles in the contrast agent are disrupted or resonate, releasing many harmonic signals.5 Tissue and microbubbles each receive transmitted ultrasound waves, and harmonic components are produced that are integer multiples of the fundamental frequency. Selective depiction of the second harmonic component visualizes microbubble signals, which are stronger than the tissue signals. Microbubbles have higher harmonic content than tissue (Fig. 1).6 In this manner, signals can be obtained from contrast agent microbubbles in slowly flowing vessels, with these signals being slightly influenced by Doppler-related artifacts, thereby characterizing vascularity.7,8 Furthermore, time-intensity curve (TIC) pattern analysis and inflow time mapping can be applied to CH-EUS to provide quantitative measures for characterizing lesions.9 Another notable feature is that it is rare for humans to have adverse reactions to CH-EUS contrast agents.10 EUS elastography 1) Strain elastography EUS strain elastography expresses the strain created by cardiovascular pulsation through the aorta or compression of the target tissue by the EUS probe. Softer tissue is represented by higher strain, while harder tissue is represented by lower strain. Strain is shown as different colors according to the tissue elasticity: blue indicates hard tissues, whereas soft tissues are in red (Fig. 2). This is a qualitative evaluation of tissue elasticity, but as second-generation EUS elastography has expanded, there are now two semiquantitative analysis methods for tissue stiffness. The strain ratio (SR) compares a signal between a reference tissue area and a region of interest (ROI). SR is a semiquantitative measure due to hardness being expressed as a relative ratio rather than an absolute value. The other semiquantitative method involves a strain histogram (SH), which represents the mean strain value within a selected area; SH software is used to produce a graph that represents elasticity values using a scale from 0–255, with 0 being the hardest and 255 the softest. 2) Shear-wave elastography In EUS-SWE, an acoustic radiation force (push pulse) is conveyed to a pertinent area of the ROI. At the edge, a shear wave is created by this push pulse. A track pulse calculates the shear-wave velocity (distance/arrival time lag [Vs, m/s]) between two search points (Fig. 3). The shear wave propagates faster in harder tissue than in softer tissue. The percentage of the net amount of the effective shear-wave velocity (VsN, %) represents the percentage of the measurement value used to calculate Vs. VsN can then be used to assess the reliability of the Vs value. UTILITY OF IMAGE-ENHANCED EUS FOR DIAGNOSIS OF PANCREATIC LESIONS Characterization of solid lesions 1) CH-EUS Pancreatic cancers typically show a hypovascular pattern and less intense enhancement on CH-EUS than adjacent pancreatic tissue (Fig. 4A). In previous reports using contrast-enhanced patterns, some studies used heterogeneous enhancement and hypovascular patterns. In studies using TICs, so many different parameters were used that it is difficult to summarize them all. Kitano et al.11 reported a patient group (n=277) who underwent CH-EUS for solid pancreatic lesions. There was a hypovascular pattern in 194 of 204 (95.1%) lesions in patients with pancreatic cancer (Fig. 4A, Table 1). The sensitivity and specificity for pancreatic cancer with second-generation contrast agents (Sonazoid; GE Healthcare Pharm) were reported to be 95% and 89%, respectively. The sensitivity, specificity, and area under the curve (AUC) for diagnosing pancreatic cancers pFig. 4B) had an isovascular pattern (Table 1), whereas there was a hypervascular pattern in 15 of 19 neuroendocrine tumors (NETs) (78.9%) (Fig. 4C, Table 1). Another study showed similar results: 104 of 109 pancreatic cancers (95.4%) were hypovascular, 8 of 11 inflammatory masses (72.7%) and eight of nine autoimmune pancreatitis lesions (88.9%) were isovascular, and five of eight NETs (62.5%) were hypervascular.12 Here, we analyzed early- and late-phase CH-EUS images and evaluated associations between early-phase CH-EUS imaging features and histopathological results from resected pancreatic cancer specimens. A hypovascular pattern on early-phase imaging was associated with lesions containing necrosis, heterogeneous tumor cells, fibrous tissue, and a few vessels. However, an early-phase isovascular pattern was associated with lesions containing homogeneous tumor cells with abundant vessels and an absence of fibrous or necrotic tissues.12 A nine-study meta-analysis involving 887 patients showed pooled estimates of sensitivity, specificity, and AUC for diagnosis of pancreatic cancer of 93% (95% confidence interval [CI], 91%–95%), 80% (95% CI, 75%–85%), and 0.97, respectively.13 A six-study meta-analysis compared patients examined with CH-EUS (n=719) and conventional EUS (n=723). Pooled estimates of sensitivity, specificity, and diagnostic odds ratio (OR) were 93% (95% CI, 90%–95%), 80% (95% CI, 75%–85%), and 57.9 (95% CI, 25.9–130), respectively, for CH-EUS, and they were 86% (95% CI, 82%–89%), 59% (95% CI, 52%–65%), and 8.3 (95% CI, 2.8–24.5), respectively, for conventional EUS.14 The area under the summary receiver operating characteristics curves was 0.96 for CH-EUS and 0.80 for conventional EUS. On CH-EUS, the diagnostic OR for pancreatic cancer was 2.98 times higher than on conventional EUS (p=0.03). 2) EUS elastography (1) Strain elastography Iglesias-Garcia et al.15 examined 77 pancreatic cancers, 42 inflammatory masses, and 10 NETs under EUS elastography, classifying them by their dominant color on the color map (green or blue) and the homogeneity of the color map (heterogeneous or homogeneous). They found that lesions characterized by a heterogeneous blue color were determined to be ductal adenocarcinoma (Fig. 5A, Table 1), those characterized by heterogeneous green were determined to be benign inflammatory masses (Fig. 5B, Table 1), and those showing homogeneous blue were determined to be endocrine tumors (Fig. 5C, Table 1). However, the colors of inflammatory masses differed from green to blue according to the degree of fibrosis. The sensitivity, specificity, positive predictive value (PPV), and negative predictive value (NPV) for diagnosing malignancy in pancreatic solid lesions were 100%, 85.5%, 90.7%, and 100%, respectively. A 19-study meta-analysis involving 1,687 patients calculated pooled sensitivity and specificity for the diagnosis of malignant pancreatic masses and found values of 0.98 (95% CI, 0.96–0.99) and 0.63 (95% CI, 0.58–0.69), respectively, for qualitative EUS elastography, and 0.95 (95% CI, 0.93–0.97) and 0.61 (95% CI, 0.56–0.66), respectively, for quantitative EUS elastography.16 (2) Shear-wave elastography There is just one report on the SWE evaluation of pancreatic lesions because the device has only recently been developed. The Vs (m/s) values of solid pancreatic lesions were 2.19 for pancreatic cancer, 1.31 for NETs, 2.56 for inflammatory masses, and 1.58 for metastatic tumors, but Vs were not significantly different between these diseases.17 There was no significant difference in Vs when comparing tissue elasticity between pancreatic cancer and inflammatory masses (p=0.5687). However, pancreatic cancer’s mean strain value was significant (45.4 vs. 74.5, p=0.0007). The authors concluded that the EUS shear wave was unstable when measuring solid pancreatic lesion elasticity and that strain elastography with SH was superior for characterizing such lesions. Additional studies will look into the usefulness and indications of EUS-SWE for solid pancreatic lesions owing to the recent introduction of a suitable device. Pancreatic cystic lesions 1) CH-EUS Care must be exercised when deciding to perform surgical resection in patients with intraductal papillary mucinous neoplasm (IPMN), namely because they grow slowly and histological features can be benign or malignant, there are highly recurrent in high-age patients, and their resection necessitates invasive surgery, such as pancreaticoduodenectomy. According to guidelines for IPMN, the existence or non-existence of mural nodules is a crucial factor in deciding surgical intervention.18 However, there can be difficulty in accurately evaluating the presence of mural nodules. Discrimination between mural nodules and mucus clots is particularly difficult, with neither MDCT nor EUS being adequate for this differentiation. CH-EUS-determination of the presence of vascularity in mural lesions was found to be useful for the differential diagnosis of mural lesions (Fig. 6, Table 1).19 Harima et al.20 reported the significantly superior diagnostic accuracy of CH-EUS (98%) for mural nodules compared with that of CT (92%) and conventional EUS (72%) (CT vs. CH-EUS, pp21 Echo intensity change and echo intensity reduction rate of mural nodules, and the nodule/pancreatic parenchyma contrast ratio were significantly higher in a high-grade dysplasia (HGD) or invasive carcinoma group than in a low-grade or intermediate-grade dysplasia group (p22 The primary outcomes of the analysis had pooled sensitivity, specificity, and accuracy for the diagnosis of HGD or invasive carcinoma within mural nodules of 97.0% (95% CI, 92.5%–99.2%), 90.4% (95% CI, 85.2%–94.2%), and 95.6% (95% CI, 92.6%–98.7%), respectively. At a disease prevalence of 42% (pretest probability), a positive CH-EUS finding increased the disease probability to 88%, while a negative test decreased it to 2%. 2) EUS elastographyThe utilization of EUS elastography for analyzing pancreatic cystic lesions has not been reported yet.
EUS-guided fine needle aspiration and image-enhanced EUS combined 1) CH-EUS EUS-guided fine needle aspiration (EUS-FNA) is useful for acquiring a diagnostic yield from pancreatic lesions; however, sampling errors can mean there is the unsuitability of the EUS-FNA sample for pathological diagnosis. In pancreatic cancers, the contrast-enhanced pattern sometimes includes a mixture of iso-enhancement, hypoenhancement, and/or non-enhancement. The iso-enhancing area is suggested to reflect the area of concomitant pancreatitis, while the non-enhancing area is suggested to reflect the area of necrosis. Therefore, the puncture of the hypo-enhancing area is recommended. The sensitivities of EUS-FNA for lesions with and without a non-enhancing area were 72.9% and 94.3%, respectively.23 Itonaga et al.24 reported that the percentages of adequate biopsy specimens and diagnostic sensitivity were significantly higher in a group who underwent EUS-FNA with CH-EUS (84.6% and 76.5%, respectively; Fig. 7) than in a group who underwent EUS-FNA alone (68.8% and 58.8%, respectively; between-group differences, p=0.0003 and p=0.011, respectively). A six-study meta-analysis involving 701 patients showed pooled diagnostic sensitivity of 84.6% (95% CI, 80.7%–88.6%) for EUS-FNA with CH-EUS and 75.3% (95% CI, 67.0%–83.5%) for EUS-FNA alone. EUS-FNA with CH-EUS was significantly superior to EUS-FNA alone (pp=0.02).25 In another study, CH-EUS showed sensitivity, specificity, and accuracy of 83.3%, 73.1%, and 75%, in pancreatic cancers that were negative on EUS-FNA.26 2) Elastography (1) Strain elastography When EUS elastography shows mixed blue and green areas within suspected malignant lesions, EUS-FNA was performed for the blue area, which was considered to have a higher suspicion of malignancy. Kongkam et al.27 reported sensitivity, specificity, PPV, NPV, and accuracy rates of 90%, 100%, 100%, 80%, and 92.9%, respectively, for EUS-FNA alone, and 95.2%, 71.4%, 90.9%, 83.3%, and 89.3%, respectively, for a combination of EUS elastography using the SR and EUS-FNA (Fig. 8). The combination of EUS-FNA and SR EUS elastography was not better than EUS-FNA alone. Another report similarly failed to demonstrate the effectiveness of elastography.28 (2) Shear-wave elastographyThe use of EUS-SWE has not yet been adequately reported.
UTILITY OF IMAGE-ENHANCED EUS FOR THE STAGING OF PANCREATIC CANCER T staging 1) CH-EUS When performing T staging of pancreatic cancer, the vascular invasion must be assessed accurately to determine the optimum treatment strategy. However, it may be difficult to differentiate peritumoral inflammation from tumors on conventional EUS. The interface between vessels and tumors was clearly demonstrated with CH-EUS. The criteria for determining vascular invasion using CH-EUS are (1) loss of normal interface or irregular interface between the tumor and vessels and (2) a tumor within the vessel lumen and collateral vessels. Imazu et al.29 described that the overall accuracy of CH-EUS for T staging was significantly superior to that of conventional EUS (92% vs. 69%, p 2) EUS elastography (1) Strain elastography When T staging was performed using EUS elastography, the SRs measured in the primary pancreatic cancer were 25.25±25.10, 42.78±31.05, 63.87±56.91, and 57.92±55.83 for stages T1, T2, T3, and T4, respectively.30 The considerable overlap in values between stages and lower values for T4 than for T3 indicates that the value of strain elastography for T staging is limited. (2) Shear-wave elastographyThe utilization of EUS-SWE has not yet been adequately reported.
N staging 1) CH-EUS N staging is valuable in prognostication and determination of the treatment approach. Performance of CH-EUS for visible lymph nodes in patients with pancreatobiliary cancer was reported by Miyata et al.31 They observed heterogeneous enhancement in 39 of 47 (83.0%) malignant lesions and homogeneous enhancement in 79 of 87 (90.8%) benign lesions (Table 1). In differentiating malignant from benign lymph nodes, the sensitivity of CH-EUS was 83%, the specificity was 91%, and the accuracy was 88%. 2) EUS elastography (1) Strain elastography When the abilities of EUS for N staging were assessed, the SRs measured in primary pancreatic cancers were 52.42±48.33 and 53.93±52.73 for N0 and N1, respectively.30 Therefore, elastography is also somewhat limited for N staging. However, the sensitivity and specificity of EUS strain elastography for differentiating benign from malignant lymph nodes were 91.8% and 82.5%, respectively (Table 1), which were higher than the corresponding values of 78.6% and 50.0% for conventional images.32 EUS elastography is superior to conventional EUS for distinguishing benign from malignant lymph nodes, showing high sensitivity and specificity. (2) Shear-wave elastographyThe use of EUS-SWE has not yet been adequately reported.
M staging 1) CH-EUS Phagocytosis by Kupffer cells after the arterial and portal phases takes Sonazoid contrast agent into normal liver tissue (Kupffer-phase imaging). However, Kupffer cells are not present in metastatic liver lesions. Therefore, metastatic liver lesions can be easily detected by the absence of a signal on Kupffer-phase imaging (Fig. 9, Table 1). Minaga et al.33 compared the sensitivity and diagnostic accuracy of CE-MDCT, conventional EUS, and CH-EUS for metastasis in the left liver lobe. The sensitivity and diagnostic accuracy of CH-EUS (96.6% and 98.4%) were significantly higher than those of conventional EUS (93.4% and 76.7%, pp34 2) EUS elastography (1) Strain elastography When EUS elastography was applied to M staging, the SRs measured in primary pancreatic cancers were 48.86±46.95 and 72.64±55.75 for stages M0 and M1, respectively.30 Therefore, elastography also has limited use in M staging. (2) Shear-wave elastographyThere are currently no utility reports on using EUS-SWE.
CONCLUSIONSConventional EUS is critical to identifying pancreatic lesions and staging pancreatic cancer. However, performing a differential diagnosis for pancreatic lesions can still be difficult. CH-EUS and EUS elastography improve the differential diagnosis of pancreatic lesions and the staging of pancreatic cancer. They provide adjunctive real-time diagnostic information in clinical situations.
Fig. 1.Principle of contrast harmonic imaging. Microbubbles in the contrast agent are disrupted or resonate, releasing many harmonic signals after exposure to ultrasound beams. After receiving transmitted ultrasound waves, tissue and microbubbles produce harmonic components that are integer multiples of the fundamental frequency. The harmonic components from the microbubbles are higher than those from the tissue. Selective depiction of the second harmonic component visualizes signals from the microbubbles more strongly than tissue signals.
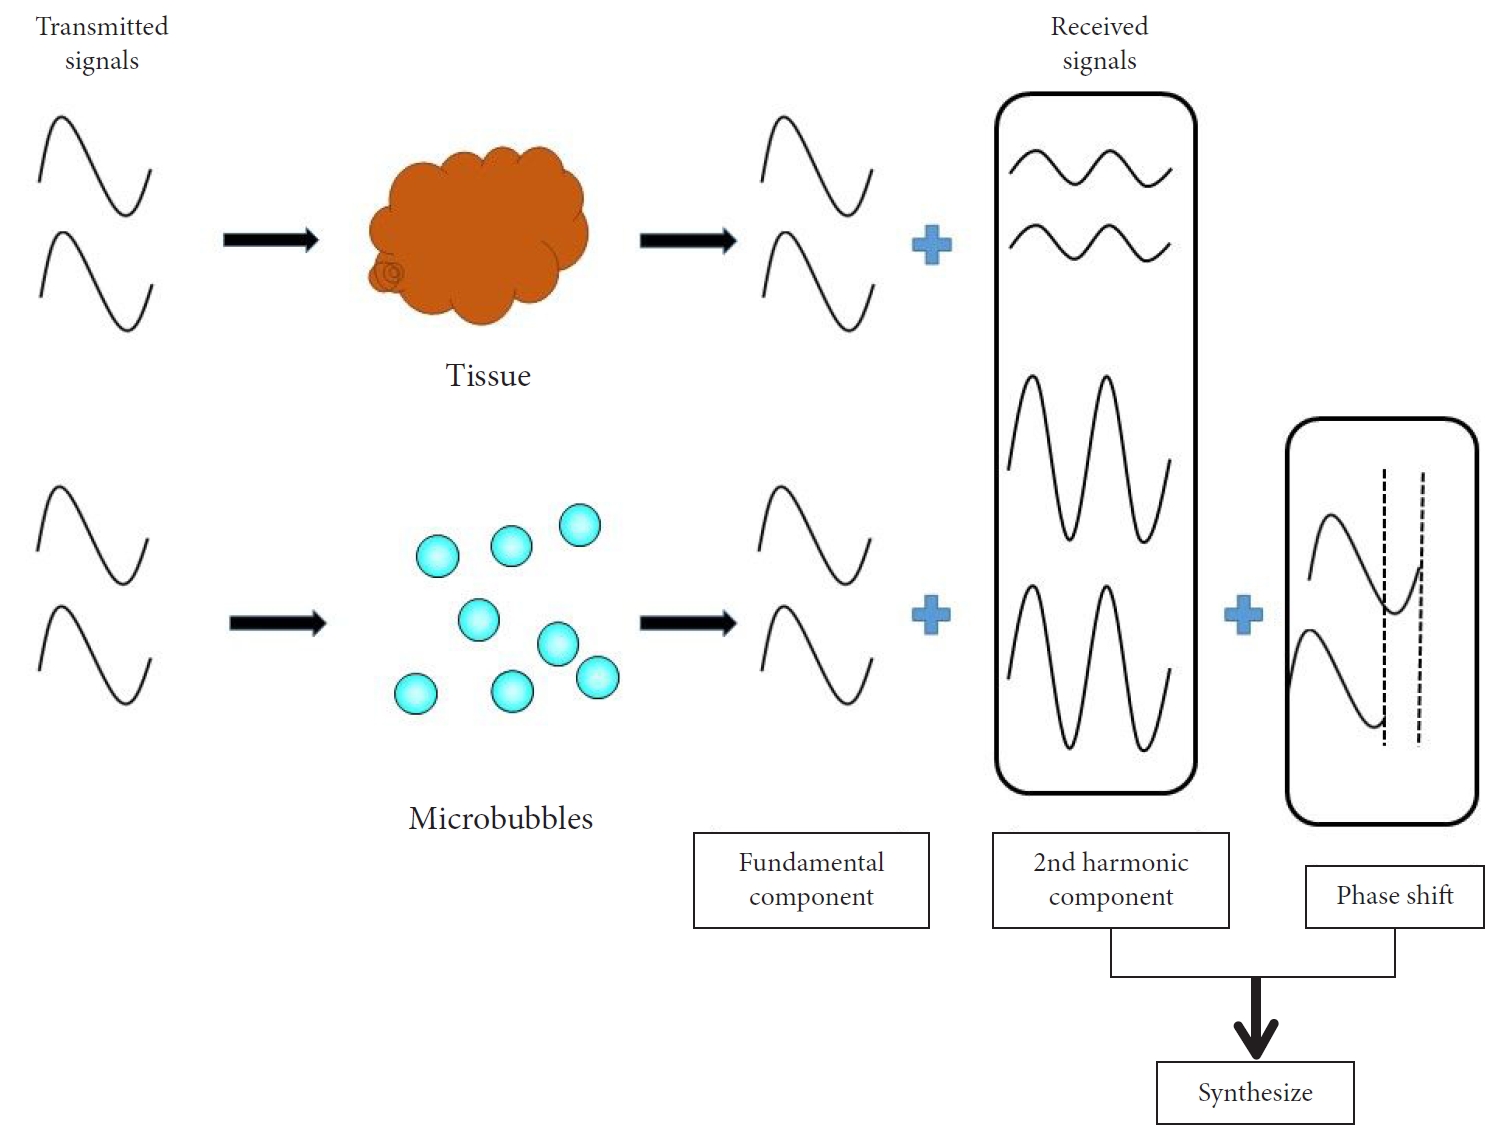 Fig. 2.
Principle of endoscopic ultrasonography (EUS) strain elastography. EUS strain elastography expresses the strain created by cardiovascular pulsation through the aorta or compression of the target tissue by the EUS probe. A larger strain indicates softer tissue, while a smaller one indicates harder tissue. The strain appears in different colors according to the elasticity of the tissue: red=soft tissues, blue=hard tissues.
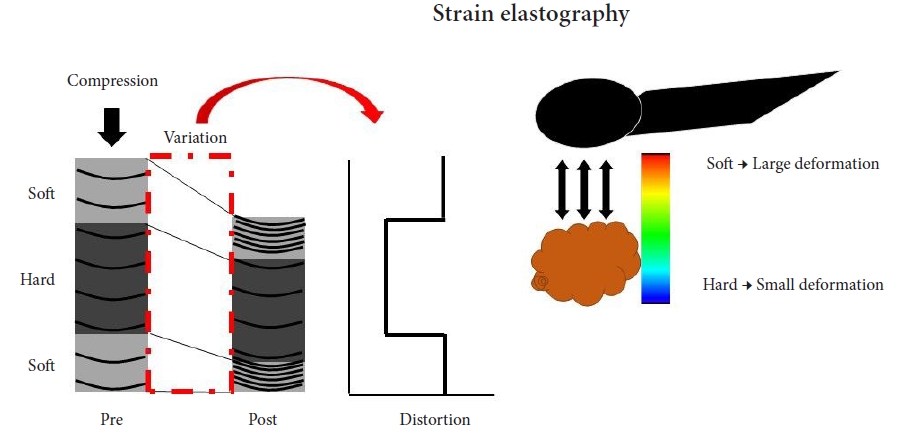 Fig. 3.
Principle of EUS shear-wave measurement and a EUS-SWE monitor image. Acoustic radiation force (push pulse) is sent to the pertinent point of the region of interest (ROI), and the push pulse generates a shear wave at the edge. The shear-wave velocity (distance/arrival time lag [Vs, m/s]) between two search points is calculated with a track pulse. If the tissue is harder, the shear wave propagates faster. EUS, endoscopic ultrasonography; EUS-SWE, EUS shear-wave elastography; Vs, shear-wave velocity; E = 3(Vs2ρ) (ρ is the tissue density); VsN, the percentage of the net amount of effective shear-wave velocity.
 Fig. 4.
Typical contrast-enhanced harmonic endoscopic ultrasonography (CH-EUS) images of a pancreatic lesion. (A) A representative example of pancreatic cancer showing hypoenhancement. The pancreatic lesion was detected as a low echoic lesion (arrowhead) on conventional EUS (left). CH-EUS detected a pancreatic lesion with hypoenhancement (arrowhead) compared with the surrounding pancreatic tissue (right). (B) A representative example of inflammatory mass showing isoenhancement. The pancreatic lesion was detected as a low echoic lesion (arrowhead) on conventional EUS (left). CH-EUS detected a pancreatic lesion showing isoenhancement (arrowhead) compared with surrounding pancreatic tissue (right). (C) A representative example of neuroendocrine tumor showing hyperenhancement. The pancreatic lesion was detected as a low echoic lesion (arrowhead) on conventional EUS (left). CH-EUS detected a pancreatic lesion with hyperenhancement (arrow head) compared with surrounding pancreatic tissue (right).
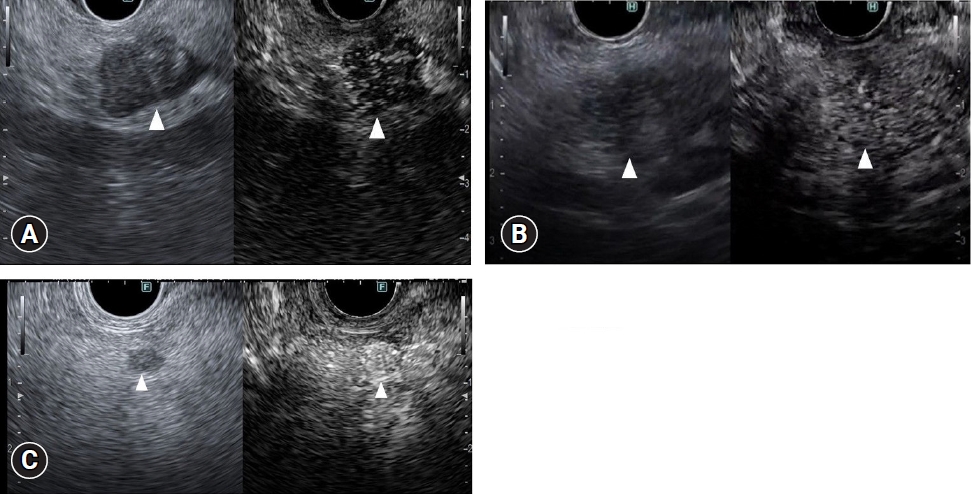 Fig. 5.
Typical endoscopic ultrasonography (EUS) strain elastography images of pancreatic lesions. (A) A representative example of pancreatic cancer. A pancreatic lesion was detected as a low echoic lesion (arrowhead) on conventional EUS (left). EUS strain elastography detected a pancreatic lesion with a heterogeneous blue pattern (arrowhead) compared with that of surrounding pancreatic tissue (right). (B) A representative example of inflammatory mass. A pancreatic lesion was detected as a low echoic lesion (arrowhead) on conventional EUS (left). EUS strain elastography detected a pancreatic lesion with a heterogeneous blue-to-green pattern (arrowhead) compared with that of surrounding pancreatic tissue (right). (C) A representative example of neuroendocrine tumor. A pancreatic lesion was detected as a low echoic lesion (arrowhead) on conventional EUS (left). EUS strain elastography detected a pancreatic lesion with a homogeneous blue color (arrowhead) compared with that of surrounding pancreatic tissue (right).
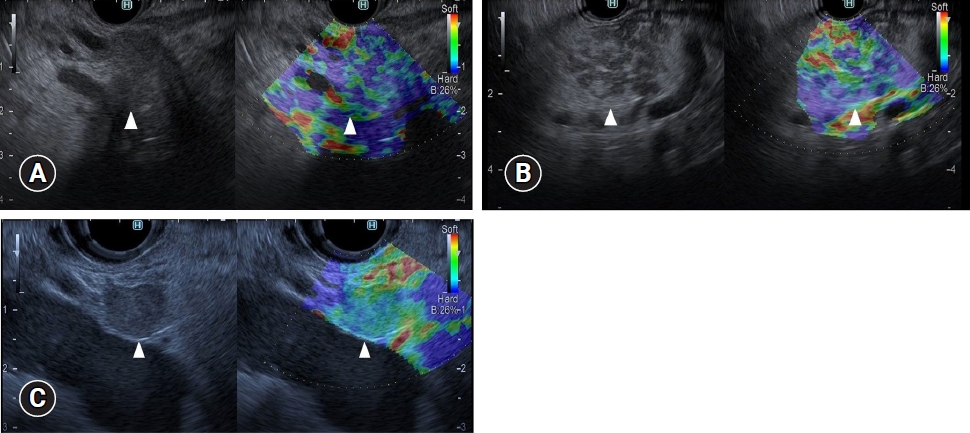 Fig. 6.
Typical contrast-enhanced harmonic endoscopic ultrasonography (CH-EUS) images of mural lesions in intraductal papillary mucinous neoplasm. (A) A representative mural nodule. Conventional EUS (left) reveals an isoechoic mural lesion (arrowhead) in a cyst. CH-EUS (right) reveals a mural lesion (arrowhead) with vascularity. (B) A representative mucus clot. Conventional EUS (left) reveals an isoechoic mural lesion (arrowhead) in a cyst. CH-EUS (right) reveals a mural lesion (arrowhead) without vascularity.
 Fig. 7.
Targeting of endoscopic ultrasonography-guided fine needle aspiration (EUS-FNA) with contrast-enhanced harmonic EUS (CH-EUS). Conventional EUS showed a low echoic mass (left). CH-EUS showed an enhancing and a non-enhancing area within the lesion (right). EUS-FNA (arrow) was performed with CH-EUS, avoiding the non-enhancing area (arrowheads).
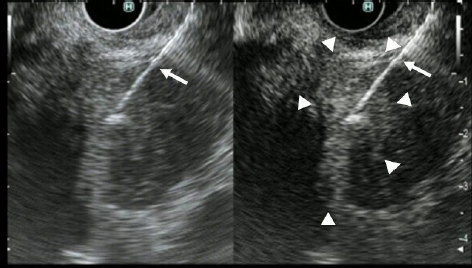 Fig. 8.
Endoscopic ultrasonography (EUS) elastography for targeting of EUS-guided fine needle aspiration (EUS-FNA). Conventional EUS showed a low echoic mass (left). EUS elastography showed mixed blue and green areas within the tumor (arrowhead) (right). EUS-FNA (arrow) was performed with EUS elastography, targeting the blue area (arrowhead).
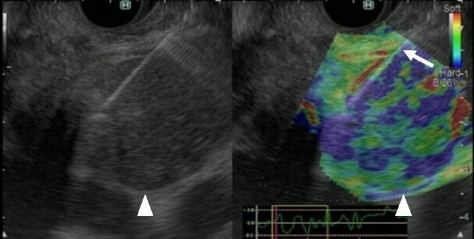 Fig. 9.
Typical contrast-enhanced harmonic endoscopic ultrasonography (CH-EUS) images of liver metastasis. Liver metastasis (arrowhead) was detected as a perfusion defect on the Kupffer-phase contrast-enhanced harmonic EUS image (right). Detecting this metastatic lesion on conventional EUS (left) was difficult.
 Table 1.
Contrast-enhanced harmonic EUS and EUS elastography according to diseases
Enhanced EUS according to disease Contrast-enhanced harmonic EUS EUS elastography (strain elastography) Solid lesion Pancreatic cancer Hypovascular enhancement Heterogeneous blue pattern Inflammatory tumor Isovascular enhancement Green to blue pattern according to the degree of fibrosis Endocrine tumor Hypevascular enhancement Homogeneous blue pattern Cystic lesion IPMN Mucus clot Absence of vascularity Mural nodule Presence of vascularity Lymph node Malignant Heterogeneous enhancement Blue pattern Benign Homogeneous enhancement Red to green pattern Liver metastasis Absence of vascularity in Kupffer-phase imaging REFERENCES 1. Sakamoto H, Kitano M, Suetomi Y, et al. Utility of contrast-enhanced endoscopic ultrasonography for diagnosis of small pancreatic carcinomas. Ultrasound Med Biol 2008;34:525–532.
留言 (0)