
記住我


Decubitus ulcers, also known as pressure ulcers, occur when an area of the body is exposed to prolonged pressure; in hospitalized patients, they may occur because of prolonged immobility, pressure, or friction leading to tissue ischemia and necrosis.1,2 Long-term pressure leads to decreased blood flow that can be further exacerbated by friction resulting in the development of decubitus ulcers.3 This condition affects more than 2.5 million Americans yearly and is a common problem in hospitals and long-term care facilities that is often associated with a decreased quality of life and increased healthcare costs.1,2,4,5 Common risk factors include continued immobility, comorbidities like diabetes, incontinence, cerebro/cardiovascular diseases, sensory loss, malnutrition, and poor perfusion.1 Another study found that pressure ulcers located on the heel of the foot are more often associated with diabetes and peripheral vascular disease than sacral pressure ulcers.6 These results were reflected in a similar study investigating heel pressure ulcers.7 Medications that may increase the risk of pressure ulcers due to cutaneous adverse effects include vasopressors (notably norepinephrine and vasopressin), anticholinergics medications (due to their sedative adverse effects), sedatives, and corticosteroids.6,8–10
Hospital-acquired decubitus ulcers pose substantial financial burdens on hospitals, with an estimated annual cost of 11 billion dollars, and are not eligible for coverage under Medicare or Medicaid.2 Some researchers have estimated that the cost of hospital-acquired pressure ulcers is more than $26.8 billion and requires early detection to mitigate these costs.11 Surgical treatment of pressure ulcers is rarely followed by readmission, but any readmission tends to happen within 2 to 3 months after the operation and costs between $58 and $72,000.12 Previous research estimates that pressure ulcers increase the length of hospital stays from 3 days in patients without ulcers to 7 days.2,5 In that study, the older and malnourished patients were found to be at a significantly increased risk for pressure ulcers.5 Another study found that roughly 8.5% of patients with surgeries over 3 hours long developed hospital-acquired pressure ulcers.13 However, some literature suggests that community-acquired pressure ulcers are more common than hospital-acquired pressure ulcers.14 Previous research using data from the 2005–2014 National Inpatient Sample found that hospital-acquired pressure ulcers were often associated with extended hospital stays, increased costs, and more significant mortality and were more frequently observed in older patients, larger hospitals, patients with Medicare/Medicaid, and those with underlying comorbidities.15
Studies examining the costs of preventing and treating pressure ulcers have yielded different averages, but prevention has consistently proven to be the more cost-effective alternative.16 Preventative measures include appropriate support surfaces, dressings, staffing, and mobilization, while treatment often requires additional medications, surgeries, laboratory examinations, and extended hospital stays.17 Prevention and early detection may be essential for high-risk patients; nursing home patients with diabetes, for example, have a high prevalence of late-stage pressure ulcers.17,18 Prevention and treatment cannot focus solely on patient behavior but should also involve home care and interdisciplinary actions.19 For example, previous literature states that having a caregiver to help increase the number of repositionings was effective in preventing the development of pressure ulcers.20 In emergency departments, researchers have found that early prevention is critical, especially for patients older than 75 years and arriving by ambulance or those presenting with hypotension.21 Early prevention in emergency departments is also cited by other researchers who have found that assessing pressure ulcer risk in the emergency department is a crucial step to mitigating pressure ulcers once hospitalized.22
Previous research has shown that differences exist in pressure ulcer risk, incidence, and outcomes according to specific patient characteristics.15,23–26 For example, hospitalized African Americans, Asians, and Pacific Islanders are more likely to have a pressure ulcer than White patients.23 Medicaid patients are also more likely to experience a pressure ulcer than patients with private insurance.23 Medicare patients in long-term care hospitals, inpatient rehabilitation, and skilled nursing facilities had an increased incidence of new or worsened pressure ulcers if they were older, male, or Black.24 They postulate that African Americans may be receiving care from lower-quality nursing homes than other populations, emphasizing the need for reform specifically within nursing homes that primarily serve Black individuals.24 These results align with those of another study, which found a higher prevalence of nonhealing ulcers in Black nursing home patients in comparison with White patients.25 In one study, there was no significant association between race and pressure ulcers, but household income was a significant factor.26 When access to health care was accounted for, race became an insignificant factor whereas household income remained significant. This could be attributable to the limited access that low-income patients have to resources such as customizable wheelchairs, which assist in proper positioning.26
Despite the demand for early prevention, current risk assessment tools are contentious and lack robust evidence to substantiate their efficacy in reducing the occurrence of pressure ulcers.27 For example, the 2015 American College of Physicians guideline on preventing pressure ulcers indicates limited support for risk assessments, while strongly advocating for the use of preventative measures such as the use of static mattresses.28 Because of the challenges associated with identifying the risk of pressure ulcer development,27,28 this retrospective study seeks to identify vulnerable populations to assist hospitals and practitioners in managing pressure ulcer incidence and associated costs. Using the 2016–2019 National Inpatient Sample (NIS) data, we aim to compare the likelihood of pressure ulcer development, associated costs, and lengths of stay based on socioeconomic factors and geographic regions. Populations with an increased risk of pressure ulcer development or those experiencing disproportionate healthcare charges or hospitalization may benefit from early preventative action.16,17,21,22,29
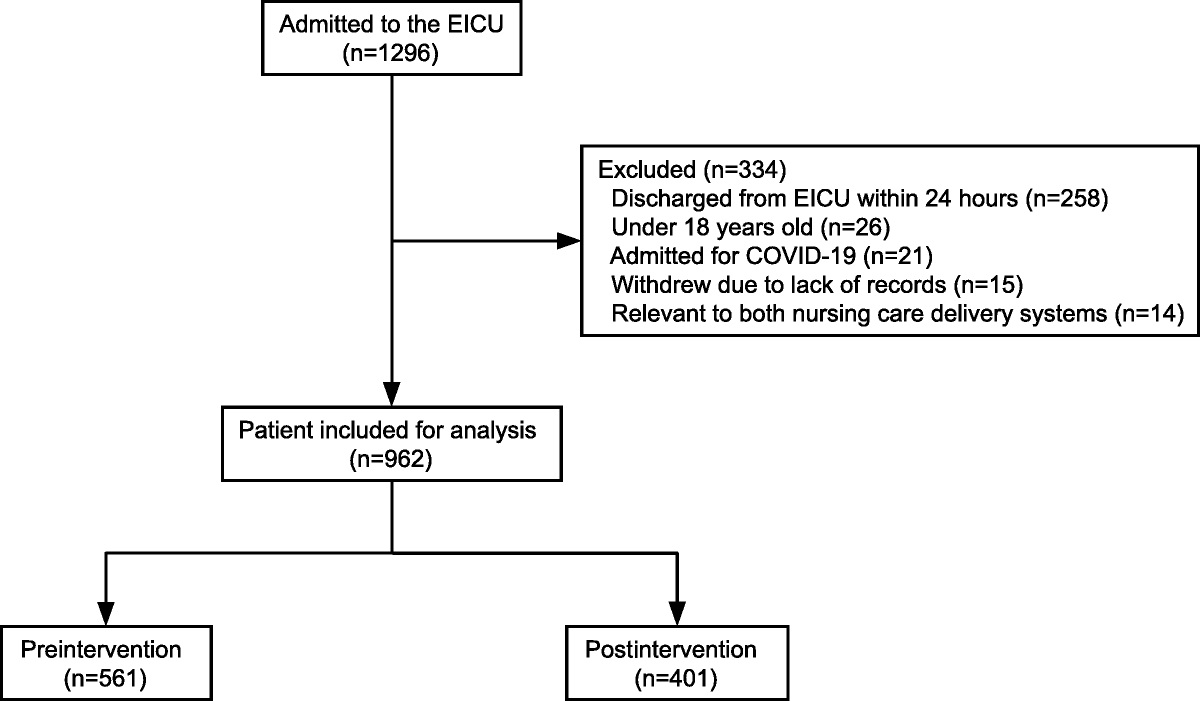
METHODS Data CollectionThe latest 2016–2020 NIS data were used to obtain a population-based estimate for all inpatients nationwide. Among all 2016–2020 NIS samples (N = 34,955,252), as shown in Figure 1, we first identified primary and subdiagnosis of decubitus ulcers using the International Classification of Diseases, Tenth Version (ICD-10) codes for decubitus ulcers (L89). We only included patients with a length of stay equal to or exceeding 5 days, following the methodology adopted by OECD indicators for patient safety (n = 10,375,565).30 Then, after patients with missing variables were excluded, we obtained our final patient sample (N = 9,757,245, national estimates = 48,786,216) (Fig. 1).
 FIGURE 1:
 Flowchart of patient sample selection.
VariablesThe main objective of this study was to examine the characteristics of patients according to the presence of decubitus ulcers, temporal trends, and risk of decubitus ulcer development. We also evaluated the association between hospital charges, length of stays, and decubitus ulcers. The primary variable was the presence of a decubitus ulcer during hospitalization, identified with ICD-10 code L89. Because of the skewed distribution of hospital charges and length of stays, we calculated the natural logarithm of those variables. In this study, we adjusted patient- and hospital-level confounders. Patient characteristics include age, sex, race, annual median household income, and primary payer (Medicare, Medicaid, private insurance, self-pay, others). Hospital characteristics include bed size, ownership, teaching status, and region where the patients are treated.
Statistical AnalysisSampling weights were used for all statistical analyses to ensure the representation of all nationwide patients with decubitus ulcers. First, we examined the characteristics of the final sample dataset, accounting for both patient and hospital factors. The patient and hospital characteristics are presented as weighted frequency (percentage) or means (SD). Subsequently, we investigated the temporal trend among patients with decubitus ulcers as well as the differences in hospital charges and lengths of stay associated with the condition (Table 1). The odds ratios (ORs) and corresponding 95% confidence intervals (95% CIs) for having a decubitus ulcer were calculated using the survey logistic regression analysis (Table 2). Table 2 presents the differences in the odds of having a decubitus ulcer across different patient and hospital groups.
TABLE 1 - Temporal Trend of Hospital Charges and Length of Stay by Decubitus Ulcer 2016 2017 2018 2019 2020 n 1,901,051 1,953,701 1,978,579 1,999,806 1,924,108 Weighted n (national estimates) 9,505,247 9,768,504 9,892,894 9,999,030 9,620,541 Decubitus ulcer No 9,155,217 9,391,074 9,509,614 9,613,455 9,228,481 Yes 350,030 377,430 383,280 385,575 392,060 % of yes 3.82% 4.02% 4.03% 4.01% 4.25% Total charges by year 94,432 99,655 105,069 111,501 121,928 By decubitus ulcer No 93,290 98,462 103,966 110,408 120,535 Yes 124,291 129,355 132,434 138,765 154,723 Length of stays 10.26 10.27 10.32 10.37 10.74 By decubitus ulcer No 10.13 10.14 10.20 10.25 10.60 Yes 13.70 13.60 13.46 13.47 14.09Finally, using the multivariate survey linear regression analysis, we explored how decubitus ulcers are associated with hospital charges and lengths of stay (Table 3). All analyses were conducted using SAS statistical software (version 9.4; SAS Institute, Inc, Cary, NC). The statistical tests used in this study were all 2-sided, and statistical significance was calculated at a P value less than 0.05.
TABLE 3 - Association of Decubitus Ulcer With Hospital Charges and Length of Stay Variables Ln Total Charges Ln Length of Stays Estimate P Estimate P Decubitus ulcer No Reference Yes 0.173 <0.0001 0.215 <0.0001 Race White Reference Black 0.038 <0.0001 0.032 <0.0001 Hispanic 0.186 <0.0001 0.013 <0.0001 Asian or Pacific Islander 0.151 <0.0001 0.038 <0.0001 Others 0.123 <0.0001 0.049 <0.0001 Age groups <40 Reference 40<50 0.132 <0.0001 −0.063 <0.0001 50<60 0.238 <0.0001 −0.043 <0.0001 60<70 0.312 <0.0001 −0.032 <0.0001 70≥ 0.201 <0.0001 −0.077 <0.0001 Sex Male 0.099 <0.0001 0.045 <0.0001 Female Reference Median household income 0–25th percentile −0.127 <0.0001 −0.002 0.001 26th–50th percentile −0.092 <0.0001 −0.002 <0.0001 51st–75th percentile −0.062 <0.0001 −0.002 0.001 76th–100th percentile Reference Primary payer Medicare −0.078 <0.0001 0.011 <0.0001 Medicaid −0.090 <0.0001 0.060 <0.0001 Private insurance Reference Self-pay −0.094 <0.0001 −0.027 <0.0001 Others −0.074 <0.0001 0.016 <0.0001 Died during hospitalization No Reference Yes 0.631 <0.0001 0.258 <0.0001 Bed size of the hospital Small Reference Medium 0.184 <0.0001 0.018 <0.0001 Large 0.367 <0.0001 0.068 <0.0001 Ownership of hospital Government, nonfederal −0.583 <0.0001 0.027 <0.0001 Private, nonprofit −0.499 <0.0001 −0.014 <0.0001 Private, investor-own Reference Teaching status of the hospital Nonteaching Reference Teaching 0.364 <0.0001 0.079 <0.0001 Region of hospital Northeast 0.154 <0.0001 0.044 <0.0001 Midwest Reference South 0.084 <0.0001 0.033 <0.0001 West 0.465 <0.0001 0.033 <0.0001 Year 0.051 <0.0001 0.005 <0.0001A total of 9,757,245 inpatients were identified in the 2016–2020 NIS data (weighted N = 48,786,216, Table 4). Among the sample population, 3.9% had decubitus ulcers. Inpatients with decubitus ulcers were more often found in the Black, older, and Medicare populations. Table 4 provides a comprehensive overview of patient characteristics in greater detail.
TABLE 4 - General Characteristics of the Study Sample Decubitus Ulcer P Total Yes No n % n % n 9,757,245 377,675 9,379,570 Weighted n (national estimates) 48,786,216 1,888,375 3.9% 46,897,842 96.1% Race White 32,419,138 1,229,365 3.8% 31,189,773 96.2% <0.0001 Black 8,269,291 395,245 4.8% 7,874,046 95.2% Hispanic 5,031,349 157,095 3.1% 4,874,254 96.9% Asian or Pacific Islander 1,237,139 40,835 3.3% 1,196,304 96.7% Others 1,829,300 65,835 3.6% 1,763,465 96.4% Age groups
留言 (0)