
記住我


The study was approved by the local ethical committee and was carried out accordingly, which exempted the need for obtaining written informed consent. All analyses were conducted in compliance with local data protection regulations.
Study populationIn this study, we compiled clinical data and CT datasets from a total of 131 patients who had undergone CTPA for suspicion of acute PE. The CT scans were performed using a third-generation dual-source dual-energy CT machine at the University Hospital Frankfurt (Frankfurt am Main, Germany). Data from this cohort have previously been reported [8]. The data collection period encompassed January 2015 to March 2022.
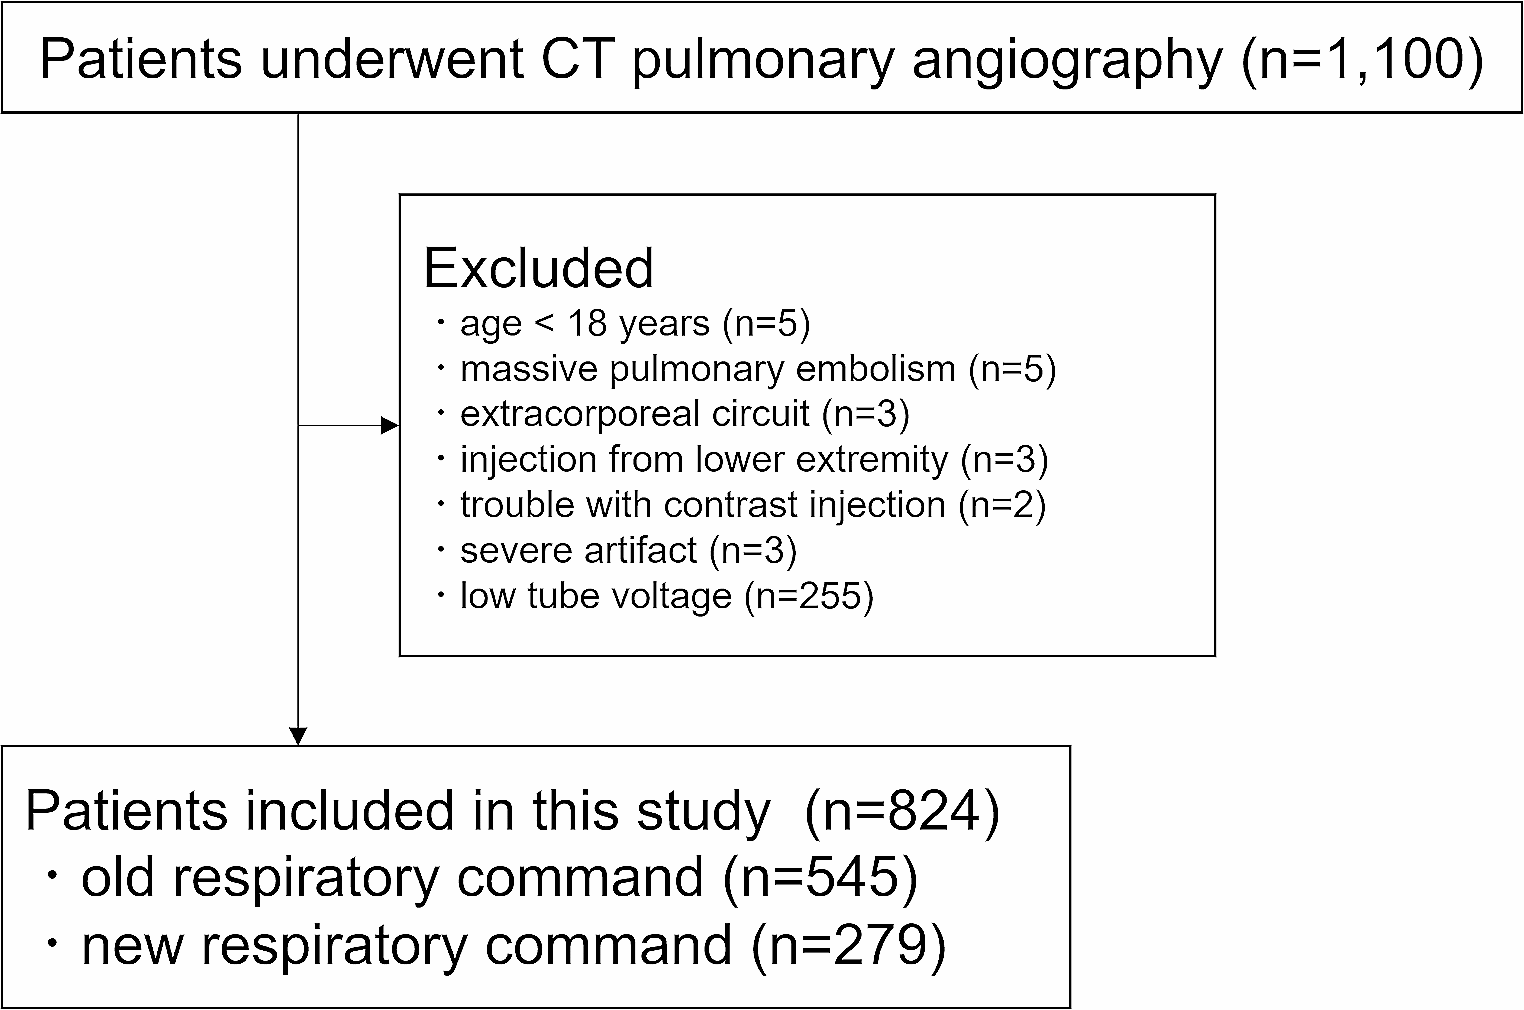
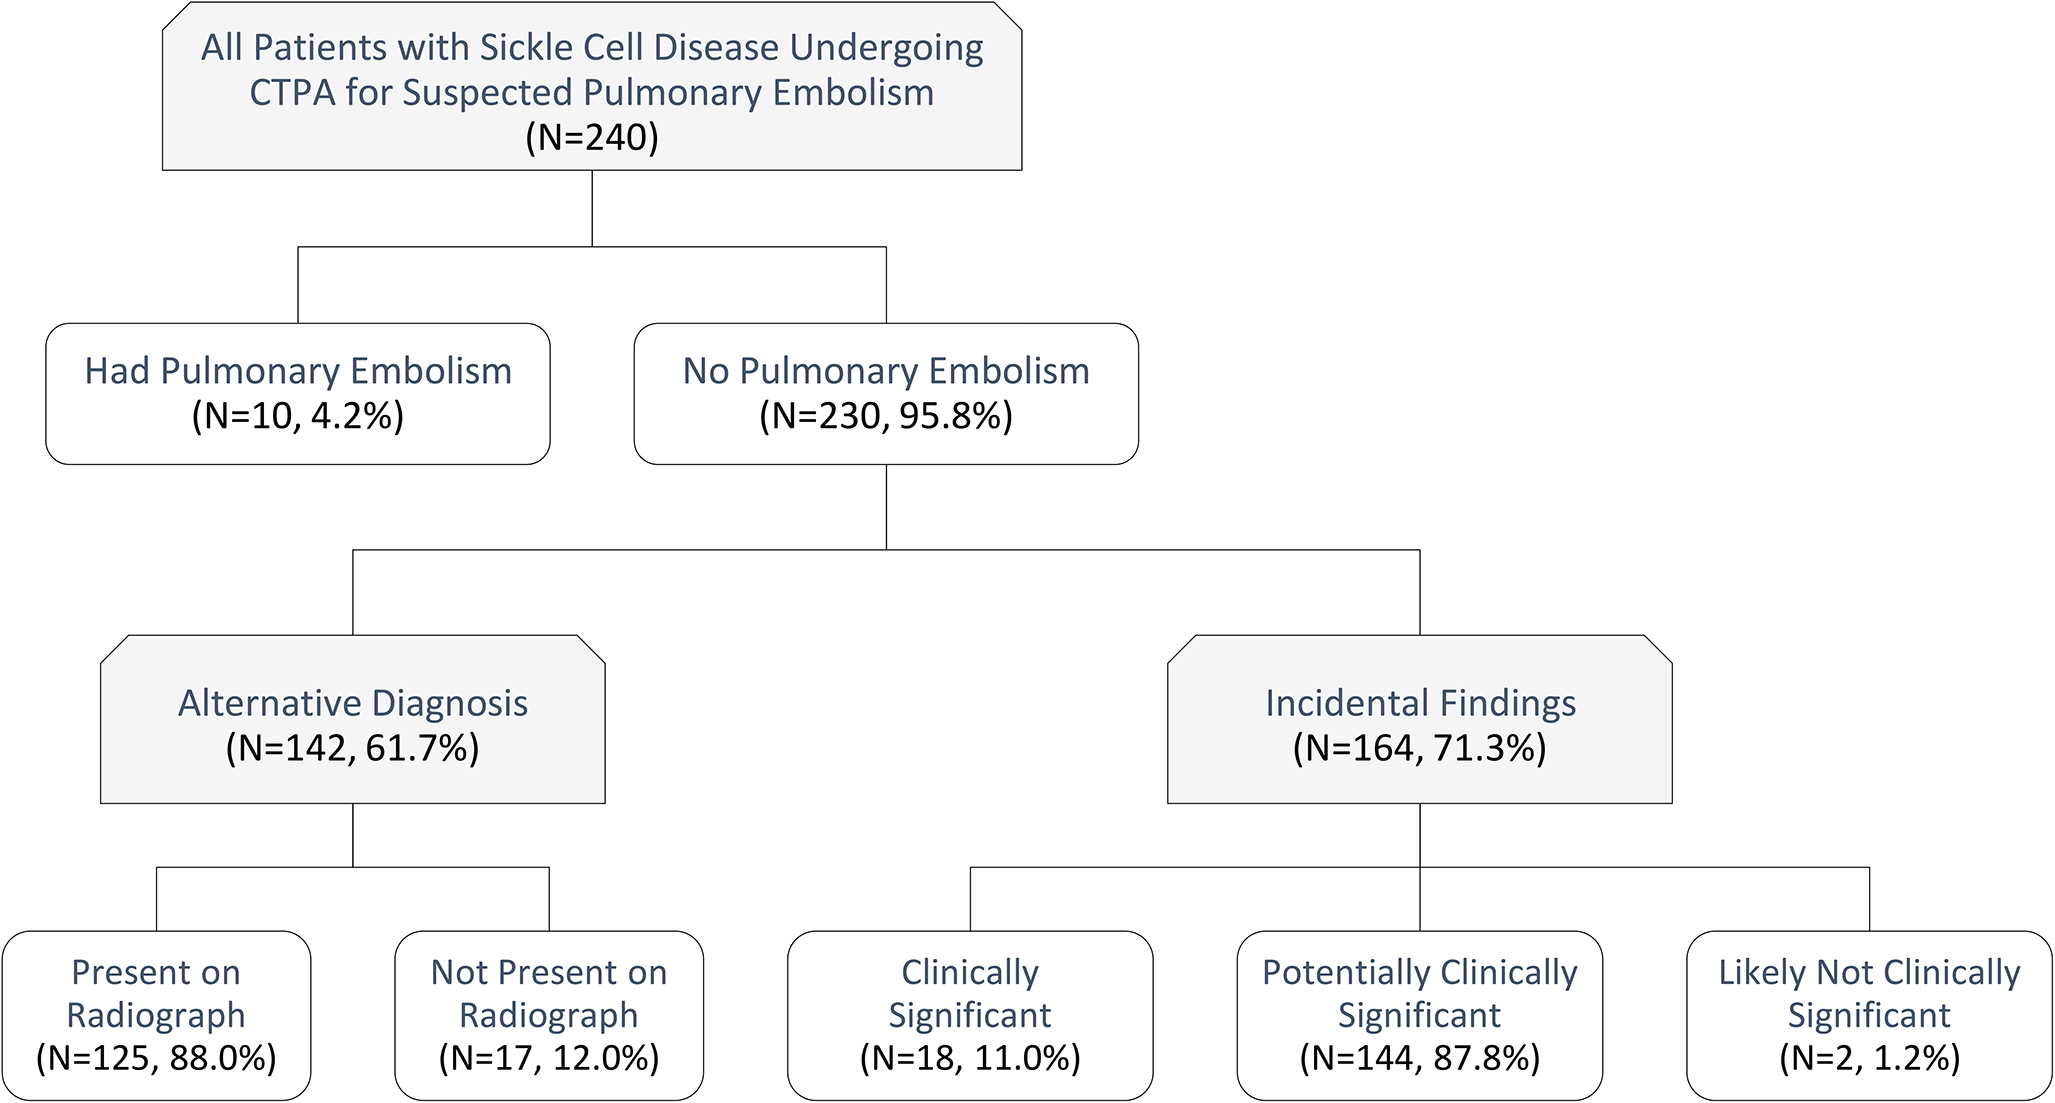
All patients were divided into two distinct groups for analysis. One group consisted of patients with central PE and peripheral PE, while the other group who had no PE served as the control group. Inclusion criteria were patients over 18 years with a confirmed PE and the presence of a dedicated CTPA examination depicting the complete lung vasculature. Exclusion criteria in both cohorts encompassed imaging artifacts in the pulmonary artery region (n = 11), inadequate visual delineation of the embolus (n = 7), incomplete examination protocols (n = 4) and insufficient data on disease progression (n = 28). Eligible participants were identified from the picture archiving and communication system (Centricity™ RIS-i 7.0‘ [Version 7.0.3.5, 11/2021] und ‚Centricity™ Universal Viewer‘ [Version 7.0, 08/2021], General Electric Healthcare, Chicago, Illinois, USA) by conducting searches using specific terms such as ‘pulmonary embolism’, ‘pulmonal artery embolism’, ‘central pulmonary embolism’ and ‘peripheral pulmonary embolism’. The process of selecting participants for the study is illustrated in Fig. 1.
Fig. 1
Flowchart of patient inclusion. Abbreviations PE, pulmonary embolism
Clinical and laboratory dataWe obtained additional patient data and parameters by extracting information from medical reports and the hospital information system. Laboratory chemistry data were retrieved from recorded laboratory findings. The Wells and Pulmonary embolism severity index (PESI) scores were also calculated, further classifying patients into risk classes ranging from 1 to 5 based on the PESI score [2].
Additionally, a retrospective stratification of the patients into the four risk categories according the European Society of Cardiology (ESC) score was performed (low-risk PE, intermediate-low-risk PE, intermediate-high-risk PE, and high-risk PE) [2].
Overall survival was characterized as the duration from the DECT scan to the occurrence of death or the most recent documented follow-up.
Dual-energy CT protocolThe CT scans were conducted using a third generation DECT scanner equipped with a Somatom Force unit manufactured by Siemens Healthineers (Forchheim, Bavaria, Germany).
The examination parameters were as follows: tube A, 90 kVp and 190 mAs; tube B, Sn150 kVp and 95mAs. In tube B, an additional tin filter (Selective Photon Shield II, Siemens Healthineers) was used to reduce radiation exposure. Acquisition parameters were 0.25 s (s) rotation time, 1–2 s acquisition time, 192 × 0.6-millimeter (mm) collimation, and 2.5 pitch value. Scanning was performed in the craniocaudal direction in bolus-triggered arterial and venous phases with 80–120 milliliters (ml) of nonionized contrast agent (Imeron 400, Bracco, Milan, Italy) at an injection rate of 5–6 ml/s, a threshold of 120 HU and a delay of 7s.
Image segmentation and analysisAfter anonymization, the CT datasets from all patients were extracted as Digital Imaging and Communications in Medicine (DICOM) datasets and uploaded into 3D Slicer (www.slicer.org, Version 5.0.2, Harvard University, Cambridge, USA).
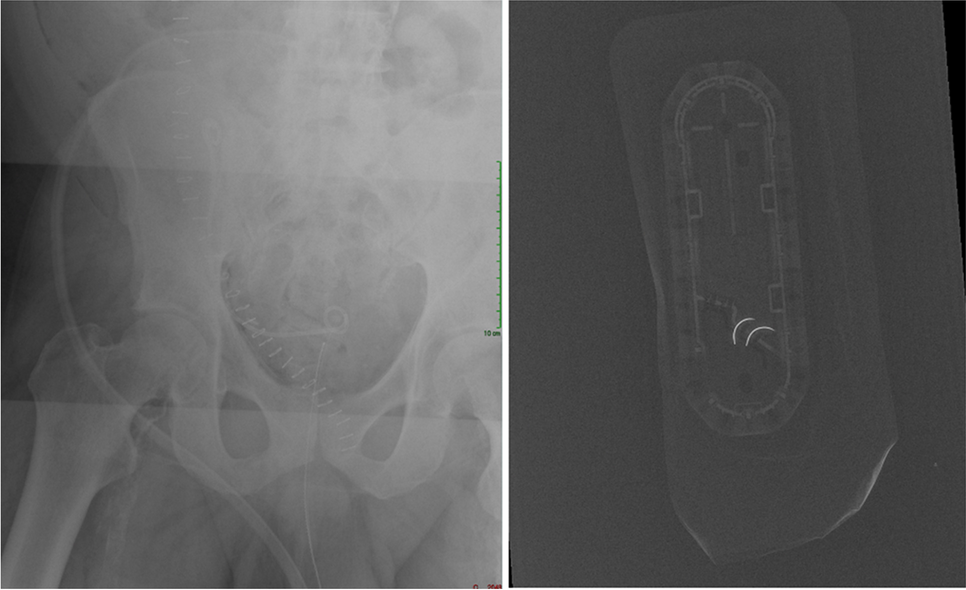
The segmentation of the embolus and pulmonary trunk was performed in each patient using the interactive segmentation algorithm GrowCut [10,11,12]. An example of the segmentation is shown in Fig. 2. The segmentation in each case was evaluated by two experienced radiologist (V.K. and S.S.M., board-certified radiologists with four and seven years of experience in experimental imaging, respectively).
Fig. 2
Exemplary segmentation of the pulmonary arteries and the embolus. A, Unsegmented axial slice; B, Segmented axial slice; C, Unsegmented coronal slice; D, Segmented coronal slice; E, Unsegmented sagittal slice; F, Segmented sagittal slice; G, Final segmentation of the embolus. Abbreviations PE, pulmonary embolism
In case of any disagreement with the initial segmentation, the process was repeated, and necessary adjustments were made. All radiologists participating in the assessment were kept entirely unaware of the clinical data pertaining to the patients.
Extraction of radiomics featuresRadiomic features were extracted through the utilization of the PyRadiomics extension package incorporated into the 3D Slicer software (Version 5.1.0–2022-05–20). This extraction process generated a total of 107 features for each segmentation (Table S1) [13]. All extracted features were subsequently classified into seven distinct groups, as follows: Gray-Level Dependence Matrix (GLDM), Gray-Level Co-Occurrence Matrix (GLCM), Gray-Level Run Length Matrix (GLRLM), Gray-Level Size Zone Matrix (GLSZM), Neighboring Gray Tone Difference Matrix (NGTDM), Shape, and First Order [13].
To provide a comprehensive assessment of the study’s transparency and quality, we included a CheckList for EvaluAtion of Radiomics Research (CLEAR) [14] in Figure S1.
Radiomics feature selectionIn order to identify the most pertinent features for subsequent analysis, multi-stage feature selection process was implemented. Initially, all numerical features were normalized using Z-score standardization. In the next step, the Boruta dimension reduction and feature elimination algorithm, was applied [15]. Furthermore, a correlation analysis was conducted to identify clusters of highly correlated features, defined by a Pearson’s correlation coefficient (r ≥ 0.60). From each cluster, one feature with the highest Gini index was selected for further analysis.
Construction of the radiomics modelA gradient-boosted tree model was trained on the selected radiomic features to discriminate between pulmonary embolism and healthy patients using a training dataset comprising 79 patients. The model was subsequently assessed using a distinct test dataset comprising 52 patients. This test dataset had not been incorporated into the algorithm’s training phase previously.
Statistical analysisStatistical analysis was conducted with the use of R statistical software (R Foundation for Statistical Computing, Vienna, Austria; Version 2023.06.0 + 421) and MedCalc (MedCalc Software Ltd., Ostend, Belgium; Version 20.123). The normality of the data distribution was assessed through visual methods such as histograms and the Wilk-Shapiro test. Normally distributed values were presented as mean ± standard deviation (SD), while non-normally distributed values were expressed as median and interquartile range (IQR). The t-test was employed for data with a continuous distribution, whereas the Man-Whitney test or Spearman rank correlation coefficient was applied to non-normally distributed data. A significance level of less than 0.05 was considered statistically significant.
The diagnostic accuracy of the optimal predictive parameters was evaluated using the area under the curve (AUC) derived from receiver operating characteristic (ROC) analyses. Subsequently, diagnostic sensitivity and specificity were computed.
Cox proportional hazards models were used to identify independent factors among clinical markers, imaging markers, and radiomics features. Multivariate Cox proportional hazards models were adjusted for significant univariate prognostic parameters and clinically relevant confounders, with hazard ratios and their corresponding 95% confidence intervals (CI) reported.
留言 (0)