
記住我

The ethics committee of Sun Yat-sen University Cancer Center approved the retrospective use of clinical treatment plans for patients in this study. A cohort of 38 patients with NPC treated with IMRT at Sun Yat-sen University Cancer Center between March 2015 and February 2016 was collected. Among these 38 patients, 30 (79%) were males and 8 (21%) were females, with an age range of 22–79 years (median age of 49 years). All IMRT plans were generated in the same treatment machine of Varian Trilogy system (Varian Medical Systems, Palo Alto, CA, USA) with Millennium 120 MLC, using nine equally spaced beams (beam angles at 0°, 40°, 80°, 120°, 160°, 200°, 240°, 280°, and 320°) and 6 MV photon beam energy in flattening filter mode.
All patients with NPC had multiple radiation targets, and five PTVs named “PTV-GTV,” “PTV-1,” “PTV-2,” “PTV-LN(L)” (PTV of left lymphonodus), and “PTV-LN(R)” (PTV of right lymphonodus) were considered. The prescription doses for PTV-GTV, PTV-1, PTV-2, PTV-LN(L), and PTV-LN(R) were 70, 60 or 64, 54 or 58, 60–70, and 60–70 Gy, respectively, in 30–33 fractions. Seventeen OARs used in this study were body, brainstem, spinal cord, chiasm, tongue, left and right optic nerves, left and right lens, left and right temporal lobes, left and right mandibles, left and right temporomandibular joints, and left and right parotid glands.
Fluence predictionA customized CNN model named “shared encoder network” proposed in our previous study was used for fluence prediction [29]. The shared encoder network constructed by one encoding path and two decoding paths was exploited to simultaneously generate dose distribution and fluence maps with structure contours and CT images as input. The contour of PTV was converted to a 3D mask according to the prescription dose, and the maximum prescription dose of PTVs where the voxel belonged was set to each voxel of the PTV mask and every non-PTV voxel was assigned zero. Each OAR was expressed as a binary mask with one set inside the contour and zero set outside the contour. We extracted CT image, PTV mask, and 17 OAR masks from each patient as input data, and we utilized the trained model to generate fluence maps with resolution of 2.5 mm × 2.5 mm and size of 160 × 160 at nine beam directions. The predicted fluence maps were saved in a file storage format with header information and pixel values before importing into TPS.
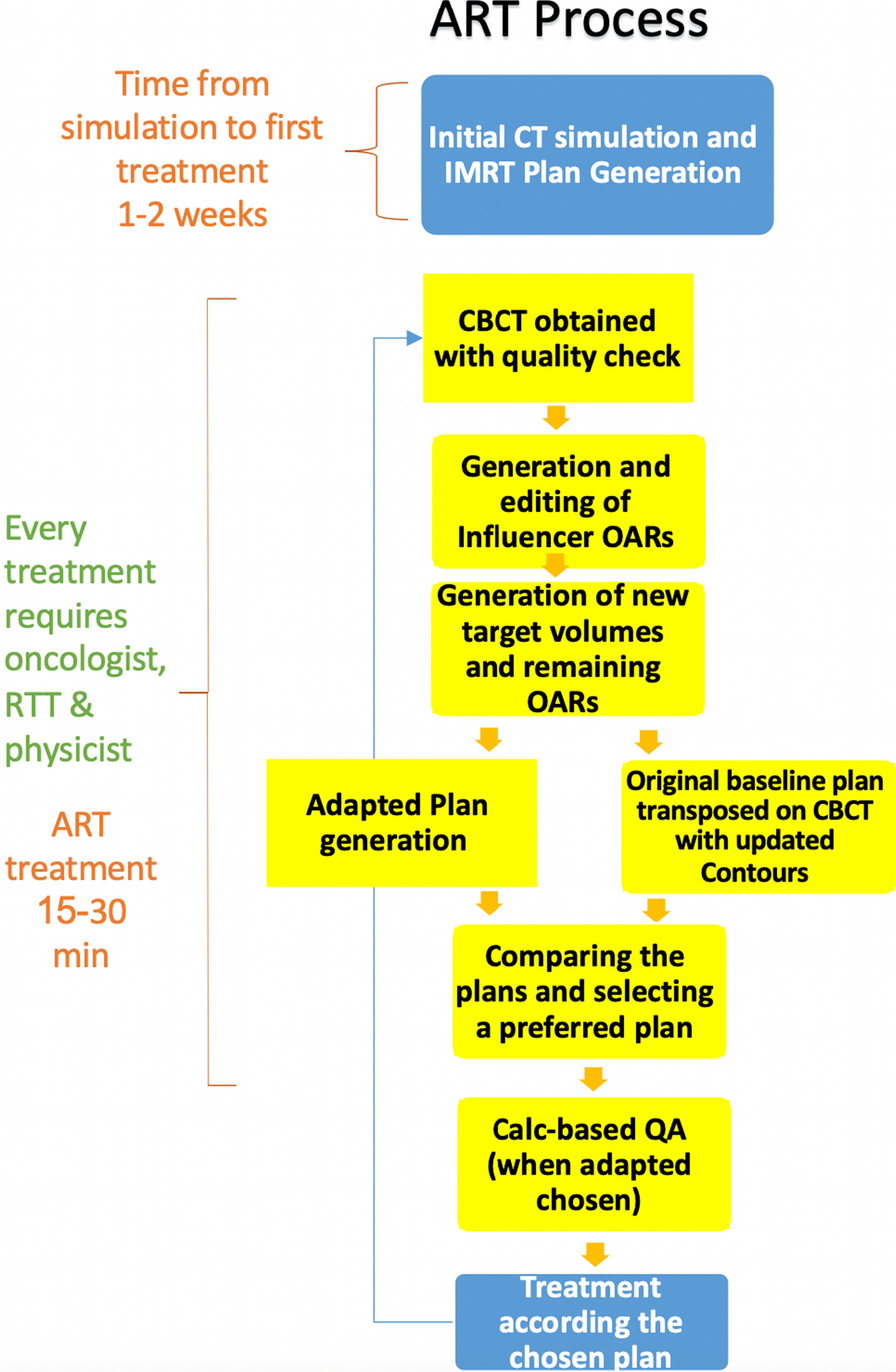
Automatic plan generationThe automatic planning process was accomplished in a research-only Eclipse TPS (version 15.6). Using the Eclipse Scripting Application Programming Interface script to assist radiotherapy planning and plan quality assessment [30,31,32], we integrated all manual planning operations into a compiled C#-based script to achieve a fully automated planning process. With the customized C#-based script, the predicted fluence maps were imported into Eclipse to generate an initial plan, the auxiliary target structures were produced and dose objectives and priorities were set according to prescription and predicted fluence generated dose, the optimization and leaf motion and final dose calculations were also completed automatically. An approved binary plugin can be executed with one click to automatically generate a plan in the Eclipse system. Figure 1 demonstrates the procedure of an automatic IMRT plan generation.
Fig. 1
The flowchart of automatic plan generation
Step 1: Importing predicted fluence and calculating dose distribution
After creating a new course and new plan for a selected patient, the predicted fluence maps for each beam were imported into Eclipse and then converted to MLC sequences with MLC leaf motion calculations (Varian LMC 15.6.03). The predicted fluence generated plan was obtained after calculating the resulted dose distribution with Anisotropic Analytic algorithm (AAA 15.6.03).
Step 2: Adding auxiliary structures and cropping targets
To improve target dose conformity and reduce the radiation dose to normal tissues, we added four auxiliary structures in optimization: “PTV-1-Crop,” “PTV-2-Crop,” “Ring 2 cm,” and “40 Gy-PTV2”. “PTV-1-Crop” was defined as the region of 3 mm outward expansion of PTV-GTV subtracted from PTV-1. “PTV-2-Crop” was generated by subtracting the 3 mm outward expansion of PTV-1, PTV-LN (L), and PTV-LN (R) from the whole region of PTV-2. “Ring 2 cm” was defined as a 2 cm-wide ring between PTV-2 expanded by 0.2 cm and PTV-2 expanded by 2.2 cm, and “40 Gy-PTV2” referred to the region between the isodose line of 40 Gy and the 0.3 cm extension of PTV-2. The Additional file 1 illustrates the definition of four auxiliary structures.
Step 3: Setting optimization objectives and priorities
The plan generated from predicted fluence maps already provided the achieved dose information, but the plan quality may need to be further improved. To ensure a plan quality improvement after plan fine-tuning, we set stringent optimization objectives (Table 1). The dosimetric values for key OARs were set 5%–25% lower than the achieved values from the predicted fluence generated plan.
Table 1 Optimization objectives were set according to prescription dose and predicted fluence generated dose informationStep 4: Further optimization and calculating final dose distribution
Plan optimization was completed with the Photon Optimizer algorithm (PO, version 15.6.03) with continued optimization, and the dose distribution calculated from the predicted fluence was set as the intermediate dose to reduce the optimization convergence time. Plan optimization was completed with the maximum number of 300 iterations. After optimization, the optimal fluence maps were converted to MLC leaf sequences with MLC leaf motion calculations, and the final dose distribution was calculated to generate the final deliverable plan.
留言 (0)