
記住我


More than three years have passed since the outbreak of coronavirus disease 2019 (COVID-19), and the global COVID-19 pandemic has caused more than 0.76 billion cases and more than 6.9 million deaths worldwide until June 4, 2022.[1] Great progress has been achieved in fighting against COVID-19, among which vaccination plays one of the most essential roles.[2,3] Severe acute respiratory syndrome coronavirus 2 (SARS-CoV-2) vaccines are highly efficient in reducing infection, as well as deterioration and death of COVID-19, especially among patients with pre-existing medical conditions.[4] Patients with chronic pulmonary or cardiovascular disease are at a higher risk of progressing to catastrophic outcomes. Therefore, vaccination is recommended in these populations.[5]
Pulmonary hypertension (PH) is a syndrome characterized by remodeling of the pulmonary vasculature and a progressive increase in the pulmonary vascular load that leads to right-sided heart failure and even death.[6,7] Pulmonary arterial hypertension (PAH) is a group of precapillary PH, also the WHO group 1 PH, mainly including idiopathic, heritable, drug/toxin-induced, and other disease-induced (connective tissue disease [CTD], congenital heart disease [CHD], human immunodeficiency virus [HIV], portal hypertension, and schistosomiasis) PH. In China, the prevalence of PAH is about 15–60 per million.[8] Group 4 PH results mainly from chronic thromboembolic pulmonary disease (CTEPH) but can also be from rare causes such as tumors or arteritis.[9] The exact incidence of CTEPH is unknown but appears to approximately 0.8% within one year among survivors of acute pulmonary embolism.[10] Such patients have higher risks than the general population during the COVID-19 pandemic, with a similar cumulative incidence of infection but worse outcomes,[11,12] which is why vaccination is essential. Despite inactivated whole-virion SARS-CoV-2 vaccines and recombinant protein subunit vaccines having been approved by World Health Organization (WHO) for emergency use in numerous countries and widely inoculated in China,[13] hesitancy due to safety concerns have hampered the acceptance of vaccinations among the population with PH. Most studies evaluated vaccination effectiveness without considering patients with pre-existing cardiopulmonary problems such as PH. Moreover, accumulating evidence suggests that COVID-19 aggravates clinical conditions and increases mortality in patients with PH.[14–16] Unfortunately, few published data are available on the role of vaccination in this population, which makes it difficult for physicians or patients to decide whether they should recommend or receive the vaccination. To address this issue, we conducted a prospective cohort study using the data from National Rare Diseases Registry System of China to assess PH-related major adverse events of the approved vaccines.
Methods Ethics statementsThis study was reviewed and approved by the Institutional Review Board of Peking Union Medical College Hospital (No.S-K1829), and all patients provided informed consent. The results are reported in accordance with the Strengthening the Reporting of Observational Studies in Epidemiology (STROBE) reporting guideline.[17]
Study design and participantsThis was a national prospective cohort study initially hosted on a digital platform, Questionnaire Star (https://www.wjx.cn/), with the link made available on the social network WeChat. We enrolled patients diagnosed according to the World Health Organization (WHO) diagnostic criteria as groups 1 and 4 PH by right heart catheterization or other necessary tests according to the current guidelines[6], among whom patients with idiopathic pulmonary arterial hypertension (IPAH) were registered in the National Rare Diseases Registry System of China. Inclusion criteria were age ≥18 years, patients who agreed to participate in the questionnaire survey, and patients to be followed up for 4–6 months. Patients who received the adenovirus vaccine were excluded, because its vaccination rate was too low.
We initiated our survey by asking, "Have you ever received vaccines against COVID-19?" (Response options: yes or no). Participants who responded with "no" were then asked the following question: "Why did you not get vaccinated?" The response options included "rejected by the local due to PH," "afraid of the side effects or allergy," "afraid of pulmonary hypertension progression," "unstable condition," and "waiting to be scheduled." Participants who were not vaccinated were followed up for 4 months, while those who received vaccines were followed up for 3 months after vaccination. The follow-up of all patients was mainly completed online through telephone, WeChat, and videos.
COVID-19 vaccinationComplete vaccination was defined as receiving two doses of inactivated vaccine (CoronaVac®, Sinovac Biotech, Beijing, China) or three doses of protein subunit vaccine (ZF2001®, Zhifei Longcom, Hefei, Anhui, China), while incomplete vaccination was defined as refusing further vaccination for any reason.
Data collectionData on patients' characteristics at first admission for PH were collected, including demographic information, disease duration, profiles on the diagnosis of PH, comorbidities (hypertension, diabetes mellitus, coronary arterial disease, and chronic kidney disease), WHO functional classes, and medical therapies (PH-targeted therapy, calcium channel blockers, anticoagulant drugs, diuretics, digoxin, steroids, immunosuppressant drugs, and antiplatelet therapy). We also collected clinical signs and nucleic acid test results to determine if a patient was infected with SARS-CoV-2.
OutcomesThe primary outcome was the composite of PH-related major adverse events, including all-cause mortality, hospitalization for heart failure/worsening PH, unplanned targeted medication adjustment, and worsening WHO functional class. The secondary outcomes were vaccination adverse reactions (ADRs), including injection site pain, fever, fatigue, swelling, dyspnea, palpitation, diarrhea, dizziness, and skin lesions.
Statistical analysisBaseline variables are summarized as frequency (%), mean ± standard deviation, or median (interquartile range) as appropriate. Comparisons were made between groups using the chi-squared test for categorical variables, two independent-sample Student's t-tests for normally distributed variables, and the Mann–Whitney U test for non-normally distributed variables.
Logistic regression models were used to evaluate the association between vaccination status and adverse events. To control for possible confounding factors in the patients' baseline characteristics, we used an inverse probability weighting (IPW) approach with the estimated propensity score.[18] The propensity score was calculated as the probability that patients would be vaccinated, using logistic regression analysis based on patient characteristics at baseline. Baseline homogeneity in patient characteristics between the vaccinated and unvaccinated groups after IPW adjustment was assessed using a generalized linear model. Furthermore, the unadjusted and IPW-adjusted odds ratios of adverse events between the vaccinated and unvaccinated groups were calculated. Given that the amount of missing data was very small, complete case analyses were performed. In all analyses, a two-tailed P-value <0.05 was considered statistically significant. All data were analyzed using SPSS version 25.0 (IBM Corp., Armonk, NY, USA).
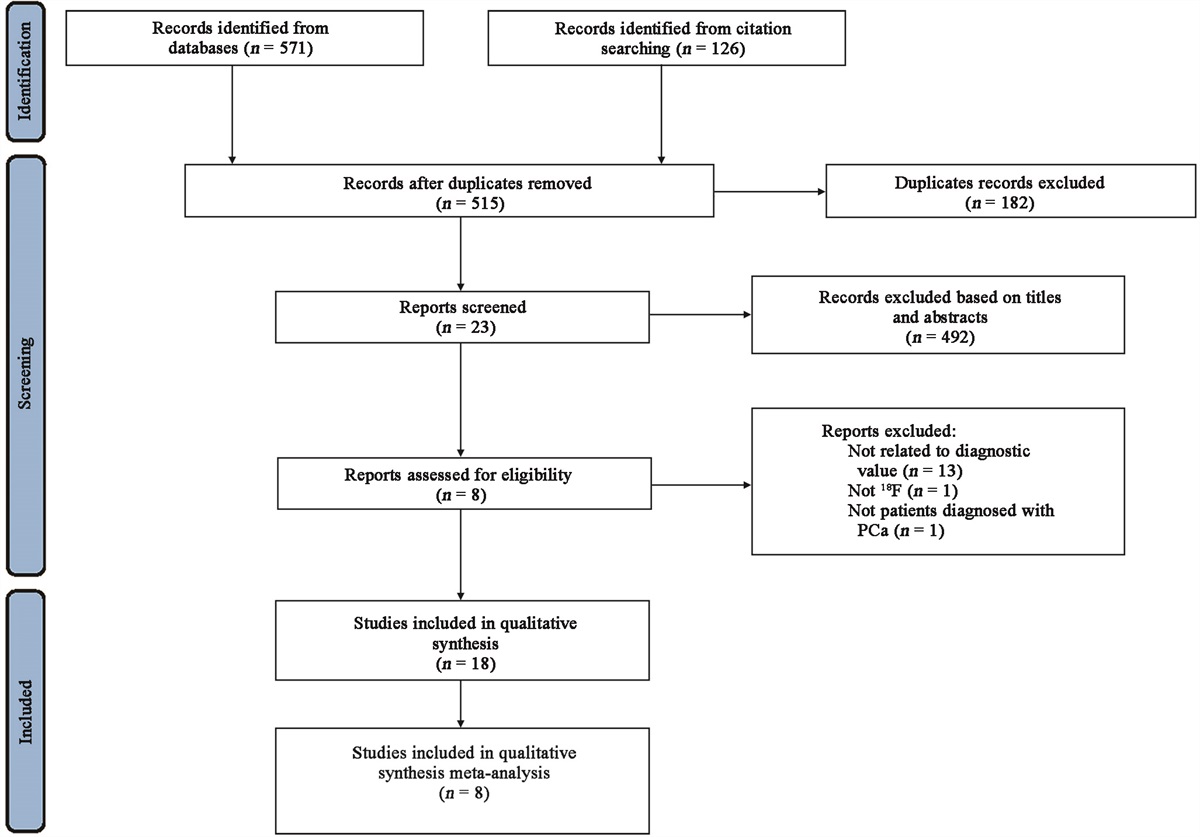
Results Study population and patient characteristics at baselineBetween October 2021 and April 2022, 806 patients diagnosed with PH were screened [Figure 1]. Among them, 78 patients aged <18 years, 5 patients with group 2 PH, 10 patients with group 3 PH, and 5 patients with group 5 PH were excluded. Two patients who received the adenovirus vaccine were also excluded. All patients were followed up for 4–6 months, two of whom were lost after one month of follow-up, and three were lost after 4 months of follow-up, representing a loss rate of 0.7%.
 Figure 1:
 Flowchart of the inclusion of patients. A total of 706 patients with PH were finally included in the study, with 428 vaccinated and 278 unvaccinated. COVID-19: Coronavirus disease 2019; PH: Pulmonary hypertension.
Finally, 706 patients with PH were included in the study, with 428 vaccinated (VAC group) and 278 unvaccinated (unVAC group). The reasons why patients did not receive vaccinations are presented in Figure 2. The main reason for refusal was fear of PH deterioration (197 [70.9%]), and 7 (2.5%) of patients in the unVAC group were waiting in line for vaccination. The baseline characteristics are summarized in Table 1. Overall, 543 (76.9%) patients were female, and the mean age was 40.3 ± 12.5 years with a mean duration of 8.2 ± 7.4 years after PH diagnosis. A total of 220 (31.2%) patients diagnosed as IPAH or heritable pulmonary arterial hypertension (HPAH); 313 (44.3%) had the PAH associated with CHD; 72 (10.2%) had PAH associated with CTD; 71 (10.1%) had CTEPH; and 26 (3.7%) had PH associated with Takayasu arteritis (TA).
 Figure 2:
 Reasons why patients with PH are unvaccinated against COVID-19. COVID-19: Coronavirus disease; PH: Pulmonary hypertension.
Table 1 - Baseline characteristics of the study population with PH stratified by COVID-19 vaccination status. Characteristics Total (n = 706) Unadjusted data Data adjusted with the use of IPW † Vaccinated (n = 428) Unvaccinated (n = 278) OR (95% CI) P-value Vaccinated (n = 428) Unvaccinated (n = 278) OR (95% CI) P-value Age (years) 40.3±12.5 40.0±12.4 41.0±12.7 0.34 (0.05–2.32) 0.275 40.2±0.6 40.4±0.9 1.20 (0.14–10.18) 0.866 Female 543 (76.9) 325 (75.9) 218 (78.4) 1.15 (0.80–1.65) 0.444 320 (74.8) 210 (75.5) 0.96 (0.64–1.46) 0.860 Obesity/BMI >28.0 kg/m2 19 (2.7) 10 (2.3) 9 (3.2) 0.72 (0.29–1.78) 0.472 9 (2.0) 17 (6.2) 0.31 (0.11–0.85) 0.023 Marasmus/BMI <18.5 kg/m2 118 (16.7) 59 (13.8) 59 (21.2) 0.59 (0.40–0.88) 0.010 68 (15.9) 44 (15.9) 1.00 (0.65–1.55) 1.000 Duration of the disease (years) 8.2±7.4 8.0±7.0 8.6±8.0 0.80 (0.29–2.72) 0.829 8.2±0.4 7.9±0.5 0.77 (0.24–2.51) 0.665 PAH (group 1 PH)* Idiopathic PAH/heritable PAH 220 (31.2) 144 (33.6) 76 (27.3) 1.35 (0.97–1.88) 0.078 129 (30.2) 85 (30.4) 0.99 (0.68–1.45) 0.969 PAH associated with CHD 313 (44.3) 193 (45.1) 120 (43.2) 1.08 (0.80–1.47) 0.614 193 (45.0) 122 (43.9) 1.05 (0.74–1.48) 0.806 PAH associated with CTD 72 (10.2) 32 (7.5) 40 (14.4) 0.48 (0.29–0.79) 0.003 45 (10.4) 29 (10.4) 1.00 (0.57–1.74) 0.991 Group 4 PH CTEPH 71 (10.1) 47 (11.0) 24 (8.6) 1.22 (0.73–2.03) 0.449 42 (9.9) 31 (11.0) 0.88 (0.49–1.60) 0.683 TA-PH 26 (3.7) 11 (2.6) 15 (5.4) 0.46 (0.21–1.02) 0.057 17 (4.0) 11 (3.8) 1.07 (0.45–2.56) 0.880 Concomitant disease Hypertension 55 (7.8) 29 (6.8) 26 (9.4) 0.70 (0.41–1.22) 0.214 31 (7.2) 24 (8.7) 0.82 (0.42–1.57) 0.538 Diabetes mellitus 12 (1.7) 6 (1.4) 6 (2.2) 1.55 (0.50–4.86) 0.451 6 (1.5) 3 (1.1) 0.79 (0.23–2.67) 0.702 Coronary arterial disease 27 (3.8) 15 (3.5) 12 (4.3) 1.24 (0.57–2.70) 0.583 22 (5.2) 15 (5.5) 1.05 (0.41–2.71) 0.917 Chronic kidney disease 15 (2.1) 1 (0.2) 14 (5.0) 22.64 (2.96–173.20) <0.001 4 (1.0) 6 (2.1) 2.22 (0.29–17.08) 0.444 WHO functional class <0.001 1.01 (0.72–1.42) 0.958 Class I 106 (15.0) 92 (21.5) 14 (5.0) 5.16 (2.88–9.27) Class II 297 (42.1) 211 (49.3) 86 (30.9) 2.17 (1.58–2.98) Class III 261 (37.0) 120 (28.0) 141 (50.7) 0.38 (0.28–0.52) Class IV 42 (5.9) 5 (1.2) 37 (13.3) 0.08 (0.03–0.20) Single-targeted therapy 193 (27.3) 123 (28.7) 70 (25.2) 1.20 (0.85–1.69) 0.300 116 (27.2) 80 (28.7) 0.93 (0.62–1.38) 0.710 Double-targeted therapy 367 (52.0) 214 (50.0) 153 (55.0) 0.82 (0.60–1.11) 0.191 218 (50.9) 143 (51.6) 0.97 (0.69–1.38) 0.865 Triple-targeted therapy 74 (10.5) 38 (8.9) 36 (12.9) 0.66 (0.40–1.06) 0.084 43 (10.0) 28 (9.9) 1.01 (0.59–1.72) 0.975 Anticoagulation 124 (17.6) 67 (15.7) 57 (20.5) 0.74 (0.50–1.09) 0.102 65 (15.3) 54 (19.4) 0.75 (0.48–1.19) 0.228 Diuretic use 373 (52.8) 185 (43.2) 188 (67.6) 0.36 (0.27–0.50) <0.001 223 (52.1) 145 (52.1) 1.00 (0.71–1.42) 0.992 Calcium-channel blocker use 14 (2.0) 10 (2.3) 4 (1.4) 0.61 (0.19–1.97) 0.584 9 (2.0) 8 (3.0) 1.52 (0.44–5.30) 0.508 Digoxin use 212 (30.0) 109 (25.5) 103 (37.1) 0.59 (0.43–0.82) 0.001 126 (29.5) 84 (30.1) 0.97 (0.67–1.40) 0.871 Steroid use 92 (13.0) 38 (8.9) 54 (19.4) 0.40 (0.26–0.63) <0.001 54 (12.5) 43 (15.4) 0.79 (0.47–1.32) 0.362 Immunosuppressant drug use 73 (10.3) 31 (7.2) 42 (15.1) 0.45 (0.28–0.74) 0.001 40 (9.3) 32 (11.5) 0.79 (0.45–1.39) 0.414 Antiplatelet therapy 43 (6.1) 25 (5.8) 18 (6.5) 1.12 (0.60–2.09) 0.731 32 (7.5) 16 (5.8) 0.76 (0.38–1.54) 0.450Data are expressed as mean ± standard deviation or n (%). *Except for idiopathic PAH/heritable PAH, PAH associated with CHD, and PAH associated with CTD, there were also three patients with PAH associated with portal hypertension and one patient with pulmonary veno-occlusive disease included in this study. †The adjusted numbers were rounded to integer values and therefore they may not exactly match the percentages. BMI: Body mass index; CHD: Congenital heart disease; CI: Confidence interval; COVID-19: Coronavirus disease 2019; CTD: Connective tissue disease; CTEPH: Chronic thromboembolic pulmonary hypertension; IPW: Inverse probability weighting; OR: Odds ratio; PAH: Pulmonary arterial hypertension; PH: Pulmonary hypertension; SD: Standard deviation; TA: Takayasu arteritis; WHO: World Health Organization.
Compared with VAC group, there were more patients with marasmus (body mass index <18.5 kg/m2; 59 [21.2%] vs. 59 [13.8%], P = 0.010), more cases of PAH associated with CTD (40 [14.4%] vs. 32 [7.5%], P = 0.003), and more cases with the comorbidity of chronic kidney disease (14 [5.0%] vs. 1 [0.2%], P <0.001) in the unVAC group. Vaccinated patients showed significantly better heart function than those unvaccinated, with higher rates of WHO functional class I (92 [21.5%] vs. 14 [5.0%], P <0.001) and class II (211 [49.3%] vs. 86 [30.9%], P <0.001), and lower rates of class III (120 [28.0%] vs. 141 [50.7%], P <0.001) or class IV (5 [1.2%] vs. 37 [13.3%], P <0.001). There was no significant difference in targeted therapies between the two cohorts. However, treatments with diuretics (188 [67.6%] vs. 185 [43.2%], P <0.001), digoxin (103 [37.1%] vs. 109 [25.5%], P = 0.001), steroids (54 [19.4%] vs. 38 [8.9%], P <0.001), and immunosuppressant drugs (42 [15.1%] vs. 31 [7.2%], P = 0.001) were more common in the unVAC group than in the VAC group. After adjustment for IPW, all clinical covariates were well balanced between the groups, except for obesity [Table 1].
Adverse events after vaccinationPH-related deterioration events occurred in a total of 57 (8.1%) patients during the follow up. We observed numerically more patients with PH-related major adverse events in the unVAC group than in the VAC group (35 [12.6%] vs. 22 [5.1%]), but the difference was not significant after IPW adjustment (P = 0.302). Regarding the subcomponent of primary outcomes, similar results were observed in the worsened WHO functional class (32 [11.5%] vs. 19 [4.4%], IPW-adjusted P = 0.227), unplanned medication adjustments (27 [9.7%] vs. 10 [2.3%], adjusted P = 0.010), and hospitalization due to heart failure (19 [6.8%] vs. 8 [1.9%], adjusted P = 0.072). The only case of death due to severe mycoplasma pneumonia occurred in the VAC group, resulting in an overall all-cause mortality of 0.1%. All the reported PH-related major adverse events are listed in Table 2.
Table 2 - Adverse events of PH patients during the follow-up period: unadjusted and adjusted analyses. Adverse event Total (n = 706) Unadjusted data Data adjusted using IPW † Vaccinated (n = 428) Unvaccinated (n = 278) OR (95% CI) P-value Vaccinated (n = 428) Unvaccinated (n = 278) OR (95% CI) P-value Total deterioration* 57 (8.1) 22 (5.1) 35 (12.6) 0.38 (0.22–0.66) <0.001 27 (6.3) 24 (8.6) 0.72 (0.39–1.34) 0.302 Worsened WHO functional class 51 (7.2) 19 (4.4) 32 (11.5) 0.36 (0.20–0.64) 0.001 23 (5.3) 22 (7.8) 0.67 (0.34–1.29) 0.227 Unplanned medication adjustments 37 (5.2) 10 (2.3) 27 (9.7) 0.22 (0.11–0.47) <0.001 10 (2.4) 17 (6.2) 0.37 (0.17–0.79) 0.010 Hospitalization due to heart failure 27 (3.8) 8 (1.9) 19 (6.8) 0.26 (0.11–0.60) 0.002 9 (2.1) 13 (4.7) 0.44 (0.18–1.08) 0.072 All-cause mortality 1 (0.1) 1 (0.2) 0 (0) NE 1 (0.2) 0 (0) NEData are expressed as n (%). *Total deterioration represents the total number of PH patients with adverse events occurred during the follow-up period. †The adjusted numbers were rounded to integer values and therefore they may not exactly match the percentages. CI: Confidence interval; COVID-19: Coronavirus disease 2019; IPW: Inverse probability weighting; NE: Not Evaluated; OR: Odds ratio; PH: Pulmonary hypertension; WHO: World Health Organization.
Among the 428 patients with PH in the VAC group, 30 received the protein subunit vaccine, and the remaining 398 patients received inactivated vaccine. Among them, 216 (50.5%) reported at least one post-vaccination side effects or adverse events. The most frequent side effect was injection site pain (159 [37.1%]), followed by fatigue (26 [6.1%]), total deterioration (22 [5.1%]), palpitations (20 [4.7%]), and dyspnea (15 [3.5%]). A list of side effects is presented in Table 3.
Table 3 - Adverse events of PH patients after vaccination against COVID-19. Adverse event Total (n = 428) Inactivated vaccine (n = 398) Protein subunit vaccine (n = 30) Injection site pain 159 (37.1) 144 (36.2) 15 (50.0) Fever 11 (2.6) 9 (2.3) 2 (6.7) Fatigue 26 (6.1) 21 (5.3) 5 (16.7) Swelling 3 (0.7) 3 (0.8) 0 (0) Dyspnea 15 (3.5) 15 (3.8) 0 (0) Palpitation 20 (4.7) 18 (4.5) 2 (6.7) Diarrhea 4 (0.9) 4 (1.0) 0 (0) Dizziness 6 (1.4) 4 (1.0) 2 (6.7) Skin lesion 2 (0.5) 2 (0.5) 0 (0) Total deterioration* 22 (5.1) 22 (5.5) 0 (0)Data are expressed as n (%). *Total deterioration represents the total number of PH patients with adverse events occurred during the follow-up period. COVID-19: Coronavirus disease; PH: Pulmonary hypertension.
This real-world population-based prospective cohort study recruited more than 700 patients with WHO groups 1 and 4 PH diagnoses across 30 provinces, municipalities, and autonomous regions in China, and investigated the adverse outcomes of COVID-19 vaccination. To our knowledge, this is one of the largest studies to evaluate the COVID-19 vaccination rate and safety in a specific population with a devastating cardiopulmonary disease. Our results indicate that inactivated whole-virion and protein subunit vaccines are well tolerated. However, uncertainty and hesitancy exist in unvaccinated patients about whether to receive the vaccination, which is mainly driven by concerns about disease deterioration after vaccination. Our study revealed no significant association between vaccination and disease deterioration.
留言 (0)