
記住我


Acute pulmonary embolism (APE) is the 3rd most prevalent cardiovascular disease globally, after ischemic heart disease and stroke.[1] Early detection and accurate diagnosis of APE are crucial for subsequent evaluation and treatment. Nonetheless, the clinical manifestations of APE are non-specific, making it easier to be missed or misdiagnosed. The current optimal diagnostic strategy for suspected APE is controversial. The European guidelines recommend a diagnostic strategy based on clinical probability assessment, including the Wells score,[2] revised Geneva score,[3] and Years algorithm.[4] However, one survey suggested that most of the investigated hospitals did not use the currently recommended approach when evaluating patients diagnosed with suspected APE.[5] Meanwhile, other scholars reiterate that the current clinical assessment may not be used to detect APE among critically ill patients.[6,7] What's more, implementing the assessment protocol is a labor-intensive and time-consuming task, making it inapplicable to the routine diagnosis of APE.[8] Therefore, there is a need for a simple and objective assessment protocol for diagnosing APE.
Data-driven machine learning (ML) techniques improve risk prediction performance by discovering novel risk predictors and understanding the complex interactions between them. ML is increasingly being used to diagnose a wide range of medical conditions, particularly cardiovascular diseases.[9] It improves the accuracy of cardiovascular event prediction in asymptomatic population[10] and stroke prediction in hypertensive populations.[11] A new venous thromboembolism (VTE) prediction model based on ML has been recently developed for young hospitalized patients.[12] which has been shown to quickly and accurately detect VTE, thus contributing to the standardization of disease prevention and management. Therefore, this work developed an ML-based model for diagnosing APE, and then compared its performance with the Wells score, revised Geneva score, and Years algorithm in diagnosing APE.
Methods Patient enrollment and data collectionThis study complied with the Declaration of Helsinki and was approved by the Ethics Committee of China-Japan Friendship Hospital (IRB No. 2022-KY-048). Informed consent was waived due to its retrospective design. Patients with suspected APE were retrospectively enrolled between January 2019 and December 2019 in China-Japan Friendship Hospital. The study enrolled patients older than 18 years and underwent computed tomography pulmonary angiography (CTPA) in our hospital. Exclusion criteria included: (1) diagnosed with Takayasu arteritis, chronic thromboembolic pulmonary disease, pulmonary artery sarcoma, fibrosing mediastinitis, and pulmonary vascular malformation; (2) readmission for definite APE; (3) poor imaging quality of CTPA, which failed to diagnose; (3) loss to follow-up within 3 months; and (4) incomplete clinical information. We collected the basic demographic information, clinical symptoms, vital signs at onset, and laboratory data from the electronic medical records. APE was finally diagnosed by two experienced physicians according to clinical information and CTPA images. All patients were followed up for 3 months by outpatient visits and telephone visits to confirm or exclude the diagnosis of APE.
Feature selection and dimensionality reductionAccording to the current clinical assessment of APE.[8] 27 clinical characteristics were collected from the electronic medical record system including gender, age, previous APE/deep venous thrombosis (DVT), surgery or fracture history within the past month, tachycardia, chronic heart failure, active malignancy, chest pain, dyspnea, hemoptysis, syncope, unconsciousness, chest tightness, fever, lower limb pain, lower limb weakness, lower limb edema, hemodynamic stability, systolic blood pressure, blood diastolic pressure, heart rate, arterial oxygen saturation, oxygenation index, biomarkers of myocardial injury (creatine kinase-MB [CK-MB], cardiac troponin T [cTnT], N-terminal pro-B-type natriuretic peptide [NT pro-BNP]), and D-dimer.
Dimensionality reduction was performed before modeling given that a high-dimensional feature space may cause model overfitting. We adopted a two-step flow for feature dimensionality reduction. Initially, the statistical difference between APE and non-APE patients for all features was compared and features with P <0.05 were retained for subsequent analysis. The Pearson correlation coefficient (r) was then computed between each pair of the remained features. If one pair of features exhibited an absolute value of r over 0.85, then the feature with the smaller P-value was kept for modeling.
ML model developmentThe ML model was constructed based on the selected features. For unbiased estimates of model accuracy, the collected data of enrolled patients were randomly divided into the training and testing sets by a 3:1 ratio. The training set trained the ML model and optimized the model parameters. A total of eight independent ML algorithms were selected to develop the model, including Naive Bayes, logistic regression, K-nearest neighbors, random forest (RF), decision tree, gradient boosting decision tree (GBDT), support vector machine, and multi-layer perceptron. Five-fold cross-validation was applied in the training set to obtain the best parameters for each model. The receiver operating characteristic (ROC) analysis and the area under the curve (AUC) were evaluated to assess the diagnostic performance of each model. Eventually, the average AUC values from the cross-validation were obtained to describe the discriminatory power of certain trained models incorporating specific parameters.
ML model test and validationThe ML model with optimal outcomes on the training set was applied to the testing set, in order to further assess the diagnostic performance of the model. Additionally, current clinical assessment strategies, including the Wells score, revised Geneva score, and Years algorithm were used for APE diagnosis based on the testing dataset. The ML model was then compared with the current clinical assessment strategies incorporating the D-dimer levels to comprehensively assess the diagnostic performance.
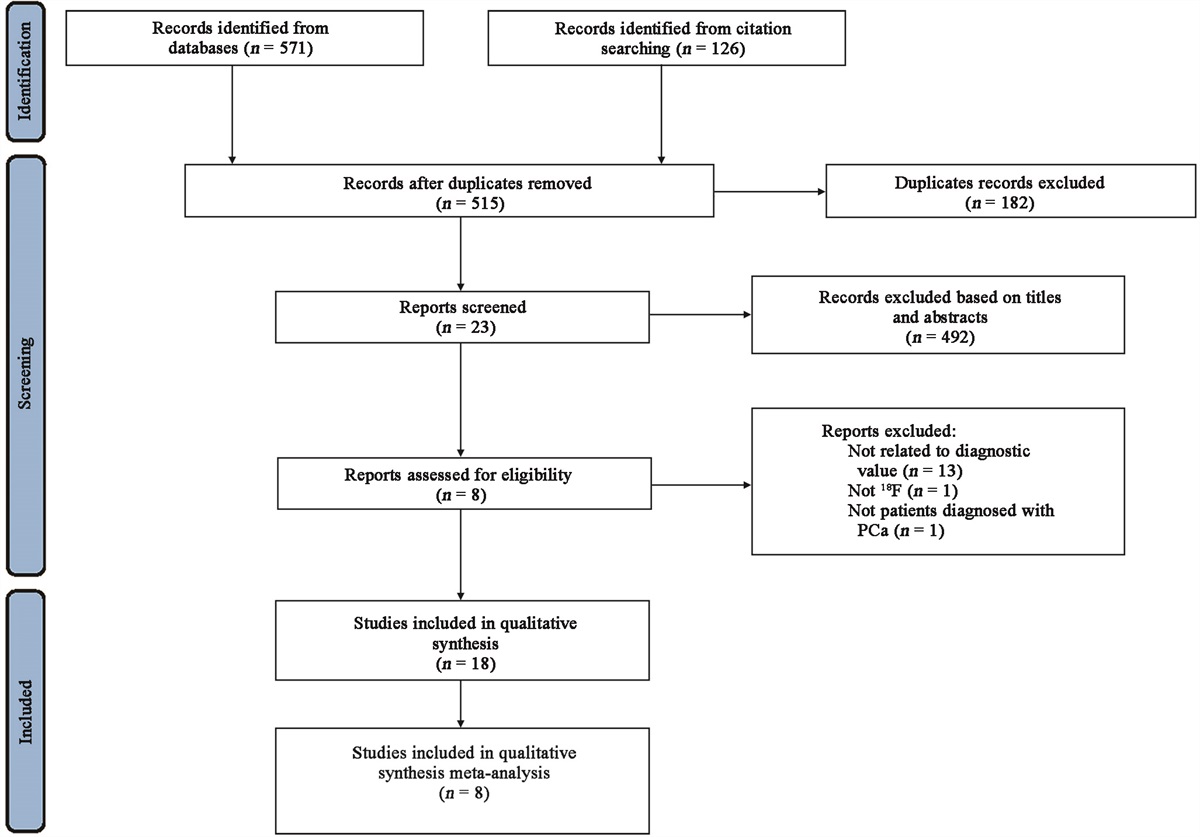
Patients suspected of APE between January and August 2018 in the China-Japan Friendship Hospital were enrolled as an internal validation set. After constructing and testing the model, the final model with comparable performance and diagnostic stability was determined for internal validation. Figure 1 demonstrates a flowchart showing the overall scheme of the study.
 Figure 1:
 The flowchart of the study. APE: Acute pulmonary embolism; ML: Machine learning.
Statistical analysisThe baseline characteristics were summarized as median with interquartile range or n (%) appropriately. Differences in variables were compared by the Mann–Whitney U test for measurement variables and by χ2 test or Fisher's exact test for categorical variables. To test the diagnostic efficacy of different models, sensitivity, specificity, positive predictive value (PPV), and negative predictive value (NPV), were computed using the ROC curve and AUC analysis. The Delong test was used to compare the difference between diagnostic models. A value of P <0.05 was considered statistically significant. Statistical analyses were performed using SPSS version 26.0 (SPSS Inc; Chicago, Illinois, USA) and Python software version 3.7 (https://www.python.org/).
Results Study populationA total of 454 patients (241 males, median age 65 years) were randomly grouped into training (n = 340, 187 males, median age 65 years) and testing set (n = 114, 54 males, median age 66 years). In the training and testing datasets (n = 454), 113 (24.9%) cases were eventually diagnosed with APE [Supplementary Table 1, https://links.lww.com/CM9/B703]. A total of 204 cases (107 males, median age 66 years) were enrolled in the internal validation set; 59 (28.9%) of them were finally diagnosed with APE [Supplementary Table 1, https://links.lww.com/CM9/B703]. The baseline characteristics of the training and testing datasets were comparable [Supplementary Table 2, https://links.lww.com/CM9/B703].
Feature selection and ML model developmentAccording to the differential analysis results, 10 out of 27 features (including surgery or fracture within the past month, tachycardia, chronic heart failure, chest pain, hemoptysis, lower limb pain, heart rate, D-dimer, cTnT, and arterial oxygen saturation) displayed significant differences between APE and non-APE groups based on training dataset [Table 1].
Table 1 - The differential analysis of all features based on the training dataset. Features APEData are presented as median (Q1, Q3) or n (%).*U value; †χ2 value; ‡Fisher's exact test. APE: Acute pulmonary embolism; CK-MB: Creatine kinase-MB; cTnT: Cardiac troponin T; DVT: Deep venous thrombosis; NT pro-BNP: N-terminal pro-B-type natriuretic peptide.
After calculating the Pearson correlation coefficient and filtering features, eight clinical features, including D-dimer, cTNT, arterial oxygen saturation, heart rate, chest pain, lower limb pain, hemoptysis, and chronic heart failure were identified to construct ML models. These selected features were then placed into the training dataset to cross-validate the candidate models and obtain the warranted model with the best diagnostic performance.
In total, eight candidate models based on different algorithms were constructed, and Table 2 shows their diagnostic performance on the training set. The RF model achieved the best discriminatory performance (AUC = 0.774), which was applied to the testing set for further validation of the model stability. Figure 2 shows the weight of the selected eight metrics in the trained RF. The weight of the D-dimer was 0.35, contributing the most to the model. In the testing set, the RF model achieved an excellent unbiased estimate of the discriminant capacity (AUC = 0.813, 95% confidence interval [CI]: 0.729, 0.880).
Table 2 - Diagnostic performance of different ML models used for APE diagnosis. ML models AUC Random forest 0.774 Naïve Bayes 0.736 Decision tree 0.737 K-nearest neighbors 0.710 Logistic regression 0.771 Multi-layer perceptron 0.770 Support vector machine 0.771 Gradient boosting decision tree 0.761APE: Acute pulmonary embolism; AUC: Area under the curve; ML: Machine learning.
 Figure 2:
 The weight of the filtered features in the RF model. cTnT: Cardiac troponin T; RF: Random forest.
Diagnostic performance and internal validationThe diagnostic capacity of the RF model was preferable among established models. However, it was necessary to compare it with the current clinical strategies in terms of APE diagnosis. Therefore, we computed the AUC of the RF model and three usual clinical assessment strategies using testing dataset [Table 3]. Since D-dimer is an important enrolled parameter that contributed the most in the RF model and evidence-based guidelines advise D-dimer detection in APE diagnosis, the clinical assessment strategies combined with D-dimer were used to compare with the RF model. Table 3 shows that the RF model achieved the best diagnostic performance and the highest NPV. The AUC of the RF model was 0.813 (95% CI: 0.729, 0.880), followed by the Years algorithm (0.719, 95% CI: 0.627, 0.799). The revised Geneva score with D-dimer displayed the best diagnostic specificity for APE (specificity = 0.744 [95% CI: 0.639, 0.832]). Figure 3 shows the ROC curves of different models evaluated on the testing set. The diagnostic efficacy of the RF model was not inferior to any other clinical assessment strategies. Specifically, the RF model outperformed Wells score combined with D-dimer significantly (P = 0.030) [Figure 3]. Finally, we verified the established RF model in the internal validation dataset. As shown in Figure 4, the AUC of the RF model in the validation dataset reached 0.726 (95% CI: 0.652, 0.801).
Table 3 - Assessment of different models for APE diagnosis. Different models AUCAPE: Acute pulmonary embolism; AUC: Area under the curve; CI: Confidence interval; NPV: Negative predictive value; PPV: Positive predictive value; RF: Random forest.
 Figure 3:
 The ROC curves of different models for APE diagnosis in the testing dataset. APE: Acute pulmonary embolism; AUC: Area under the curve; ML: Machine learning; ROC: Receiver operating characteristic.
 Figure 4:
 The ROC curve of the RF model for APE diagnosis in the validation dataset. APE: Acute pulmonary embolism; AUC: Area under the curve; RF: Random forest; ROC: Receiver operating characteristic.
DiscussionIn the present study, we developed and validated the ML model based on clinical and laboratory data for diagnosing APE and further compared it with the current clinical assessment strategies. In contrast with the Wells score combined with D-dimer, the revised Geneva score with D-dimer, and the Years algorithm, the RF model demonstrated the best performance in diagnosing APE.
Many previous studies have appreciated the importance of clinical assessment in the diagnosis of APE[8,13–15]; however, a standard assessment criterion is currently lacking. Notably, using clinical assessment to its full potential could help in the safe exclusion of APE without the need for CTPA examination. Van der Hulle et al[4] discovered that the Years algorithm, which applies to all patients, reduced the number of CTPA examinations by 14%. However, the Wells score does not apply to inpatients when it comes to other clinical prediction rules.[16] The Wells score and the revised Geneva score are not fully applicable to APE diagnosis in critically ill patients.[6] These rules are complex, thereby limiting their use in diagnosing APE.[17] One study confirmed that only 50–60% of clinicians adhered to standardized evaluation.[18] The Years algorithm is a novel and relatively simple clinical assessment strategy, hence convenient for clinical use. However, its simplicity makes it easy to misdiagnose. Therefore, the Years algorithm should be used with caution.[19] Importantly, the Years algorithm has a subjective item that is highly dependent on the experience of the clinician.
ML has been used in numerous medical conditions, which can reduce physician workload, and accelerate diagnosis.[20] ML has an advantage in handling massive, complex, and mixed data types, allowing it to automatically detect APE.[21] Previous studies have used ML to predict APE, focusing on specific patients, including young patients or those diagnosed with coronavirus pneumonia, etc.[12,22,23] Banerjee et al[24] proposed a customized risk score system incorporating clinical parameters for patients suspected of APE to assist clinical decisions; the results revealed that the AUC of the scoring system to diagnose APE was 0.90 (0.87–0.91). Meanwhile, the neural network model has the potential to predict the APE development and outperforms current clinical scores (the AUC of the neural network model, Wells score, and revised Geneva score were 0.73–0.81, 0.48, and 0.53, respectively). Villacorta et al[25] used an elastic net model to develop and internally validate a logistic regression based on four clinical variables and D-dimer levels. They discovered that the ML model outperformed traditional scores in the emergency department for risk stratification of APE. Hou et al[26] used the GBDT model to diagnose APE in hospitalized patients and found that it exhibits more superiority in APE diagnosis (AUC = 0.799). This implies that it can more accurately identify APE patients than traditional clinical scores, and improve prognosis by diagnosing APE at an earlier stage, thus promoting timely intervention.
The ML model, specifically RF, showed the best performance in diagnosing APE compared to the available clinical assessment strategies. With the existing clinical data, we sought to establish whether the novel model based on ML could improve the diagnostic performance of APE, rather than searching for novel diagnosing parameters. Of note, the RF model has been used in diagnosing various diseases. It combines multiple regression trees comprising bootstrap aggregation and randomization of predictors to achieve high predictive accuracy.[27] Research on cardiovascular disease revealed that the RF model is superior to other ML models in improving the accuracy of cardiovascular disease risk prediction.[28] A retrospective cohort study on patients with asthma exacerbation developed an RF model with an 88% accuracy in distinguishing the APE status (AUC = 0.899), which assisted in evaluating the effect of APE on outcomes.[29] Emir et al[30] also found that the RF model could screen patients who may need more comprehensive examinations for fibromyalgia. Moreover, they found that the RF model could quantify the probability of fibromyalgia, enabling more precise diagnosis and individualized management. Similarly, our findings revealed that the RF model is superior to other ML models, providing an accurate and comprehensive tool for APE diagnosis.
The ML model in the present study is superior to traditional clinical assessment strategies in APE diagnosis, but it needs a combination of more relevant data underlying the patient condition for better disease management. Multi-modal ML, a form of artificial intelligence, constructs models that could cope with related data associated with multiple modalities.[31] In routine practice, physicians rely on different data types to make clinical decisions, including textual data like medical history, laboratory, and imaging data. Therefore, a multi-modal fusion model is necessary to offer an appropriate method for integrating multiple information. One study developed a multi-modal fusion model to detect APE by integrating a medical record system with CT imaging and found that the multi-modal model outperforms the single-modal model.[32] Similarly, the ML model in our study can be combined with CT imaging data to further improve the diagnostic accuracy of APE; however, this needs further research.
This study has several limitations. First, it is a retrospective study in a single center, which may cause bias. Secondly, considering the inaccessible property of ML algorithms, the RF model in this work is unable to compare with other published ML models in terms of diagnostic efficacy. Thirdly, the metrics in the current model are less specific since the model aims to quickly diagnose patients with highly suspicious APE. Furthermore, the data in this work were manually extracted rather than automatically. If the model is integrated with the natural language processing system in the future, it will automatically detect potential APE in patients for clinicians and standardize the diagnosis of APE.
In conclusion, the RF model constructed based on clinical data on D-dimer, cTNT, arterial oxygen saturation, heart rate, chest pain, lower limb pain, hemoptysis, and chronic heart failure has better diagnostic efficacy and accuracy than the current clinical assessment models in APE diagnosis. This model may help in accurately diagnosing the APE earlier.
FundingThis work was supported by grants from the Chinese Academy of Medical Sciences Innovation Fund for Medical Sciences (No. 2021-I2M-1-049), the Elite Medical Professionals Project of China-Japan Friendship Hospital (No. ZRJY2021-BJ02), and the National High Level Hospital Clinical Research Funding (No. 2022-NHLHCRF-LX-01).
Conflicts of interestHan Kang and Rongguo Zhang are employed by Institute of Advanced Research, Infervision Medical Technology Co., Ltd. All authors declare that the research was conducted in the absence of any commercial or financial relationships that could be construed as a potential conflict of interest.
References 1. Raskob GE, Angchaisuksiri P, Blanco AN, Buller H, Gallus A, Hunt BJ, et al. Thrombosis: A major contributor to global disease burden. Arterioscler Thromb Vasc Biol 2014;34: 2363–2371. doi: 10.1161/ATVBAHA.114.304488. 2. Ceriani E, Combescure C, Le Gal G, Nendaz M, Perneger T, Bounameaux H, et al. Clinical prediction rules for pulmonary embolism: A systematic review and meta-analysis. J Thromb Haemost 2010;8: 957–970. doi: 10.1111/j.1538-7836.2010.03801.x. 3. Klok FA, Mos IC, Nijkeuter M, Righini M, Perrier A, Le Gal G, et al. Simplification of the revised Geneva score for assessing clinical probability of pulmonary embolism. Arch Intern Med 2008;168: 2131–2136. doi: 10.1001/archinte.168.19.2131. 4. van der Hulle T, Cheung WY, Kooij S, Beenen LFM, van Bemmel T, van Es J, et al. Simplified diagnostic management of suspected pulmonary embolism (the YEARS study): A prospective, multicentre, cohort study. Lancet 2017;390: 289–297. doi: 10.1016/S0140-6736(17)30885-1. 5. Hsu N, Soo Hoo GW. Underuse of clinical decision rules and d-Dimer in suspected pulmonary embolism: A nationwide survey of the Veterans Administration healthcare system. J Am Coll Radiol 2020;17: 405–411. doi: 10.1016/j.jacr.2019.10.001. 6. Girardi AM, Bettiol RS, Garcia TS, Ribeiro GLH, Rodrigues ÉM, Gazzana MB, et al. Wells and Geneva scores are not reliable predictors of pulmonary embolism in critically ill patients: A retrospective study. J Intensive Care Med 2020;35: 1112–1117. doi: 10.1177/0885066618816280. 7. Donnelly M, Snyman L, Conroy P, Hamza MK, Murphy I, et al.Abdelaal Ahmed Mahmoud M Alkhatip A Years algorithm versus Wells' score: Predictive accuracies in pulmonary embolism based on the gold standard CT pulmonary angiography. Crit Care Med 2020;48: 704–708. doi: 10.1097/CCM.0000000000004271. 8. Konstantinides SV, Meyer G, Becattini C, Bueno H, Geersing GJ, Harjola VP, et al. 2019 ESC Guidelines for the diagnosis and management of acute pulmonary embolism developed in collaboration with the European Respiratory Society (ERS). Eur Heart J 2020;41: 543–603. doi: 10.1093/eurheartj/ehz405. 9. Than MP, Pickering JW, Sandoval Y, Shah ASV, Tsanas A, Apple FS, et al. Machine learning to predict the likelihood of acute myocardial infarction. Circulation 2019;140: 899–909. doi: 10.1161/CIRCULATIONAHA.119.041980. 10. Ambale-Venkatesh B, Yang X, Wu CO, Liu K, Hundley WG, McClelland R, et al. Cardiovascular event prediction by machine learning: The multi-ethnic study of atherosclerosis. Circ Res 2017;121: 1092–1101. doi: 10.1161/CIRCRESAHA.117.311312. 11. Huang X, Cao T, Chen L, Li J, Tan Z, Xu B, et al. Novel insights on establishing machine learning-based stroke prediction models among hypertensive adults. Front Cardiovasc Med 2022;9: 901240. doi: 10.3389/fcvm.2022.901240. 12. Liu H, Yuan H, Wang Y, Huang W, Xue H, Zhang X. Prediction of venous thromboembolism with machine learning techniques in young-middle-aged inpatients. Sci Rep 2021;11: 12868. doi: 10.1038/s41598-021-92287-9. 13. Sherk WM, Stojanovska J. Role of clinical decision tools in the diagnosis of pulmonary embolism. AJR Am J Roentgenol 2017;208: W60–W70. doi: 10.2214/AJR.16.17206. 14. Douillet D, Roy PM, Penaloza A. Suspected acute pulmonary embolism: Gestalt, scoring systems, and artificial intelligence. Semin Respir Crit Care Med 2021;42: 176–182. doi: 10.1055/s-0041-1723936. 15. Kearon C, de Wit K, Parpia S, Schulman S, Afilalo M, Hirsch A, et al. Diagnosis of pulmonary embolism with d-Dimer adjusted to clinical probability. N Engl J Med 2019;381: 2125–2134. doi: 10.1056/NEJMoa1909159. 16. van Es N, van der Hulle T, van Es J, et al. Wells Rule and d-Dimer Testing to Rule Out Pulmonary Embolism: A Systematic Review and Individual-Patient Data Meta-analysis. Ann Intern Med. 2016;165: 253–261. doi: 10.7326/M16-0031. 17. Roy PM, Meyer G, Vielle B, Le Gall C, Verschuren F, Carpentier F, et al. Appropriateness of diagnostic management and outcomes of suspected pulmonary embolism. Ann Intern Med. 2006;144: 157–164. doi: 10.7326/0003-4819-144-3-200602070-00003. 18. Runyon MS, Richman PB, Kline JA; Pulmonary Embolism Research Consortium Study Group. Emergency medicine practitioner knowledge and use of decision rules for the evaluation of patients with suspected pulmonary embolism: Variations by practice setting and training level. Acad Emerg Med 2007;14: 53–57. doi: 10.1197/j.aem.2006.07.032. 19. Eddy M, Robert-Ebadi H, Richardson L, Bellesini M, Verschuren F, Moumneh T, et al. External validation of the YEARS diagnostic algorithm for suspected pulmonary embolism. J Thromb Haemost 2020;18: 3289–3295. doi: 10.1111/jth.15083. 20. Handelman GS, Kok HK, Chandra RV, Razavi AH, Lee MJ, Asadi H. eDoctor: Machine learning and the future of medicine. J Intern Med 2018;284: 603–619. doi: 10.1111/joim.12822. 21. Weikert T, Winkel DJ, Bremerich J, Stieltjes B, Parmar V, Sauter AW, et al. Automated detection of pulmonary embolism in CT pulmonary angiograms using an AI-powered algorithm. Eur Radiol 2020;30: 6545–6553. doi: 10.1007/s00330-020-06998-0. 22. van de Sande D, van Genderen ME, Rosman B, Diether M, Endeman H, van den Akker JPC, et al. Predicting thromboembolic complications in COVID-19 ICU patients using machine learning. J Clin Transl Res 2020;6: 179–186. doi: 10.18053/jctres.06.202005.003. 23. Mora D, Nieto JA, Mateo J, Bikdeli B, Barco S, Trujillo-Santos J, et al. Machine learning to predict outcomes in patients with acute pulmonary embolism who prematurely discontinued anticoagulant th
留言 (0)