
記住我


This retrospective analysis was approved by the Ethics Review Committee of the study site (Toyama Nishi General Hospital Ethics Committee, Certificate number: 20–10). All study participants provided informed consent in written form. This study was performed in accordance with the relevant guidelines and regulations of this journal, including the principles of Declaration of Helsinki. This is a purely observatory study.
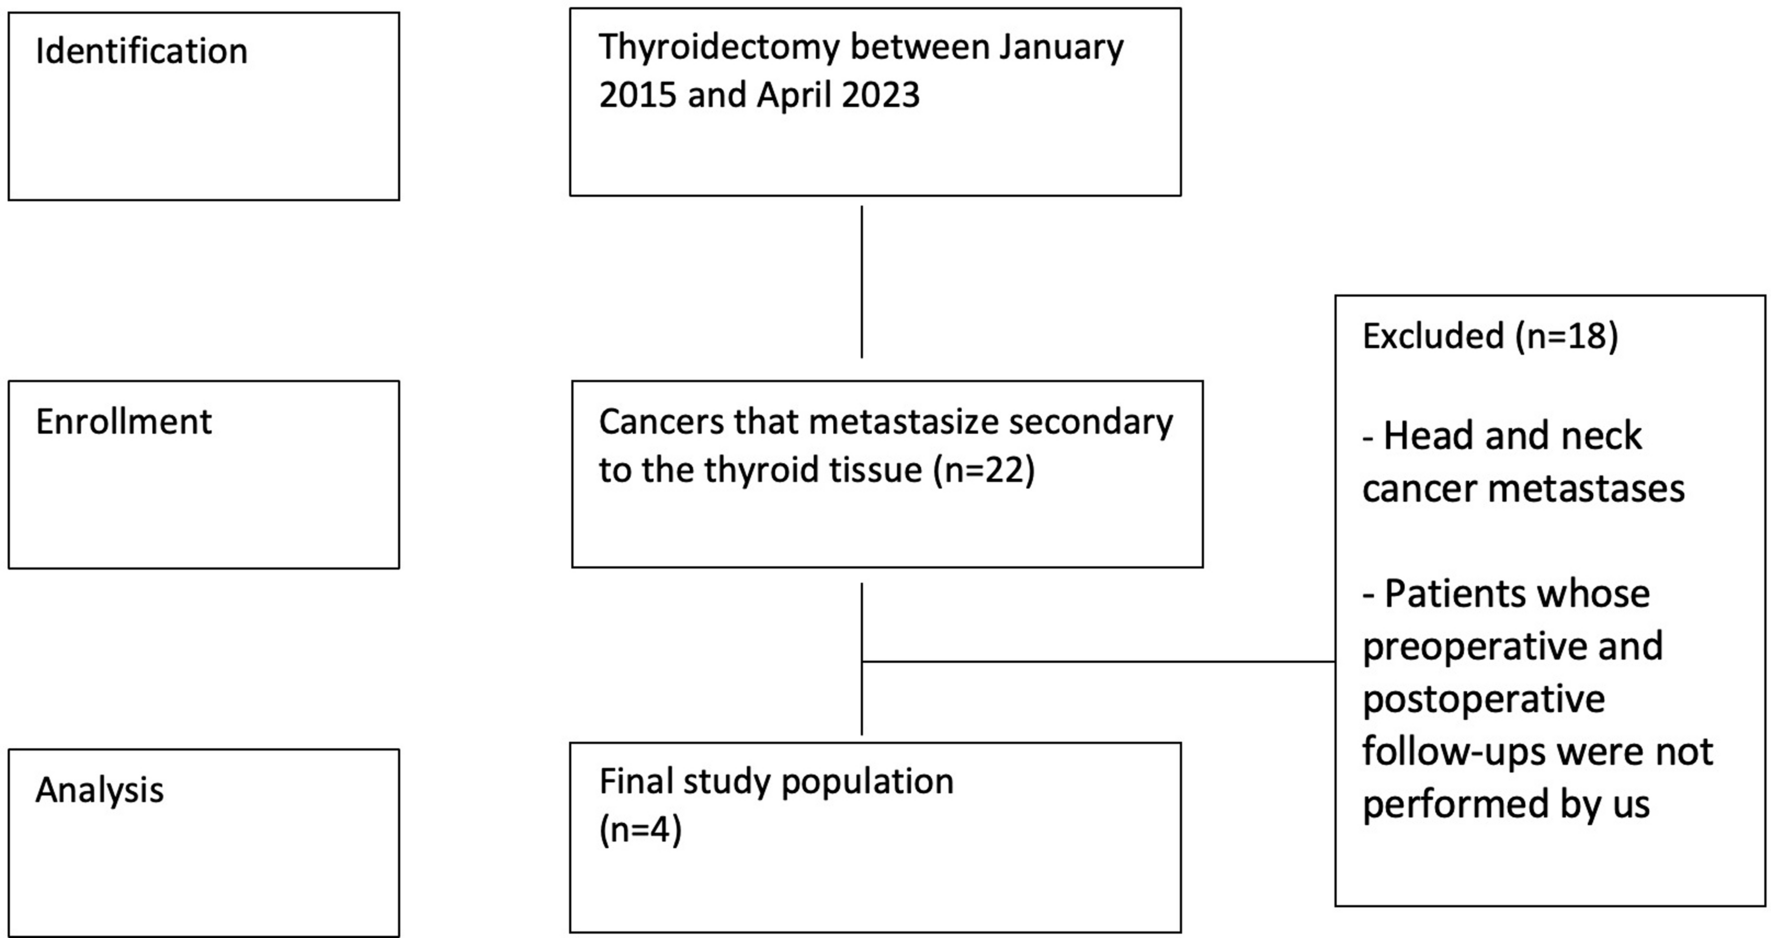
Among the 49 patients who underwent stereotactic radiotherapy and follow-up at XXX between June 1, 2012 and September 1, 2018 (for 80 months), data from 43 who were followed up for more than 2 years were subjected to image analysis. As the tumor control rate of type 2 neurofibromas is low [17, 18], the effects of radiotherapy on this type of tumor are distinct. Hence, two patients with type 2 neurofibromas were excluded from this study. The patient selection process is shown in Fig. 1.
Fig. 1
Study flow chart presenting patient eligibility. Data from 43 patients are analyzed. Two patients with type 2 neurofibroma are excluded. VSs vestibular schwannomas, SRT Stereotactic radiotherapy, SRS stereotactic radiosurgery
2.2 Magnetic resonance imaging equipment and imaging conditionsMagnetic resonance imaging (MRI) was performed using a 1.5-T MRI system (EXCELART VantageAtras, MRT-2003/S3; TOSHIBA,) with a head coil (Atlas SPEEDER MJAH-127A; Canon,). The same system was used for follow-up. Gadbutrol (Gadvist; Bayer) contrast material was injected, and gadolinium-enhanced T1-weighted MRI (Gd-T1WI) was performed 15 min after injecting the contrast medium. The imaging conditions were set as follows:
Gd-T1WI: repetition time (TR), 15–13 ms; time to echo (TE), 5.5 ms; flip angle, 25°; and slice thickness, 1 mm.
Three-dimensional (3D) steady-state free-precession T2-weighted MRI (3D-ssfpT2WI): TR, 12 ms; TE, 6 ms; flip angle, 75°; and slice thickness, 1 mm.
DWI: TR, 5800 ms; TE, 100 ms; flip angle, 90°; and slice thickness, 3 mm.
ADC: TR, 5800 ms; TE, 100 ms; flip angle, 90°; and slice thickness, 3 mm.
2.3 Radiotherapy planningRadiotherapy was performed using a treatment planning system (MultiPlan® version 4.6; Accuray Inc. Sunnyvale, CA, USA). The gross tumor volume was defined as the position and extent of the gross schwannoma; this was identified and contoured on computed tomography images with 1-mm-thick slices, which were fused with Gd-T1WI and 3D-ssfpT2WI images. CyberKnife® model G4, version 9.4 (Accuray, Inc.), was used for radiation. We aimed to ensure that 95% of the planning target volume (PTV) received 80% of the maximum dose (70–90% was acceptable). The PTV margin was set at 0‒1 mm, and we ensured that the minimum dose within the PTV did not fall below 10% of the prescribed dose. The radiological characteristics of the patients are summarized in Table 1.
Table 1 Radiotherapy planning characteristics2.4 Follow-up and local control rateFollow-up was performed 3, 6, 12, 18, and 24 months after the end of the radiotherapy and yearly thereafter. The interval between follow-up observations was one of the most standardized features in this study (Online Resource 1). Before treatment, the tumors were stratified according to the extended Koos classification, and the 5-year local control rate of each group was studied [19]. Given that we considered that the prognosis of tumors displacing the brainstem differed according to whether they are large, the extended Koos classification, in which tumors compressing the brainstem were categorized as grade IV or V based on the volume, was used, with 6 cm3 as the benchmark [19].
2.5 Imaging analysisTwo radiologists performed the imaging analysis. Volume changes were assessed using Gd-T1WI and 3D-T2WI, and the tumor volume was evaluated three-dimensionally by gross tumor delineation with study-planning software (MultiPlan, version 4.6). We defined “increase” and “decrease” as an increase or decrease in the tumor size volume by 13% or more, respectively, compared with the pretreatment values, as an inaccuracy of 13% has been reported during the manual delineation of volumes on high-resolution MR images [20, 21].
Treated tumors were classified into the following groups based on their size change patterns: Type A, increase before decrease; Type B, consistent decrease; Type C, no size change; Type D, consistent increase; Type E, decrease before increase; and Type F, increase after any decrease (recurrence). Transient expansion was defined as a significant decrease in size following a temporal increase in size (Type A). The interobserver agreement was evaluated by comparing the gross target volume delineated by the doctors with the benchmark determined by a trained medical physicist. All the stored MR images of Type A cases, which were taken at the pretreatment, peak of expansion, and last follow-up, were analyzed. To estimate the long-term efficacy of radiation, tumor size ratios (tumor volume 4 or 5 years after radiation/pretreatment) were defined and calculated. The ADC ratio was defined as the ratio of the mean signal in the region of interest to that in the contralateral thalamus. The region of interest was the entire tumor at the maximum cross-sectional level. Patients with any defect in the ADC image data were excluded.
We predicted that the tension of the tumor capsule would decrease around the transient expansion peak, and some imaging signs relevant to this decrease would appear. Therefore, the outlines and appearance of notches were included as evaluation items. For tumors with notch appearance, the time interval between the appearance of notches and significant shrinkage (13% volume decrease from the peak) was evaluated. Central nonenhancement (CNE) was defined as the appearance of low-signal areas in the tumor. For cystic tumors, the disappearance of enhancement at the septum was also regarded as CNE.
2.6 Statistical analysisThe interobserver agreement was assessed using intraclass coefficient dice similarity coefficient (DSC), which is used to quantify the degree of tumor volume overlap. The following scale was set to evaluate the level of volume agreement (DSC ≥ 0.85, high agreement; ≥ 0.70 to < 0.85, moderate agreement; ≥ 0.50 to < 0.70, low agreement; and < 0.50, very low agreement) [22, 23]. The Friedman test and Dunn’s multiple comparisons test were performed to compare ADC ratios among pretreatment, tumor expansion peak during transient growth, and the last follow-up.
The Mann–Whitney test was performed to compare the tumor volume 4 or 5 years after irradiation to that at pretreatment. The log-rank test was performed to compare the differences in progression-free survival between patients with and without notch appearance. Individuals with missing data required for the analysis were excluded. All statistical analyses and graph making were performed using Graph Pad Prism 9, version 9.0.0 t or EZR [24], which is a modified version of R commander with added statistical functions. These are frequently used in biostatistics. For all analyses, the threshold for significance was set at a P-value of < 0.05.
留言 (0)