
記住我


The North Carolina Congenital Heart Defect (NC-CHD) Surveillance Network was established in collaboration with the Centers for Disease Control and Prevention (CDC) in 2015 as part of a nationwide effort to characterize the epidemiology of CHD in the USA. Data were acquired via the NC-CHD Surveillance Network database, which includes data from 5 NC tertiary care hospital systems: University of North Carolina, Wake Forest Baptist Health, Atrium Health, Duke University Medical Center, and East Carolina University, as well as their satellite clinics, from 2008 to 2013. Data from Atrium Health, including demographic data, were excluded from this study due to lack of information on encounter type. Specifically, for this site, we could not distinguish outpatient visits with a cardiologist from other outpatient visits. For all other sites, demographic data were included for patients who had a cardiology encounter with an included diagnosis. Cases were identified using International Classification of Diseases (ICD), Ninth Revisions codes and were classified by hierarchical native anatomic complexity groupings similar to previously published algorithms based on the individuals’ hemodynamic severity and basic anatomy: severe disease, shunt disease, and valve disease [16]. Cases with an isolated code of 745.5 were excluded from this analysis since secundum atrial septal defect, a CHD, cannot be distinguished by ICD codes from patent foramen ovale (PFO), a normal variant and, therefore, inclusion of 745.5 may overestimate cases with CHD. Severe CHD included endocardial cushion defects, interrupted aortic arch, tetralogy of Fallot, total anomalous pulmonary venous return, transposition complexes, truncus arteriosus, and univentricular hearts. This study was approved by the Duke University Health System Internal Review Board and all the participating institutional review boards. All protected health information was maintained in a secure server and was deidentified for analysis. Details on data abstraction and processing are found in the Supplemental Materials. Support for the creation of the NC-CHD Surveillance Network database and statistical analysis was provided by the CDC grant 5 NU50DD004933-03–00.
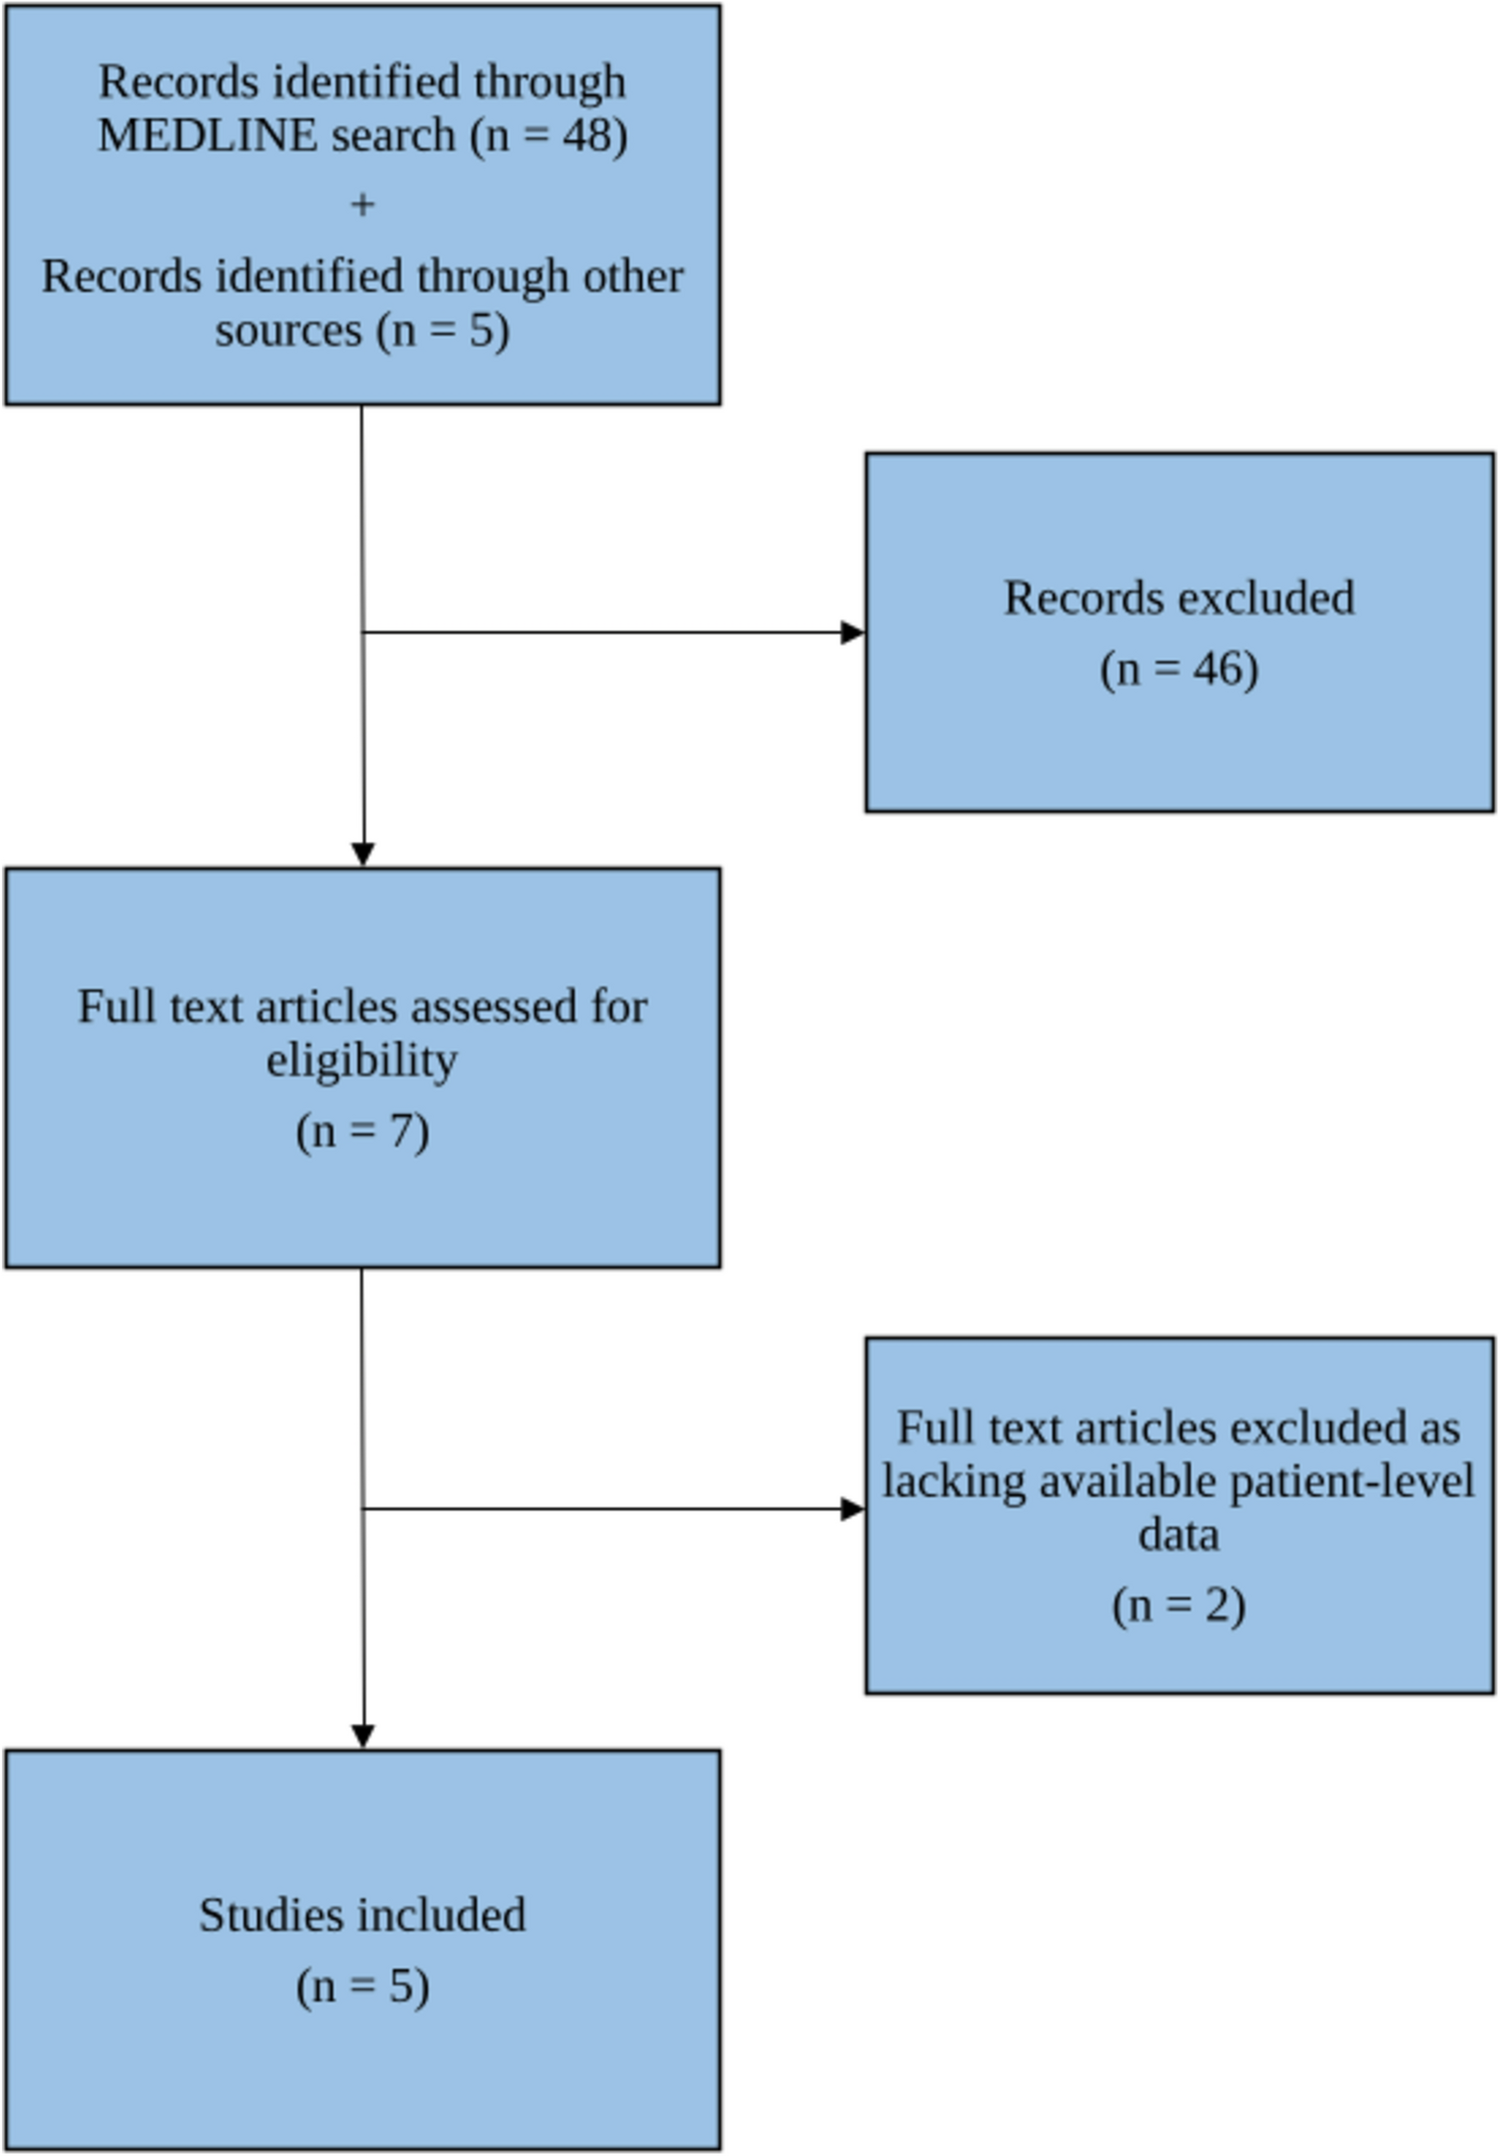
Patient EligibilityPatients in the NC-CHD Surveillance Network database were included in this analysis if they were < 10 years old at the time of initial encounter and had a cardiology encounter with a diagnosis of CHD between January 1, 2008 and June 30, 2012. Similarly, patients who died within 18 months of their initial encounter were excluded due to insufficient time to assess follow up. A detailed description of the study cohort is displayed in Table 1. Additionally, a flow diagram of all excluded cases for each analysis can be found in Supplemental Fig. 1.
Table 1 Demographic cohort characteristics broken down by age range, including individuals < 1 year old and individuals 1- < 10 years oldFig. 1
Kaplan–Meier curves depicting cardiology follow-up in children with CHD over the course of 2 years + 60 days from their index encounter overall in this cohort (A), by initial age at index encounter (B), and by category of CHD lesion (C). In panel B, age group refers to the age at the index encounter
OutcomesBased on ACC and AHA recommendations for cardiology follow-up in adults with CHD, a patient in our cohort was considered to have a gap in care if they did not have a second cardiology encounter, either inpatient or outpatient, within 2 years + 60 days of their initial encounter. We collected health care utilization encounters including the number of ED, inpatient, and outpatient visits and invasive and non-invasive procedures. Detailed information on categorization of invasive and non-invasive procedures can be found in the Supplemental Materials
Statistical AnalysisDescriptive statistics on the cohort were calculated overall and by age category (< 1 year and 1–9 years). Continuous variables are presented as median (25th, 75th percentile) and categorical variables are count (percentage). Although the outcome of interest was cardiology follow-up within 2 years (+ 60 days) of index encounter, statistical analyses were conducted using time-to-event methods, to account for early censoring in patients without a full 2 years of data collection. Kaplan–Meier estimates for the percentage of patients who followed by within 2 years was calculated overall and by subgroups. Additionally, the cumulative percentage of patients with cardiology follow-up over time was visualized using Kaplan–Meier curves, and the log-rank test used to make comparisons between subgroups.
Analysis of Risk Factors for Gap in Follow-upMeasured covariates included age at index encounter, sex, and race/ethnicity as reported in the electronic medical record, EI, NDI, drive time to the nearest cardiology clinic, and CHD severity (non-severe (valve, shunt) or severe). NDI is a composite index that combines multiple socioeconomic variables, including occupation, education, and income [17]. EI quantitatively provides a measure of the ratio between non-college-educated individuals and college-educated individuals in a given residential area [18]. For each index, a higher number corresponds to worse deprivation or isolation. For example, a higher number in the NDI would indicate an area with a lower median income, a higher unemployment rate, fewer residents that are high school educated, and fewer households that are owner occupied [17]. Specific categorizations of CHD, by ICD code, can be found in the Supplemental Materials. Insurance status could not be included due to a high proportion of missing values (40%). Racial Isolation index (RI) (measuring the extent to which minority individuals can interact with majority individuals in a given residential area) was not included due to high collinearity with race/ethnicity. Certain variables, including EI, RI, and NDI are based on census tract. Address data were sourced from electronic medical records. The influence of all covariates on time to follow-up was analyzed using a multivariable, Cox proportional hazards model for time from index cardiology encounter to first subsequent cardiology encounter. Continuous variables were assessed for linearity using natural cubic splines and when found to be non-linearly related to follow-up, linear piece-wise splines were used in the model. The proportional hazards assumption was checked using weighted Schoenfeld residuals.
Analysis of Health Outcomes from Gap in Follow-upA landmark analysis was used to evaluate differences in subsequent healthcare utilization between those who did and did not have a gap in cardiology follow-up during the first 2 years of follow-up. Patients were included in the utilization analysis if their follow-up extended at least 880-day post-index encounter. This period is longer than inclusion criteria for the other analyses to allow for ascertainment of cardiology follow-up status and additional time during which patients could have been seen in the health system. Counts of healthcare encounters for each patient began after the initial 2-year (+ 60 day) follow-up period. Utilization was evaluated using a negative binomial model with adjustment for age, sex, race/ethnicity, total drive time to nearest clinic, NDI, EI and CHD category, and log of post-landmark follow-up time as an offset.
Additionally, the incidence of death, severe cardiac dysfunction necessitating placement of a left ventricular assist device (LVAD), and cardiac transplantation occurrence during the post-landmark period were described, overall and by follow-up status. Patients were included in this descriptive analysis if they were alive and in the study at the 2-year (+ 60 day) mark.
Analysis code and selected deidentified datasets are available upon request. All analyses were performed by the Duke Clinical Research Institute (Durham, NC) using SAS version 9.4 (SAS Institute, Inc. Cary, NC).
留言 (0)