
記住我

Sixty-nine acute stroke patients were recruited from the Royal Brisbane and Women’s Hospital and the Princess Alexandra Hospital (Brisbane, Australia). Patients were considered for inclusion in this investigation if they (1) were diagnosed with a first-time stroke as confirmed by routine clinical imaging (CT or MR) and (2) were within six weeks of hospital admission due to a stroke event. Patients were excluded from all conducted analyses if they exhibited evidence of previous strokes, were diagnosed with a Transient Ischaemic Attack, were > 90 years of age, were not fluent in English, and/or were affected by other psychiatric or neurological diagnoses (e.g., schizophrenia, substance use disorder, dementia). Participants were excluded from neuroimaging analyses (but included in behavioural analyses) if they lacked available neuroimaging data of suitable quality for the lesion analyses (e.g., poor quality scans). All participants provided informed written consent (in line with the Declaration of Helsinki) and approval for the study was provided by the Metro South and Metro North Health Human Research Ethics Committees and the University of Queensland (UQ) Human Research Ethics Committee.
Three patients were excluded from behavioural analyses due to having English as a second language (n = 2) or severe fatigue that precluded completion of most tasks (n = 1), whilst 12 participants were excluded from lesion-mapping analyses. Participant demographics and stroke descriptive statistics are reported in Table 1. Overall, 66 patients (mean age = 61.6 (SD = 13.9, range = 23–86), 33.3% female) were included in behavioural analyses and a subset of 54 (mean age = 60.5 (SD = 12.4, range = 23–84), 32.1% female) of these participants were included in lesion analyses. There was no significant differences in age (t(97.5) = 0.86, p = 0.39), gender (X2(1) = 0.06, p = 0.81), time between stroke and assessment (t(101.9) = 0.82, p = 0.41) or lateralisation of stroke (X2(3) = 0.20, p = 0.91) across these participant groups.
Table 1 Demographics for each of the patients included in this studyBehavioural data from 70 healthy ageing control subjects (mean age = 64.5 (SD = 10.3, range = 41–88), 42.8% Female, 5.7% left-handed) were also collected. These controls were recruited through the University of Queensland (UQ) networks under the above UQ Human Research Ethics. Controls were excluded if they reported a history of major neurological of psychiatric disorder. Control participants did not significantly differ from the included stroke participants in terms of age (t(123.6) = − 1.42, p = 0.159, 95% CI = − 6.90 to 1.41), sex (X2(2) = 0.958, p = 0.328 (Yates corrected)), or handedness (X2(2) = 1.054, p = 0.305 (Yates corrected)).
Behavioural assessmentEach participant completed a series of standardised neuropsychological assessments aiming to determine pre-morbid cognitive abilities and to quantify executive function abilities. Specifically, each participant completed the National Adult Reading Test (NART) which, in line with standard protocols (Bright et al. 2002, 2018), was used to estimate pre-morbid optimal levels of functioning (Nelson and Willison 1991). In this task, participants are instructed to read a series of 50 increasingly difficult, irregularly spelled words aloud whilst a trained administrator scores each response for accuracy. This task is commonly employed in clinical environments to estimate pre-morbid intelligence (Nelson and Willison 1991).
Next, the Stroop Test (Victoria Version) was used to provide a standard measure of executive function abilities (Strauss et al. 2006). In this task, participants are first presented with 24 coloured dots arranged in a grid and are asked to name the colours of the dots as quickly as possible. Next, participants are presented with a grid of 24 non-colour words (e.g., FISH) printed in colour ink and are asked to name the ink colour of these stimuli as quickly as possible. Finally, participants are then presented with 24 colour words printed in an incongruent colour and are asked to name the ink colours as quickly as possible. According to standard guidelines, participants are scored according to the time required to complete each task, accuracy, and the interference time (time on the word condition divided by time on the colour dot condition) (Strauss et al. 2006).
Finally, each participant completed the Hayling Sentence Completion Test which was administered and scored in line with the published, standard guidelines (Burgess and Shallice 1997). Specifically, each participant was presented with 30 sentence frames which were missing the final word. In the first condition (Initiation) each sentence was read aloud and the participant was instructed to provide a word which completed each sentence frame in a logical and sensible manor (e.g., prompt = He posted a letter without a …, response = stamp). In the second condition (Suppression), this procedure was repeated but participants were instructed to complete each sentence with an unconnected response (e.g., prompt = He posted a letter without a…, response = banana). For each sentence, response time and response accuracy were recorded. These data were used to calculate average response time differences between Initiation and Suppression condition responses and to convert response time and accuracy scores into scaled scores (in line with standard scoring guidelines). Each scaled score ranged between 1 and 10, corresponding to the following normative data percentiles: 1 = out of normal range or < 1st percentile, 2 = 1st percentile, 3 = 5th percentile, 4 = 10th percentile, 5 = 25th percentile, 6 = 50th percentile, 7 = 75th percentile, 8 = 90th percentile, 9 = 95th percentile, 10 = 99th percentile (Burgess and Shallice 1997). All Suppression condition responses were categorised into eight possible response types (Robinson et al. 2015) (Table 2) to facilitate the analysis of strategy use. The frequency of each response category was recorded for each participant. The order of cognitive tests was counterbalanced to prevent systematic variance due to testing order.
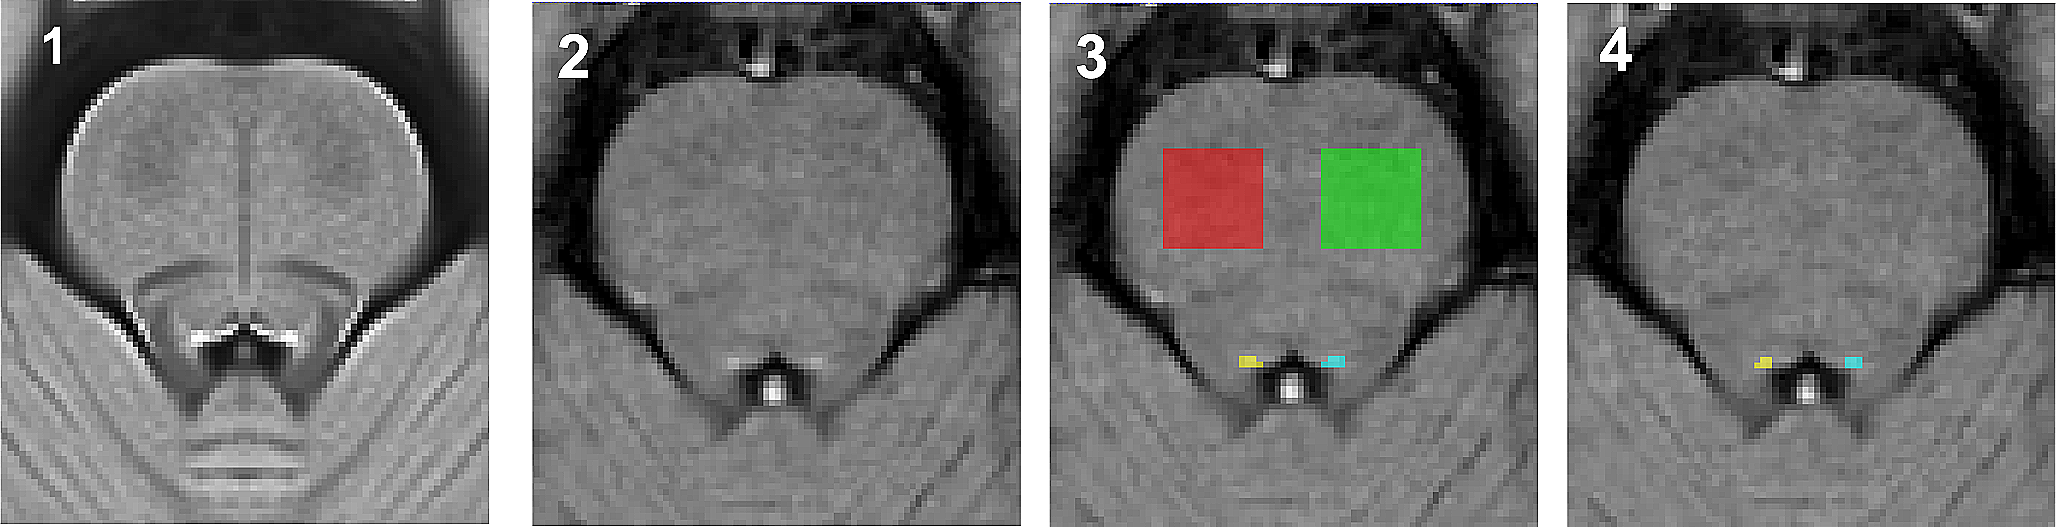
Table 2 Categories used to categorise responses from the Hayling Test Suppression condition. These categories were defined by Robinson et al. (Robinson et al. 2015) based on the data reported by Burgess and Shallice (Burgess and Shallice 1996)Neuroimaging dataRoutinely collected clinical neuroimaging data (10 CT, 1 T1 MR, 43 FLAIR) was employed to create binarized lesion masks for each included patient (Fig. 1). Previous research has demonstrated that similar routinely collected neuroimaging data are of sufficient quality to reliably create lesion masks which are able to accurately identify the correlates of a wide range of cognitive impairments in acute stroke populations (Moore et al. 2023a, b, c; Moore and Demeyere 2022). Further, Moore et al. (2023a, b, c) have demonstrated that lesion mapping results yielded from CT-based analyses agree well with those produced using MR modalities. Within this study, all lesion masks were processed using the standard processing protocol reported by Moore (2022). Specifically, all lesions were manually delineated on native space scans by trained experts and smoothed at 5 mm full width at half maximum in the z-direction using MRIcron (Rorden 2007). These native-space masks and scans were then reoriented to the anterior commissure and warped into 1 × 1x1 MNI space using Statistical Parametric Mapping (Ashburner et al. 2016) and age-matched templates from Clinical Toolbox (Rorden et al. 2012). All normalised scans were visually inspected for quality prior to inclusion in lesion mapping analyses.
Fig. 1
Lesion overlay for the 54 patients included in this study’s lesion analyses. Colour represents the number of lesions overlapping at each location. MNI z-coordinates -22–41 are visualised
Lesion mapping analysesAs previous research has strongly suggested that initiation and inhibition require collaboration between a distributed network of neural correlates, network-level lesion mapping analyses were employed in this study. This technique is commonly employed and offers key insight into how disruptions in brain networks are associated with cognitive impairments (Cohen et al. 2021; Moore et al. 2023a, b, c; Saxena et al. 2022).
First, lesion quantification toolkit (Griffis et al. 2021) was used to generate disconnection statistics by overlaying each binarised lesion masks onto the Schaefer-Yeo Atlas Parcellation (100 parcels, 7 Networks) (Schaefer et al. 2018). An additional 35 subcortical ROIs derived from the Harvard–Oxford Subcortical Atlas and the Automated Anatomical Labelling Atlas (version 3). These atlases were employed as, together, they offer an optimal balance between complexity and interpretability. Lesion quantification toolkit (Griffis et al. 2021) estimates parcel-wise disconnection severities by calculating the number of normative HCP-842 streamlines which bilaterally terminate within each pair of atlas-defined grey matter parcels. This process yields disconnection matrices in which the value in each cell represents the percentage of disconnected streamlines (edges) connecting each of the defined grey matter parcels (nodes) per patient (135 nodes, 18,225 edges) (Griffis et al. 2021). For each network edge a regression was conducted to compare percent disconnection to behavioural scores. Each regression controlled for lesion volume, and only edges damaged in > 10% of included patients were analysed (1766 edges included). All conducted comparisons employ 5% false discovery rate to correct for inflated false positive rates due to multiple comparisons. This approach is similar to network-level lesion-mapping methodologies employed in previous studies (Gleichgerrcht et al. 2017; Saxena et al. 2022).
In total, 21 network-level lesion mapping analyses were conducted using the following outcome variables: Stroop Dot test (mean RT), Stroop colour-word test (mean RT, interference score), Hayling Initiation (mean RT, total Correct), Hayling Inhibition (mean RT, total correct), Hayling Strategy use (A1-C8, no obvious strategy count, proportion of responses using strategies), Hayling Scaled Score (calculated in line with standard scoring procedures), Hayling difference between Initiation/Suppression response times, and Hayling Global Error Score (total number of errors).
In addition to this, network-level overlap comparisons were conducted to evaluate the degree of similarity between the correlates associated with Stroop and Hayling Test scores aiming to assess analogous functions. Specifically, three overlap comparisons were conducted to compare Stroop Dot Time score versus Hayling Initiation time, and Stroop Colour-Word Time versus Hayling Inhibition time, Stroop Interference Score versus Hayling Inhibition versus Initiation time difference. In each case, the number and identity of any network edges impacted in both compared tests are reported.
Statistical analysesFirst, included behavioural data were inspected for statistical outliers which deviated from score means by > 3.5 standard deviations. This more liberal inclusion threshold was adopted to account for the large amount of behavioural variance expected within the acute stroke population (Demeyere et al. 2015). As the majority of considered behavioural variables were not normally distributed (p < 0.05), non-parametric tests were used (i.e., Spearman’s correlations and Mann–Whitney U tests for between-group comparisons). All reported confidence intervals (CI) refer to 95% confidence intervals.
Next, differences in demographic and clinical characteristics were examined between the acute stroke and healthy control groups. Specifically, Mann–Whitney U tests were used for continuous variables (i.e., age, years of education, estimated premorbid intelligence) and Chi-square tests for independence (with Yates continuity correction) were used for categorical variables (i.e., biological sex and handedness).
To identify significant Stroop and Hayling test performance differences between control and stroke patients, Mann–Whitney U tests were conducted on each of the 21 outcome variables of interest (Stroop Dot test (mean RT), Stroop colour-word test (mean RT, interference score), Hayling Initiation (mean RT, total Correct), Hayling Inhibition (mean RT, total correct), Hayling Strategy use (A1-C8, no obvious strategy count, agrammatical correct responses count, proportion of responses using strategies), Hayling Scaled Score (calculated in line with standard scoring procedures), Hayling difference between Initiation/Suppression response times), and Hayling Global Error Score (total number of errors).
Within strategy use variables, prevalence of each response type was calculated as a proportion of either correct or incorrect responses. For example, incorrect answers (categories A and B) were calculated by dividing the subcategory raw score by the total number of errors. Conversely, prevalence of correct answer types (Category C) was calculated by dividing the subcategory raw score by the total number correct. This strategy was adopted to ensure these analyses were investigating proportion of reliance on each strategy/error type independent of overall accuracy. Where appropriate, Bonferroni corrections for multiple comparisons are employed. Each applied alpha threshold is reported and justified prior to reporting results of each conducted comparison.
Performance on analogous Stroop and Hayling Test variables was compared both in terms of score correlations (non-parametric Spearman rank correlations) and in terms of sensitivity/specificity. These sensitivity/specificity calculations are not meant to be interpreted in terms of diagnostic accuracy but are instead reported to comprehensively summarise the degree of agreement between normal/abnormal performance categorisations reported by each of these tasks. These comparisons report the sensitivity/specificity of Stroop Test metrics relative to the “standard” of Hayling test metrics.
As past literature has suggested that Category B Hayling errors are subtle semantically related responses rather than blatant inhibition failures, the underlying cognitive process may differ from inhibition per se. In focal frontal lesion patients, all frontal patients make a high number of Category A Hayling errors (i.e., blatant inhibitory failures) but only the right lateral frontal patients make a high number of Category B Hayling errors, which are subtle and likely implicate a failure of other processes such as monitoring (Robinson et al. 2015, 2016). Further, healthy older adults increasingly produce category B but not A errors (Gibson et al. 2018). Taken together, these findings suggest differing cognitive and neural underpinnings. A series of secondary, exploratory analyses were, therefore, conducted to identify patterns of disconnection associated with these errors in more detail. First, linear regression and ANOVA analyses were conducted to identify stroke-related and clinical factors associate with the occurrence of Category B Hayling errors. These analyses included age, stroke side, stroke territory, and lesion volume as predictors. Next, lesion overlap images were created to visualise qualitative difference between patients in the top and bottom quantiles of Hayling Category B error commission. A similar analysis was repeated within the network-level data to identify connections that, when disrupted, resulted in high versus low occurrence of Category B errors. Specifically, the value of each considered edge was determined by calculating the number of Category B errors which occurred in patients with damage to the edge and dividing this by the number of patients with damage to this edge. This score summarizes the prevalence of Category B errors at each edge whilst accounting that some edges were damaged more frequently in the sample than others. Importantly, these visualisations are not meant to identify statistically significant correlates, but instead aim to identify potential trends which can then be further investigated in larger samples.
留言 (0)