
記住我


The National Health and Nutrition Examination Survey (NHANES), a study conducted by the Centers for Disease Control and Prevention (CDC) to evaluate the nutritional status of the U.S. population for preventive measures, encompasses data on population diet, health interviews, physical examinations and laboratory analyses. The NHANES protocol received approval from the Institutional Review Board of the National Center for Health Statistics, and all participants provided informed consent.
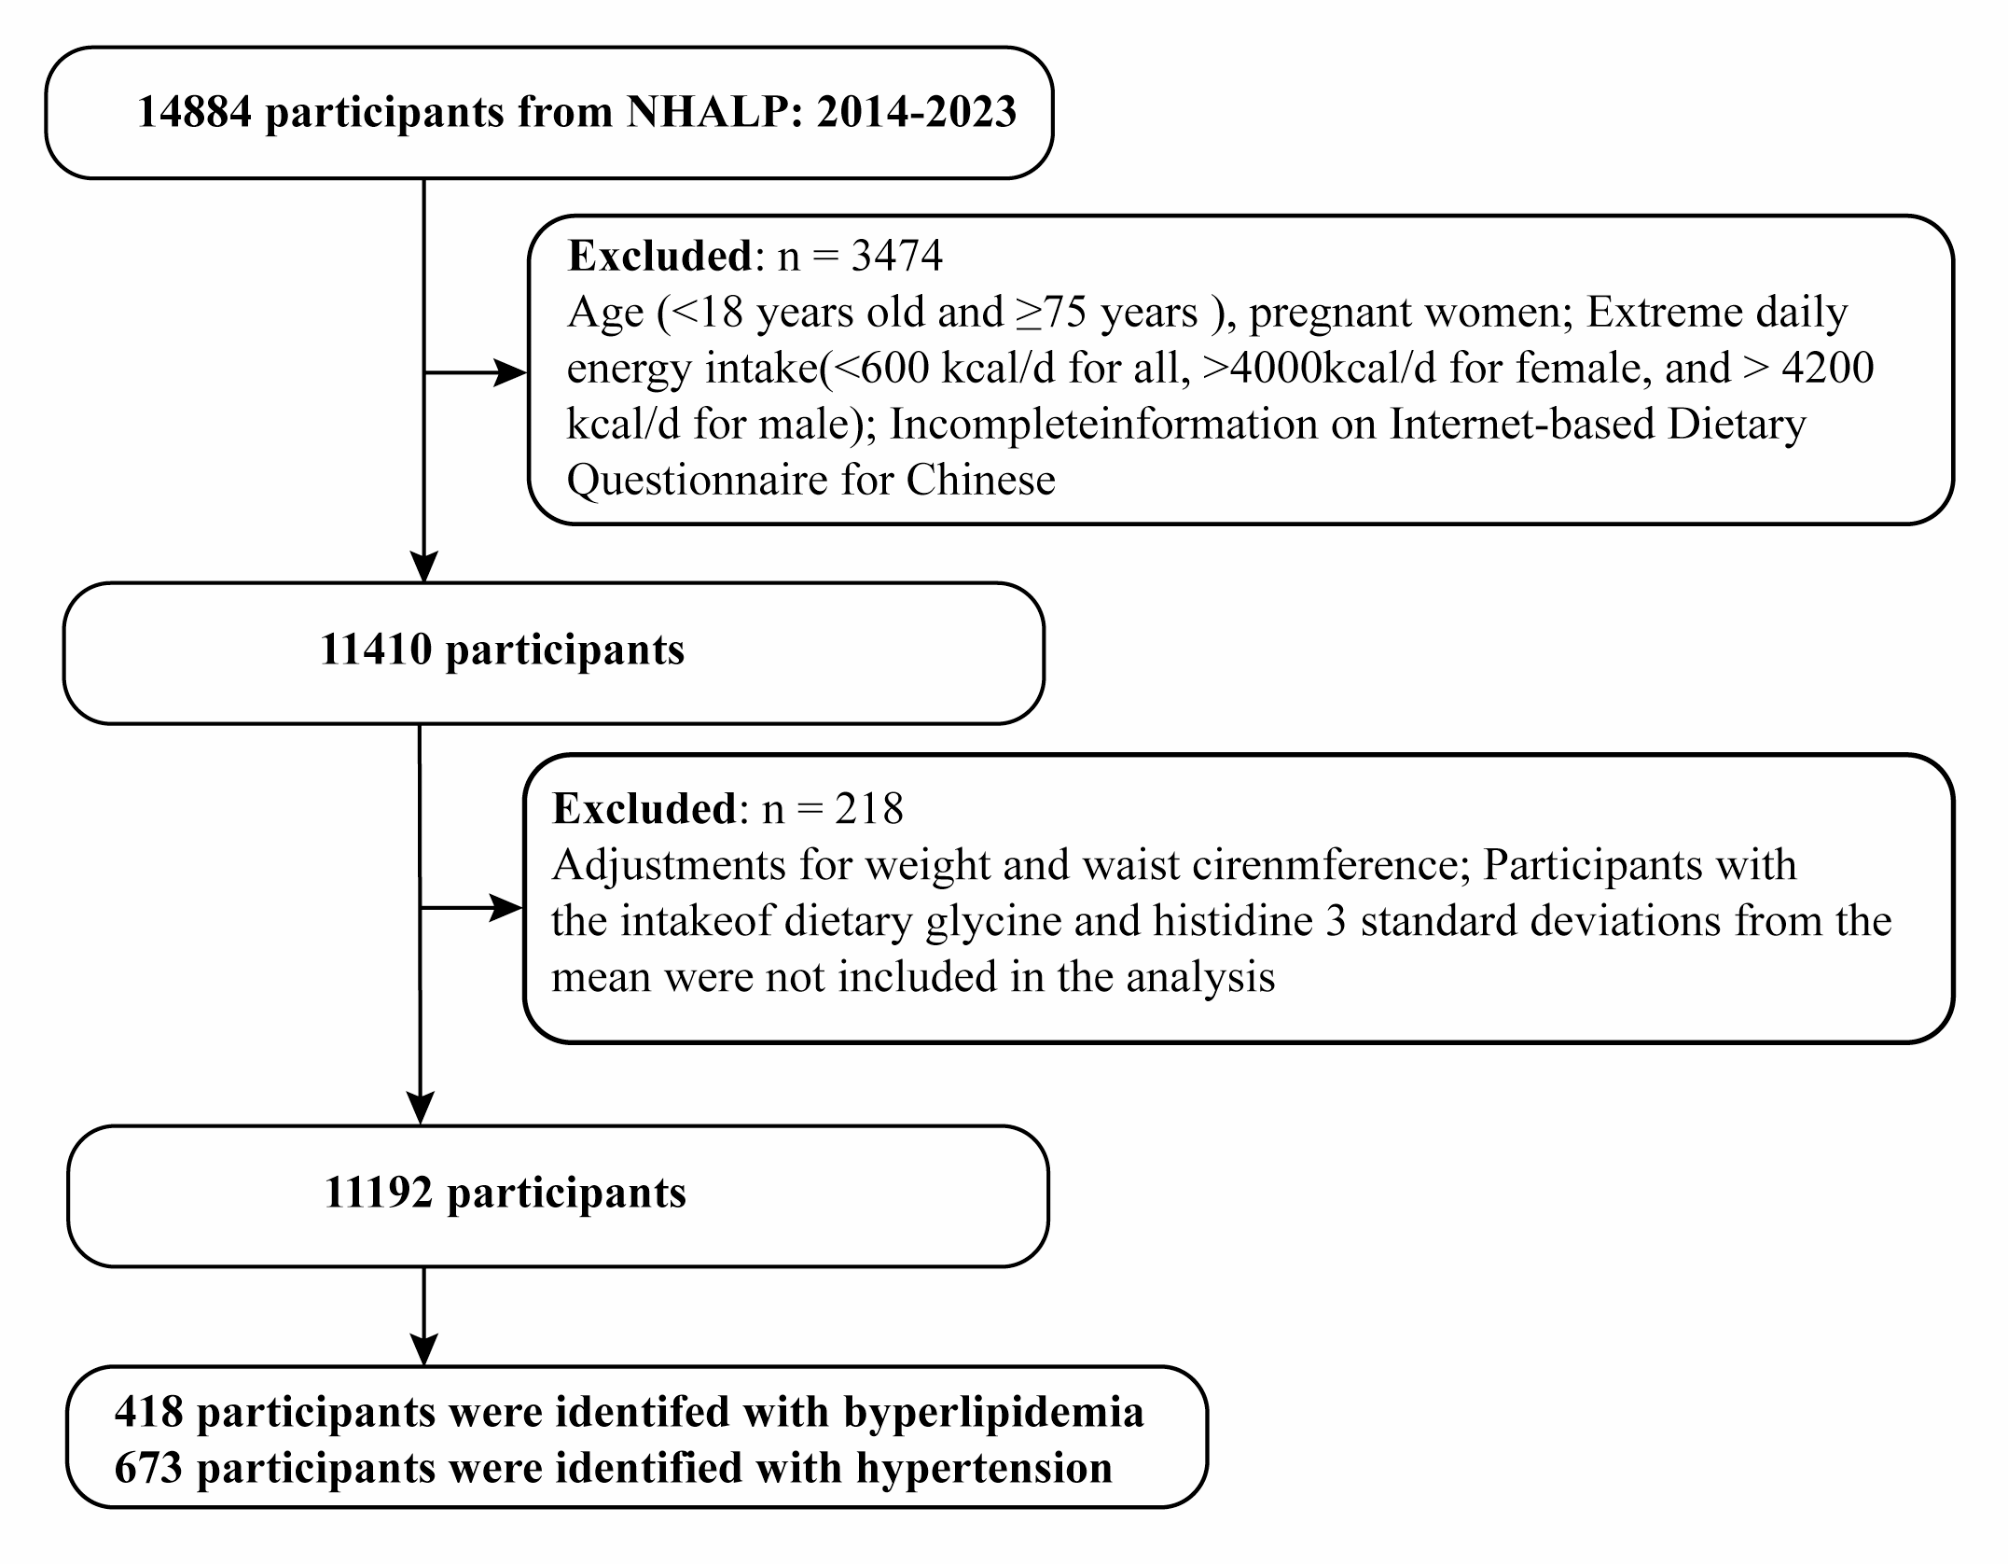
In the study, we acquired data from nine NHANES cycles spanning 2001 to 2018. Hypertension was defined as a self-reported physician diagnosis of hypertension, an average of three systolic blood pressure (SBP) ≥ 140 mmHg or an average of three diastolic blood pressure (DBP) ≥ 90 mmHg, and the use of antihypertensive drugs for primary hypertension. For a clinical point of view, considering the wide range of antihypertensive drugs used, such as beta blockers can be used for arrhythmia or heart failure, calcium channel blockers can be used for myocardial infarction or arrhythmia, we only used the prescription drug information from 2013 to 2018 because the prescription drug questionnaire before 2013 did not record the reason for medication use. A total of 26,613 participants with hypertension underwent screening. After excluding pregnant women, individuals under 20 years old, those with missing serum 25 (OH)D records, and incomplete death data, a total of 19,500 people were included in the study. The experimental design flow chart of this study is shown in Fig. 1.
Fig. 1
Flowchart of the study population
Measurement of serum 25 (OH)D concentrationsBlood samples were obtained from participants through venipuncture, and serum specimens were processed, stored, and shipped to the National Center for Environmental Health. Serum 25 (OH)D concentrations were measured using DiaSorin RIA kit (Stillwater MN) from 2001 to 2006 and a standardized liquid chromatography-tandem mass spectrometry (LC-MS/MS) method from 2007 to 2018. According to the suggestion of CDC in NHANES website, we employed a homologous regression equation to convert serum 25 (OH)D concentrations from 2001 to 2006 to facilitate subsequent analysis. The conversion formula of serum vitamin D concentration in NHANES 2001–2006 is as follows:
2001–2002: LC-MS/MS equivalent = 6.43435 + 0.95212*RIA original.
2003–2004: LC-MS/MS equivalent = 1.72786 + 0.98284*RIA original.
2005–2006: LC-MS/MS equivalent = 8.36753 + 0.97012*RIA original.
Total 25(OH)D, 25(OH)D3 and C3 epimer: 1 nmol/L = 0.40066 ng/mL (1 ng/mL = 2.4959 nmol/L).
Vitamin D supplement useParticipants who reported no use of dietary supplements in the past 30 days were categorized as non-vitamin D supplement users, while those with total vitamin D supplement intake greater than 0 were considered vitamin D supplement users. or the period 2001–2006, total vitamin D supplementation in the past 30 days was calculated based on frequency, duration, and serving form, using the formula:
2001–2006: average daily supplement= (daily dosage* corresponding dosage form* days of use) /30.
Mortality outcomes ascertainmentMortality data was obtained from NHANES-linked National Death Index public access files through December 31, 2019. We used the International Statistical Classification of Disease, 10th Revision (ICD-10) codes to define the CVD deaths (I00-I09, I11, I13 and I20-I51). The participants’ death was considered as the endpoint for follow-up. Primary outcomes included all-cause mortality and CVD mortality, with specific attention to diseases of the heart, cerebrovascular disease, and hypertension flag, collectively considered as CVD death.
CovariatesDemographic and lifestyle factors, including age, gender, race, education, ratio of family income to poverty (PIR), examination month, smoking status, alcohol consumption, duration of hypertension, antihypertensive therapy, physical activity, diet quality, calcium supplements, and comorbidities, were collected through detailed questionnaires during home interviews. Additionally, body mass index (BMI) data were obtained from physical examinations conducted at a mobile examination center. Considering the influence of light exposure on serum 25(OH)D concentration, we categorized it based on examination months: November 1 through April 30 and May 1 through October 31.
The Global Physical Activity Questionnaire, encompassing leisure, occupational, and travel activities, was utilized to gauge an individual’s physical activity. The Metabolic Equivalent (MET) value was calculated using the formula: MET (min/wk) = WET × weekly frequency × duration of each physical activity. Inactivity was defined as a MET value of less than 600 min/wk [18].
Diet quality was assessed using the 2015 Healthy Eating Index (HEI-2015), a tool that evaluates adherence to dietary guidelines, providing a comprehensive overview of dietary patterns and intake [19]. HEI-2015 scores below 50 and above 50 were categorized as inadequate and adequate, respectively [20].
Smoking status was classified as never smoker, ever smoker and current smoker according to whether they had smoked at least 100 cigarettes in life and whether they smoked cigarettes now. Those who had at least 12 alcohol drinks a year were considered as drinker. Low-to-moderate drinker was defined as alcohol drinks ≤ 2 drinks/day in men or ≤ 1 drinks/day in women. Heavy drinker was defined as alcohol drinks > 2 drinks/day in men or > 1 drinks/day in women. Cardiovascular disease (CVD) included congestive heart failure, coronary heart disease, angina, heart attack and stroke. Co-morbidities included diabetes, hypercholesterolemia, CVD, renal failure and cancer.
Statistical analysisGiven the complex sampling design of NHANES, a meticulous approach to weighting the data was employed, following NHANES analysis guidelines. Sample weights, strata, and primary sampling units were utilized to account for the complex survey design. The data were combined and weighted using the wtmec2 year under the NHANES protocol.
According to the Endocrine Society Clinical Practice Guidelines, we divided serum 25 (OH)D concentrations into four groups: sufficient group (≥ 75.0 nmol/L), insufficient group (50.0-74.9 nmol/L), moderate deficiency group (25.0-49.9 nmol/L) and severe deficiency group (< 25.0 nmol/L) [21]. Considering several groups of vitamin D deficiency as adverse status, we used the sufficient group as the control group. COX proportional hazard method was employed to analyze the hazard ratio (HR) and 95% confidence intervals (95% CI) of all-cause mortality and CVD mortality in hypertension associated with serum 25 (OH)D concentration and vitamin D dietary supplementation.
Two multivariate model analyses were conducted: model 2 adjusted for age, gender, race, and survey period, while model 3 adjusted for all covariates. Additionally, a restricted cubic spline (RCS) model was employed to assess the nonlinear relationship between serum 25(OH)D concentration, vitamin D supplementation, and mortality. Univariate and multivariate weighted linear regression analyses were performed to investigate the impact of vitamin D supplementation on serum 25(OH)D levels.
Subgroup analysis was conducted according to gender (male and female), age (< 65 years and ≥ 65 years), BMI (< 25.0, 25.0-29.9 and ≥ 30.0), PIR (< 1.30, 1.30–3.49 and ≥ 3.50), duration of hypertension (≤ 10 years and > 10 years), diabetes (no and yes), hypercholesterolemia (no and yes), renal failure (no and yes), CVD (no and yes) and osteoporosis (no and yes). In addition, we also did sensitivity analyses. (1) Considering that mortality was related to physical activity and calcium supplements, we further adjusted them. (2) Participants who died within 1 year of follow-up was excluded. (3) Participants with a history of CVD was excluded. (4) Adults with osteoporosis were more likely to use vitamin D supplements, so we adjusted this variable further in the analysis of vitamin D supplementation and mortality. (5) Diet quality was adjusted.
Finally, we classified vitamin D supplementation by dose and calcium to further clarify the association between supplementation and mortality in hypertension. The doses were classified as 2000 IU/day (50 µg/day) and 4000 IU/day (100 µg/day) respectively. Based on supplement recommendations from most studies, we considered vitamin D < 400 IU/day (10 µg/day) and calcium < 600 mg/day to be low doses, and vitamin D ≥ 400 IU/day (10 µg/day) and calcium ≥ 600 mg/day to be normal doses [22].
All statistical analyses were conducted using R 4.2.2, and p-values < 0.05 were considered statistically significant.
留言 (0)