
記住我


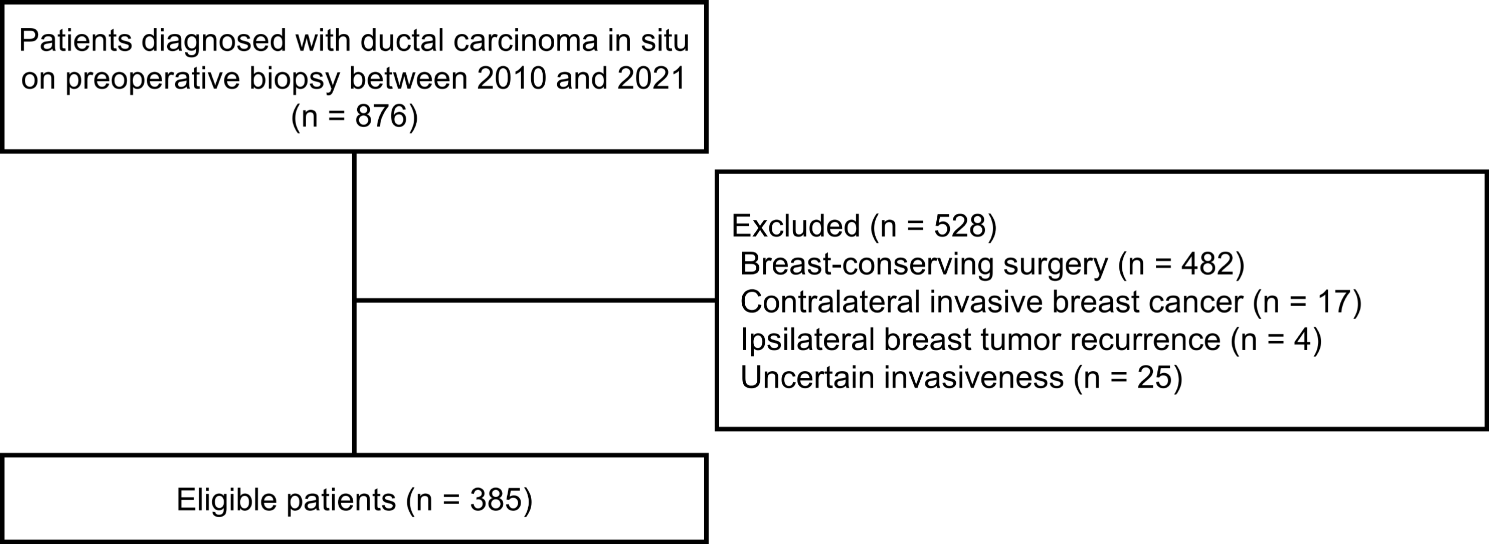
We present the PRISMA flow diagram of our systematic literature review in Fig. 1 [13]. Our initial search in February 2021 yielded 7,653 articles. After removing duplicates, we were left with 4,368 records. We performed two additional updates to the search, adding 292 unique citations in March 2022 and 65 unique citations in June 2022. In total, we screened 4,725 unique articles. After reviewing the titles and abstracts, we excluded 4,521 articles that did not meet the evaluation criteria for the relationship between weight change and breast cancer risk. We then carefully reviewed the full text of the remaining 204 articles and assessed their reference lists for relevant publications, but we did not retrieve any additional studies that met our inclusion criteria. After a thorough review, we excluded 187 publications for not adhering to our inclusion criteria, resulting in a final selection of 17 studies that met our inclusion criteria [6,7,8,9, 21,22,23,24,25,26,27,28,29,30,31,32].
Fig. 1
PRISMA flow diagram of systematic literature search
Study characteristicsWe summarized the characteristics of the 17 studies (11 case-control studies and 6 cohort studies) in Table 1. The studies were published between 1990 and 2019. Thirteen studies were conducted in the United States, while the remaining 4 studies were carried out in Bangladesh, China, Norway, and Sweden. All studies reported menopausal status and the number of participants. Six studies stratified their results by breast tumor receptor subtypes, and only three studies provided information on the race/ethnicity of participants. Weight/BMI change was categorized in all studies (14 studies measured in weight, and 3 studies measured in BMI). Additionally, three studies also reported results using continuous weight change (per 5 kg weight). All studies adjusted for age. All 11 case-control studies reported ORs, 5 out of 6 cohort studies reported RRs, and Dr. Rosner’s cohort used HRs as the effect size measure [22].
Study qualityQuality assessment was performed using a 3-category scoring system and the NOS scores. Based on the 3-category scoring system, seven studies are of high quality (score 3 out of 3), nine studies were of medium quality (score 2 out of 3), and one study was of low quality (score 1 out of 3) (Table 1). All 17 studies reported the participants’ enrollment dates, 16 studies reported the funding sources, and 7 studies declared no conflicts of interest (Table 1). NOS is specifically used for nonrandomized studies and has been endorsed by the Cochrane collaboration. We used the version for case-control studies or cohort studies as applicable, addressing subject selection, study comparability, and the assessment of outcome or exposure. NOS scores ranged from 5 to 8 (9 being the highest possible score), with a mean of 6.3, a median of 6, and a mode of 6 (Table 1). Further details of the NOS scores are shown in Supplementary Tables 1 and 2. All studies received a star for comparability with respect to age adjustment. Except for one study, all studies received an additional star for comparability as they also adjusted for at least one additional risk factor for breast cancer, such as age at menarche, age at first birth, family history of breast cancer, use of hormone replacement therapy, alcohol consumption, or weight at age 18.
Small-study effects and publication biasWe assessed publication bias and small-study effects using standard funnel plot and Egger regression-based statistical tests. The funnel plots for both case-control and cohort studies were symmetric, indicating the absence of publication bias (Supplementary Figs. 1 and 2). The Egger regression-based statistical tests (all P-values > 0.05) also showed no significant evidence of asymmetry in the funnel plots. Moreover, sensitivity analyses demonstrated that any potential publication bias had minimal impact on the overall results.
Meta-analysisCase-control studiesWe included 11 case-control studies with 21 separate ORs in the meta-analysis (Supplementary Fig. 3). When comparing the highest versus the lowest categories of weight gain, we found a significant association between weight gain after age 18 and breast cancer incidence with an OR of 1.25 (95% CI, 1.07–1.48) (Supplementary Fig. 3).
Menopausal status was a source of heterogeneity (chi-squared test statistic of 36.5 and a p-value < 0.001; Fig. 2). When comparing the highest versus the lowest categories of weight gain, the OR decreased to 1.01 (95% CI, 0.92–1.12), and the I2 value decreased to 6.29% in premenopausal women; the OR increased to 1.53 (95% CI, 1.40–1.68), and the I2 value decrease to 0% in postmenopausal women (Fig. 2). These results underscore a significant association between weight gain after age 18 and breast cancer incidence in postmenopausal, while such an association was not observed in premenopausal women. This highlights that menopausal status is a strong driver of heterogeneity. Furthermore, the 95% CIs did not overlap between the pre- and postmenopausal women, which also suggests a difference in effect size between them.
Fig. 2
Forest plot for the association between weight gain after age 18 and breast cancer risk in case-control studies, stratified by menopausal status
Additionally, we had similar findings in a separate meta-analysis for studies using continuous weight gain (per 5 kg) as a measurement. We observed a significant overall association for every 5 kg increase in weight and breast cancer incidence with an OR of 1.08 (95% CI, 1.02–1.13) (Fig. 3) with menopausal status being a source of heterogeneity (chi-squared test statistic of 7 and a p-value = 0.01; Fig. 3). The association between every 5 kg increase in weight and breast cancer incidence was significant only in postmenopausal women (OR = 1.12; 95%CI = 1.05–1.21; Fig. 3).
Fig. 3
Forest plot for the association between per 5 kg weight change after age 18 and breast cancer risk in case-control studies, stratified by menopausal status
We did not observe any differences by country of study (chi-squared test statistic of 0.64 and a p-value = 0.42; Supplementary Fig. 4), or by hormone receptor status (chi-squared test statistic of 0.13 and a p-value = 0.72; Supplementary Fig. 5).
Cohort studiesWe included 6 cohort studies with a total of 12 separate RRs (Supplementary Fig. 6). When comparing the highest versus the lowest categories of weight gain, we found a statistically significant overall association between weight gain after age 18 and breast cancer incidence, with an RR of 1.22 (95% CI, 1.09–1.36) (Supplementary Fig. 6).
After stratifying by menopausal status, we found that the association between weight gain after age 18 and breast cancer incidence was significant only in postmenopausal women (RR = 1.30; 95% CI = 1.15–1.46), not in premenopausal women (RR = 1.06; 95% CI = 0.92–1.22). The chi-squared test statistic of 4.87 and a p-value of 0.03 suggested that menopausal status was a significant source of heterogeneity (Fig. 4).
Fig. 4
Forest plot for the association between weight gain after age 18 and breast cancer risk in cohort studies, stratified by menopausal status
Excluding the cohort study by Rosner (2017), which reported HRs, did not change the overall pooled estimates in our meta-analysis. However, the chi-squared test statistic decreased to 1.92 with a p-value of 0.17, indicating that menopausal status was no longer a significant source of heterogeneity (Supplementary Fig. 7). Unfortunately, due to the limited number of available cohort studies and the lack of detailed information on certain variables, we were unable to conduct further investigations of potential sources of heterogeneity.
留言 (0)