
記住我

Patient baseline values for adjusted characteristics prior to matching are provided in Table 1 for both bDMARD-naïve and TNFi-IR patient subgroups in the bimekizumab and secukinumab RCTs. Prior to matching, a greater proportion of patients in the BE OPTIMAL and BE COMPLETE/BE VITAL trials had psoriasis covering BSA ≥ 3% (TNFi-IR patients only in BE COMPLETE/BE VITAL), were receiving MTX therapy, had lower HAQ-DI scores, and had lower SJC/TJC scores compared to patients in the corresponding subgroups in FUTURE 2.
Table 1 Baseline characteristics of patients from bimekizumab (BE OPTIMAL/BE COMPLETE/BE VITAL) and secukinumab (FUTURE 2) trials before matchingBase Case Analysis—vs FUTURE 2bDMARD-Naïve Patient SubgroupIn this MAIC analysis, patients from the bimekizumab arm of BE OPTIMAL (n = 431) were matched to a subgroup of patients who were bDMARD-naïve from FUTURE 2 (secukinumab 150 mg, n = 63; secukinumab 300 mg, n = 67). After matching, the post-matching ESS for bimekizumab was 236.15 (54.8% of the OSS) for comparison to both secukinumab 150 mg and 300 mg Q4W (Fig. 2a/c and Table S1).
Fig. 2
Matching-adjusted odds ratio comparison of bimekizumab vs secukinumab (150 mg and 300 mg) at week 52 (NRI). a BKZ 160 mg Q4W vs SEC 150 mg Q4W in patients with PsA who were bDMARD-naïve, b BKZ 160 mg Q4W vs SEC 300 mg Q4W in patients with PsA who were bDMARD-naïve, c BKZ 160 mg Q4W vs SEC 150 mg Q4W in patients with PsA who were TNFi-IR, d BKZ 160 mg Q4W vs SEC 300 mg Q4W in patients with PsA who were TNFi-IR. *Indicates statistical significance. Figure shows a logarithmic scale. ACR American College of Rheumatology, ACR20/50/70 at least a 20/50/70% improvement according to the ACR response criteria, bDMARD biologic disease-modifying anti-rheumatic drugs, BKZ bimekizumab, CI confidence interval, ESS effective sample size, MDA minimal disease activity, NRI non-responder imputation, OR odds ratio, PsA psoriatic arthritis, pts patients, Q4W every 4 weeks, SEC secukinumab, TNFi-IR tumor necrosis factor inhibitor-inadequate response or intolerant
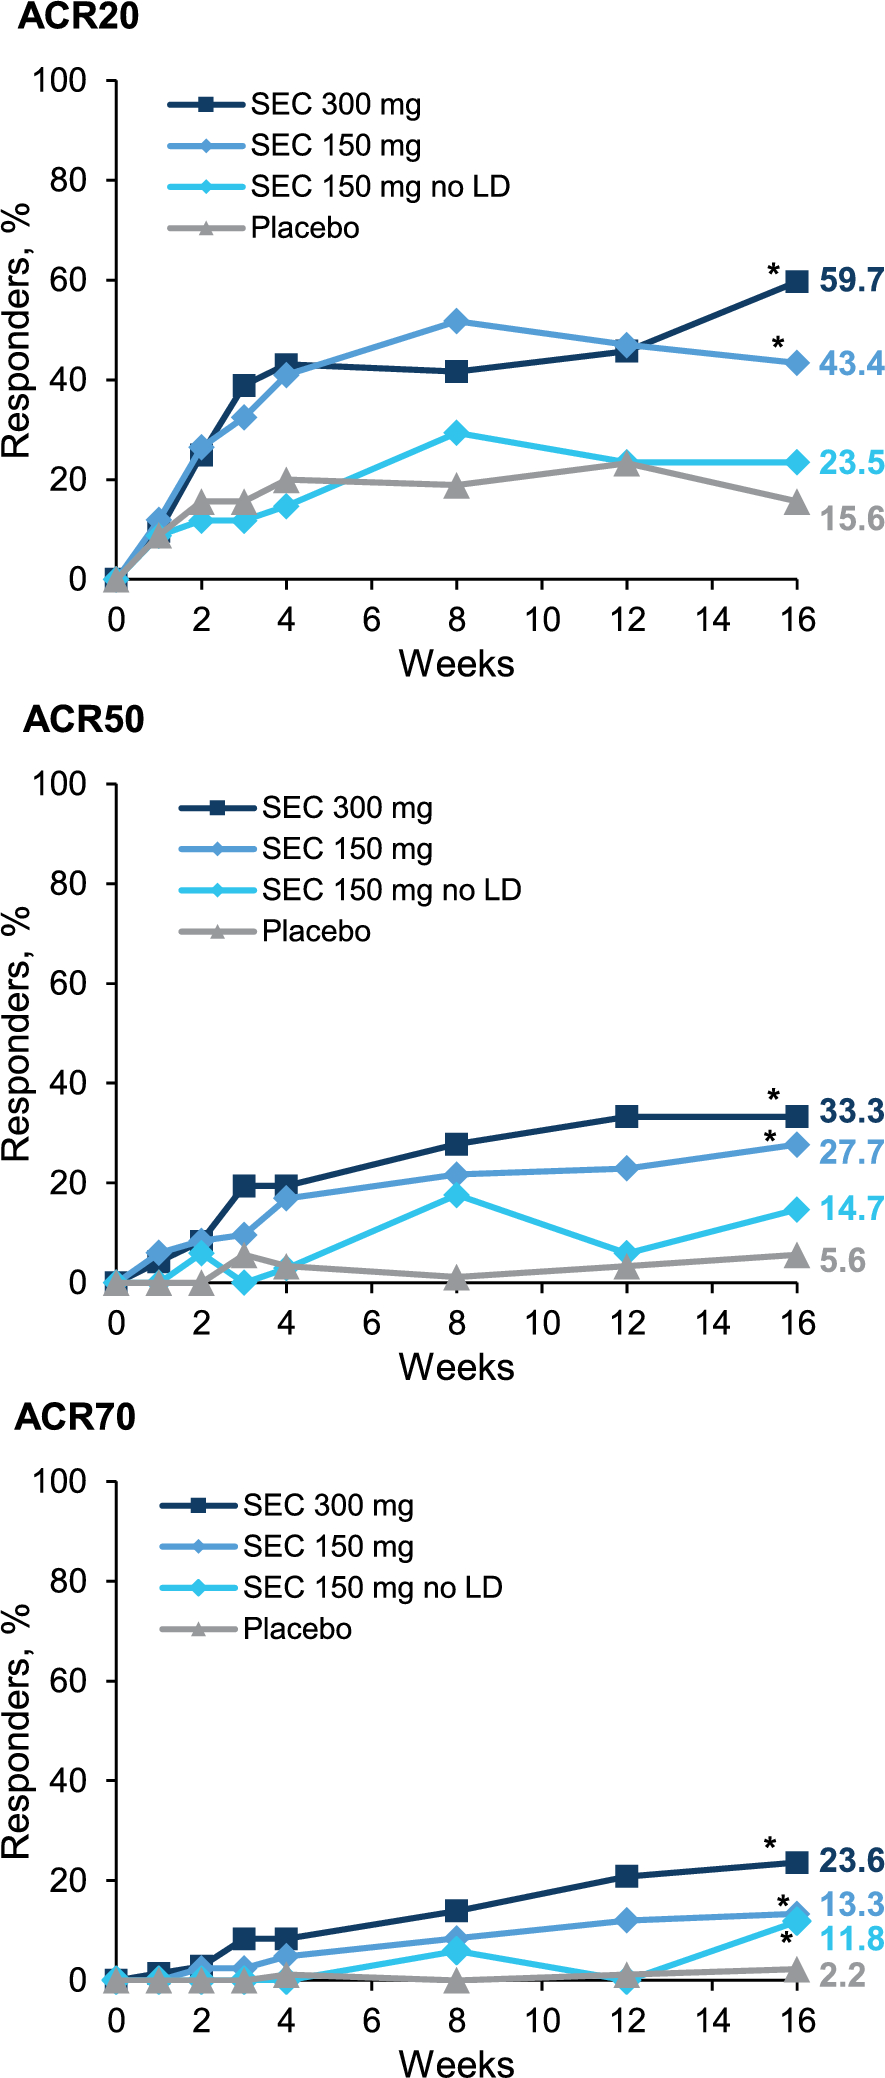
In patients who were bDMARD-naïve, bimekizumab had a greater likelihood of achieving ACR70 response than secukinumab 150 mg at week 52 (OR [95% CI] 2.39 [1.26, 4.53], p = 0.008) and was comparable with secukinumab 150 mg in achieving ACR20 (0.64 [0.32, 1.26], p = 0.193), ACR50 (1.20 [0.69, 2.10], p = 0.522), and MDA (1.77 [1.00, 3.15], p = 0.051) responses (Fig. 2a). Compared to secukinumab 300 mg, bimekizumab had a greater likelihood of achieving ACR70 (2.03 [1.11, 3.72], p = 0.021) response at week 52 and was comparable in achieving ACR20 (1.12 [0.62, 2.03], p = 0.704), ACR50 (1.06 [0.62, 1.83], p = 0.827), and MDA (1.53 [0.87, 2.68], p = 0.138) responses (Fig. 2c).
TNFi-IR Patient SubgroupPatients from the bimekizumab arm of BE COMPLETE (n = 267) were matched to a subgroup of patients who were TNFi-IR from FUTURE 2 (secukinumab 150 mg, n = 37; secukinumab 300 mg, n = 33). The post-matching ESS for bimekizumab was 145.50 (54.5% of OSS) for comparison to both secukinumab 150 mg and 300 mg Q4W (Fig. 2b/d and Table S2).
In patients who were TNFi-IR, bimekizumab had a greater likelihood of response for all ACR and MDA outcomes than secukinumab 150 mg at week 52 (ACR20: 3.50 [1.64, 7.49], p = 0.001; ACR50: 3.32 [1.41, 7.80], p = 0.006; ACR70: 2.95 [1.08, 8.07], p = 0.035; MDA: 3.52 [1.38, 8.99], p = 0.009) (Fig. 2b). Compared to secukinumab 300 mg, bimekizumab had a greater likelihood of achieving ACR50 (2.44 [1.06, 5.65]; p = 0.037) and MDA (2.92 [1.20, 7.09], p = 0.018) responses at week 52 and was comparable in achieving ACR20 (1.78 [0.82, 3.87], p = 0.147) and ACR70 (2.08 [0.80, 5.37], p = 0.131) responses (Fig. 2d).
Sensitivity Analysis—vs Pooled Data from FUTURE 2–5A sensitivity analysis was conducted using pooled data from the FUTURE 2–5 trials [22] to support the findings of the base case analysis (which used only FUTURE 2 data).
bDMARD-Naïve Patient SubgroupPatients from the bimekizumab arm of BE OPTIMAL (n = 431) were matched to a subgroup of patients who were bDMARD-naïve from pooled analyses of FUTURE 2–5 (secukinumab 150 mg, n = 643; secukinumab 300 mg, n = 316]. The post-matching ESSs for bimekizumab were 304.81 (70.7% of OSS) and 281.93 (65.4% of OSS) for the comparison to SEC 150 mg and 300 mg Q4W, respectively (Fig. 3a/c and Table S3).
Fig. 3
Sensitivity analysis of MAIC using pooled data from FUTURE 2–5 RCTs for secukinumab. a BKZ 160 mg Q4W vs SEC 150 mg Q4W in patients with PsA who were bDMARD-naïve, b BKZ 160 mg Q4W vs SEC 300 mg Q4W in patients with PsA who were bDMARD-naïve, c BKZ 160 mg Q4W vs SEC 150 mg Q4W in patients with PsA who were TNFi-IR, d BKZ 160 mg Q4W vs SEC 300 mg Q4W in patients with PsA who were TNFi-IR. *Indicates statistical significance. Figure shows a logarithmic scale. ACR American College of Rheumatology, ACR20/50/70 at least a 20/50/70% improvement according to the ACR response criteria, bDMARD biologic disease-modifying anti-rheumatic drugs, BKZ bimekizumab, CI confidence interval, ESS effective sample size, MAIC matching-adjusted indirect comparison, NRI non-responder imputation, OR odds ratio, pts patients, Q4W every 4 weeks, SEC secukinumab, TNFi-IR tumor necrosis factor inhibitor-inadequate response or intolerant
In patients who were bDMARD-naïve, bimekizumab had a greater likelihood of achieving ACR50 response than secukinumab 150 mg at week 52 (1.46 [1.11, 1.93], p = 0.007) and was comparable with secukinumab 150 mg in achieving ACR20 response (1.17 [0.87, 1.59], p = 0.305) (Fig. 3a). Bimekizumab was also comparable with secukinumab 300 mg in achieving ACR20 (1.02 [0.71, 1.45], p = 0.926) and ACR50 (1.19 [0.86, 1.65], p = 0.283) responses at week 52 (Fig. 3c).
TNFi-IR Patient SubgroupPatients in the bimekizumab arm of BE COMPLETE (n = 267) were matched to a subgroup of patients who were TNFi-IR from pooled analyses of FUTURE 2–5 (secukinumab 150 mg, n = 264; secukinumab 300 mg, n = 145). The post-matching ESSs for bimekizumab were 116.71 (43.7% of OSS) and 141.99 (53.2% of OSS) for the comparison to secukinumab 150 mg and 300 mg Q4W, respectively (Fig. 3b/d and Table S4).
In patients who were TNFi-IR, bimekizumab had a greater likelihood of achieving ACR20 (2.52 [1.57, 4.03], p < 0.001) and ACR50 (2.72 [1.71, 4.32], p < 0.001) response than secukinumab 150 mg at week 52 (Fig. 3c). Bimekizumab also had a greater likelihood of achieving ACR20 (1.69 [1.04, 2.76], p = 0.034) and ACR50 (2.16 [1.32, 3.53], p = 0.002) responses than secukinumab 300 mg at week 52 (Fig. 3d).
Unadjusted and adjusted response rates and ORs for both the base case and sensitivity analyses are available from Tables S1 to S4 in the Supplementary Materials. The adjusted ORs were comparable to the unadjusted ORs for all outcomes, which provides further support for the validity of these findings.
留言 (0)