
記住我


The single-arm, prospective multi-center study was a post-market clinical study to further assess the safety and effectiveness of HPI. The trial was approved by a central Institutional Review Board (IRB; Western IRB approval #1-1131056-1) and 8 local IRBs. It was registered with clinicaltrials.gov (NCT03805217, registered 1/15/19, first participant enrolled 5/16/19, PI: Bao). Written informed consent was obtained from each subject in the prospective trial, but not from subjects who were retrospectively included in the comparison groups. Adverse events were reported by the trial sites, and an independent Clinical Events Committee reviewed event narratives, patient profiles, and hemodynamics to adjudicate all adverse events for attribution, severity, and relatedness to fluid management recommendations; classified as “not related”, “possibly related” or “related” to the software use, per FDA guidelines.
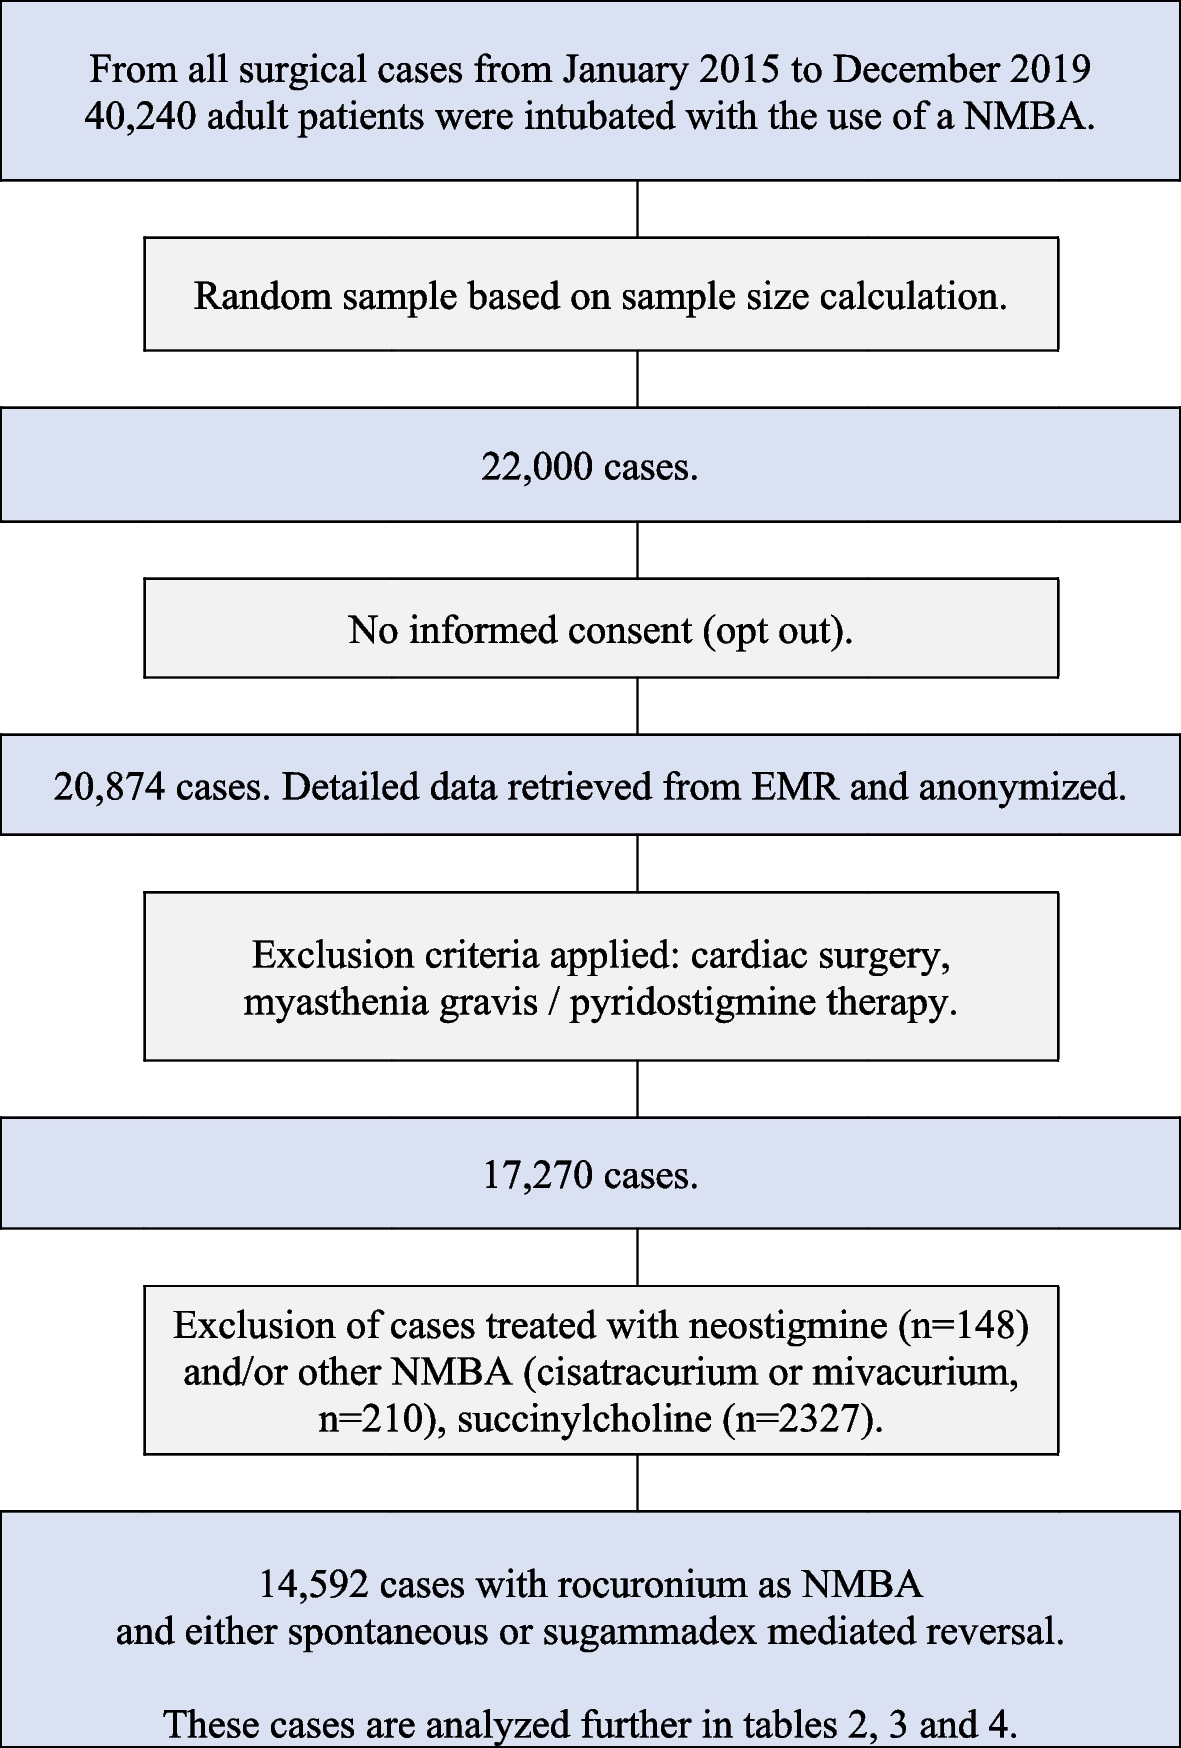
Subject selectionTrial subjects were recruited from 11 academic hospitals across the USA, with no site exceeding 20% of the total enrollment. Three pilot subjects (pilot cohort) were permitted per site for training purposes before formal data acquisition began. We included adults ≥ 18 years old who were scheduled for elective moderate- or high-risk (defined by the primary anesthesia team), noncardiac surgical procedures, including orthopedic surgery, spine surgery, abdominal/pelvic surgery, or major peripheral vascular surgery, expected to last 3 h or longer. All subjects were American Society of Anesthesiologists (ASA) physical status 3 or 4 and required intra-operative mechanical ventilation and arterial catheterization for continuous blood pressure monitoring as part of their anesthetic care plan. Patients were excluded if they had significant cardiac valvular disease including aortic stenosis ≤ 1.5 cm2, moderate-to-severe mitral stenosis, moderate-to-severe aortic or mitral regurgitation; intra-cardiac shunt; atrial fibrillation; acute heart failure; on support by intra-aortic balloon pump or ventricle assist device or multiple vasoactive agents; sepsis; planned ventilation with tidal volume below 8 ml/kg of ideal body weight; as well as those scheduled for burn surgery, neurosurgical procedures, open-chest procedures or urgent/emergent surgery.
Trial protocolSubjects were enrolled after signing informed consent and having an arterial catheter connected to FloTrac IQ sensor and EV1000 platform containing the predictive software. The software was activated after confirming a good-quality arterial waveform signal using a square wave test. The predictive index, ranging from 0 to 100, was displayed on the monitor, indicating the likelihood of patients having a hypotensive event. A secondary screen with quantitative hemodynamic parameters including cardiac output, stroke volume variation, change of pressure over the change of time, systemic vascular resistance, and dynamic arterial elastance aided clinician assessment of physiological conditions (Fig. 1). When the hypotension prediction index exceeded 85 for two consecutive 20-s updates, a popup alert appeared on the monitor to alert anesthesia providers. The care team could administer fluid and/or vasoactive agents using advanced hemodynamic data or could choose to ignore alerts based on their clinical assessment after coaching from the research team about the software.
Fig. 1 Trial endpoints
The primary endpoint for the trial was a cumulative duration of intraoperative hypotension. The secondary endpoint was the area under MAP of 65 mmHg. Data for the trial endpoints were downloaded from the EV1000 monitor, which records vitals and the predictive index every 20 s during the monitoring time. An episode of intraoperative hypotension was defined as three or more consecutive 20-s observations of MAP < 65 mmHg. Duration of hypotension was calculated as the sum of episodes where MAP < 65 mmHg for at least 1 min during the monitoring period. The area under MAP of 65 mmHg was calculated using the trapezoidal rule to estimate the area of pressure and time. The total area was obtained using the formula below.
$$\textrm\ \textrm=\sum_1^k\sum_1^l\Big(\left(_-_\right)\ast \left(65-\left(\frac_+_\right)}\right)\right)$$
where tij is the measurement time of the ith hypotension increment of the jth hypotension episode for the patient and pij is the mean pressure in mmHg for the ith hypotension increment of the jth hypotension episode. The episode for each patient begins, t0j, with the first of two successive pressure measurements below MAP 65 mmHg and continues until the MAP raises to 65 mmHg or above. The trapezoidal rule sums the average decreases in pressure from 65 mmHg between two measurement times and multiplies that by the difference of the time increment between. Then, the areas per episode are summed across the total number of episodes.
Statistical analysisSingle-arm trial with historical comparison groupA statistical analysis plan for the single-arm trial was written, date-stamped, and recorded in the investigators’ files before data were accessed (Appendix 1). The analysis excluded subjects in the pilot cohort. Mean duration of hypotension was calculated with a weighted average of site means and standard deviations as described in Appendix 1. The standard deviation of the duration of hypotension is the square root of the pooled variance with each study site’s hypotension variance. The trial participants were compared to a historical comparison cohort identified in registry data using t-tests. The Multicenter Perioperative Outcomes Group (MPOG) provided summary statistics on 22,109 adult patients with ASA 3 and 4 physical status, undergoing surgeries ≥ 180 min, with arterial line monitoring, treated between January 1, 2017 and December 31, 2017, at the same 11 hospitals that participated in the HPI effectiveness study (Shah et al., 2020). This information was used as a historical control to define the retrospective amount of IOH, which was compared to that found in this prospective HPI multicenter study. All trial analyses were completed with SAS version 9.4.
Post-hoc analysis with propensity score-weighted comparison groupTo supplement the trial analysis that was designed a priori, we conducted a post hoc analysis that compared the duration of hypotension and the secondary outcome (AKI) among a subset of patients in the trial treatment group with a propensity-score weighted contemporaneous control group, using data reported from MPOG for hospitals that participated in the trial. Trial subjects, including both pilot and non-pilot subjects, from 10 of the 11 sites (“Trial”) were compared with a contemporaneous cohort of patients who had surgery in the same 10 sites from May 2019 to October 2020 and who did not participate in the trial (“Comparison”). Data were not available from MPOG for the 11th trial site for that time period. To maintain the inclusion and exclusion criteria from the trial, similar eligibility criteria were applied using definitions that could be applied to retrospective data, as specified in Appendix 2.
This post hoc analysis was conducted in collaboration with the MPOG consortium. The MPOG Site Primary Investigators at the HPI participating sites approved the use of the dataset for this project, and the analytic plan was presented at the MPOG Perioperative Clinical Research Committee. As has been previously described, the MPOG consortium (see www.mpog.org) maintains a detailed clinical and administrative data repository from participating hospitals across the United States. MPOG data include automated extraction of both device-captured and manually entered Electronic Health Record (EHR) data, including patient and procedural characteristics, anesthetic medications, physiologic parameters, and key surgical events for patients undergoing anesthesia care at contributing institutions. Monthly site-specific case validation for a random sample of submitted data by subject-matter experts is required of all contributing sites, and additional quality checks are conducted at the coordinating center to monitor each center’s data uploads and to remove artifacts from machine-captured variables.
Data elements from MPOG used in this analysis included patient demographics (age, sex, BMI, ASA status), clinical characteristics (Elixhauser comorbidities), procedural characteristics (procedure codes, blood pressure observations, vasopressor use, estimated blood loss), and patient outcomes (AKI).
The main outcome of the post hoc analysis was the duration of hypotension in minutes (defined as MAP < 65 mmHg for at least 1 min). The secondary outcome was AKI (using the Kidney Disease–Improving Global Outcomes definition of Stage 1 or greater, as an increase of serum creatinine more than 0.3 mg/dl above baseline within 48 h of anesthesia end time or more than 50% elevation within 7 postoperative days) (Disease, 2012).
A statistical analysis plan for the post hoc analysis, specifying the outcomes and methods, was drafted after the completion of the trial but before the post hoc analyses began (Appendix 2). Descriptive statistics for continuous data were reported as mean ± standard deviation or median (interquartile range) depending on the distribution of the data. Categorical data is presented as frequency counts and proportions. Weighted and unweighted standardized mean differences were calculated and reported to compare trial participants to the comparison group.
The post hoc analysis evaluated the association between the prediction software and the incidence of intraoperative hypotension, as defined above. To evaluate the difference in hypotension duration conditional on the use of the prediction software, a generalized linear model was conducted regressing the duration of hypotension on the fixed effects for software presence or absence. Given the skewed distribution for the duration of hypotension, a log link was specified to accommodate the distribution under study. Because it was anticipated that patients with longer surgical cases may have an increased period at risk of developing hypotension, the model was adjusted a priori for the duration of intraoperative blood pressure measurement (i.e., time at risk).
It was also anticipated that patients may have a different probability of participating in the trial, therefore the analysis employed the use of propensity score analyses. Specifically, individuals who elected to participate in the single-arm trial might possess characteristics that differentiate them from eligible individuals who either declined to participate or were not offered participation. To address this selection mechanism, a logistic regression model was first developed that predicts trial participation (i.e., yes vs no) conditional on demographic and disease characteristics. The predicted probability of participation was then used as an inverse probability of treatment weight (IPTW) in a second and final model (the primary analysis) that examines each outcome conditional on prediction software use (i.e., yes or no) and duration of blood pressure measurement. Variables in this IPTW included age, sex, race, ethnicity, ASA physical status, Vanwalraven Elixhauser Comorbidity Index, procedure timing (afternoon or morning), and procedural service. Several versions of the inverse-probability of treatment weights were considered but non-truncated and non-stabilized weights were chosen based on the distribution of estimated propensity scores. Results are presented as exponentiated coefficients that yield a percent difference (i.e., a ratio of geometric means) in the duration of hypotension between the trial and comparison groups and their associated 95% confidence intervals (CI).
The secondary outcome was evaluated using a similar approach but with a generalized linear model that included a binomial distribution and logit link function. Results of the secondary outcome are thus presented as an odds ratio and 95% confidence interval (CI). A sensitivity analysis was performed for both the primary and secondary outcomes using multiple imputation with chained equations (m = 40 imputations) which were derived from the preoperative clinical characteristics used in the propensity model.
All post hoc analyses were performed using R version 4.1.2 (R Foundation for Statistical Computing, Vienna, Austria) and RStudio (RStudio PBC, Boston, MA, USA), with two-sided p values < 0.05 considered statistically significant.
Trial sample size estimateRecent analyses demonstrated a mean duration of hypotension of 29.27 min with a standard deviation 43.44 (Shah et al., 2020). We anticipated that the use of the predictive algorithm would reduce that duration by 25%, based on based on an advisory panel expert opinion and review of recent literature (van Waes et al., 2016; Maheshwari et al., 2018; Stapelfeldt et al., 2017). The ratio of the standard deviation to the mean in the previous data was 1.44; however, the ratio from other publications on hypotension and data gathered by the sponsor varied between 0.88 to 1.76. To protect against the uncertainty of the ratio underpowering the study, additional computations were done to make the estimate more conservative with a standard deviation to mean ratio of 1.65. The minimum recommended required sample size, using Pass 14, is 380 completed subjects for 90% power for a one-sided alpha = 0.025 test. Assuming 10% attrition for a less than 3-h surgery and a 5% loss to follow-up, the recruited sample size was estimated as a minimum of 380/0.85 ≈ 448 for 90% power in the non-pilot cohort. Therefore, the study sample size was capped at 485, including up to 33 pilot subjects and up to 452 non-pilot subjects, for a minimum of 90% power.
留言 (0)