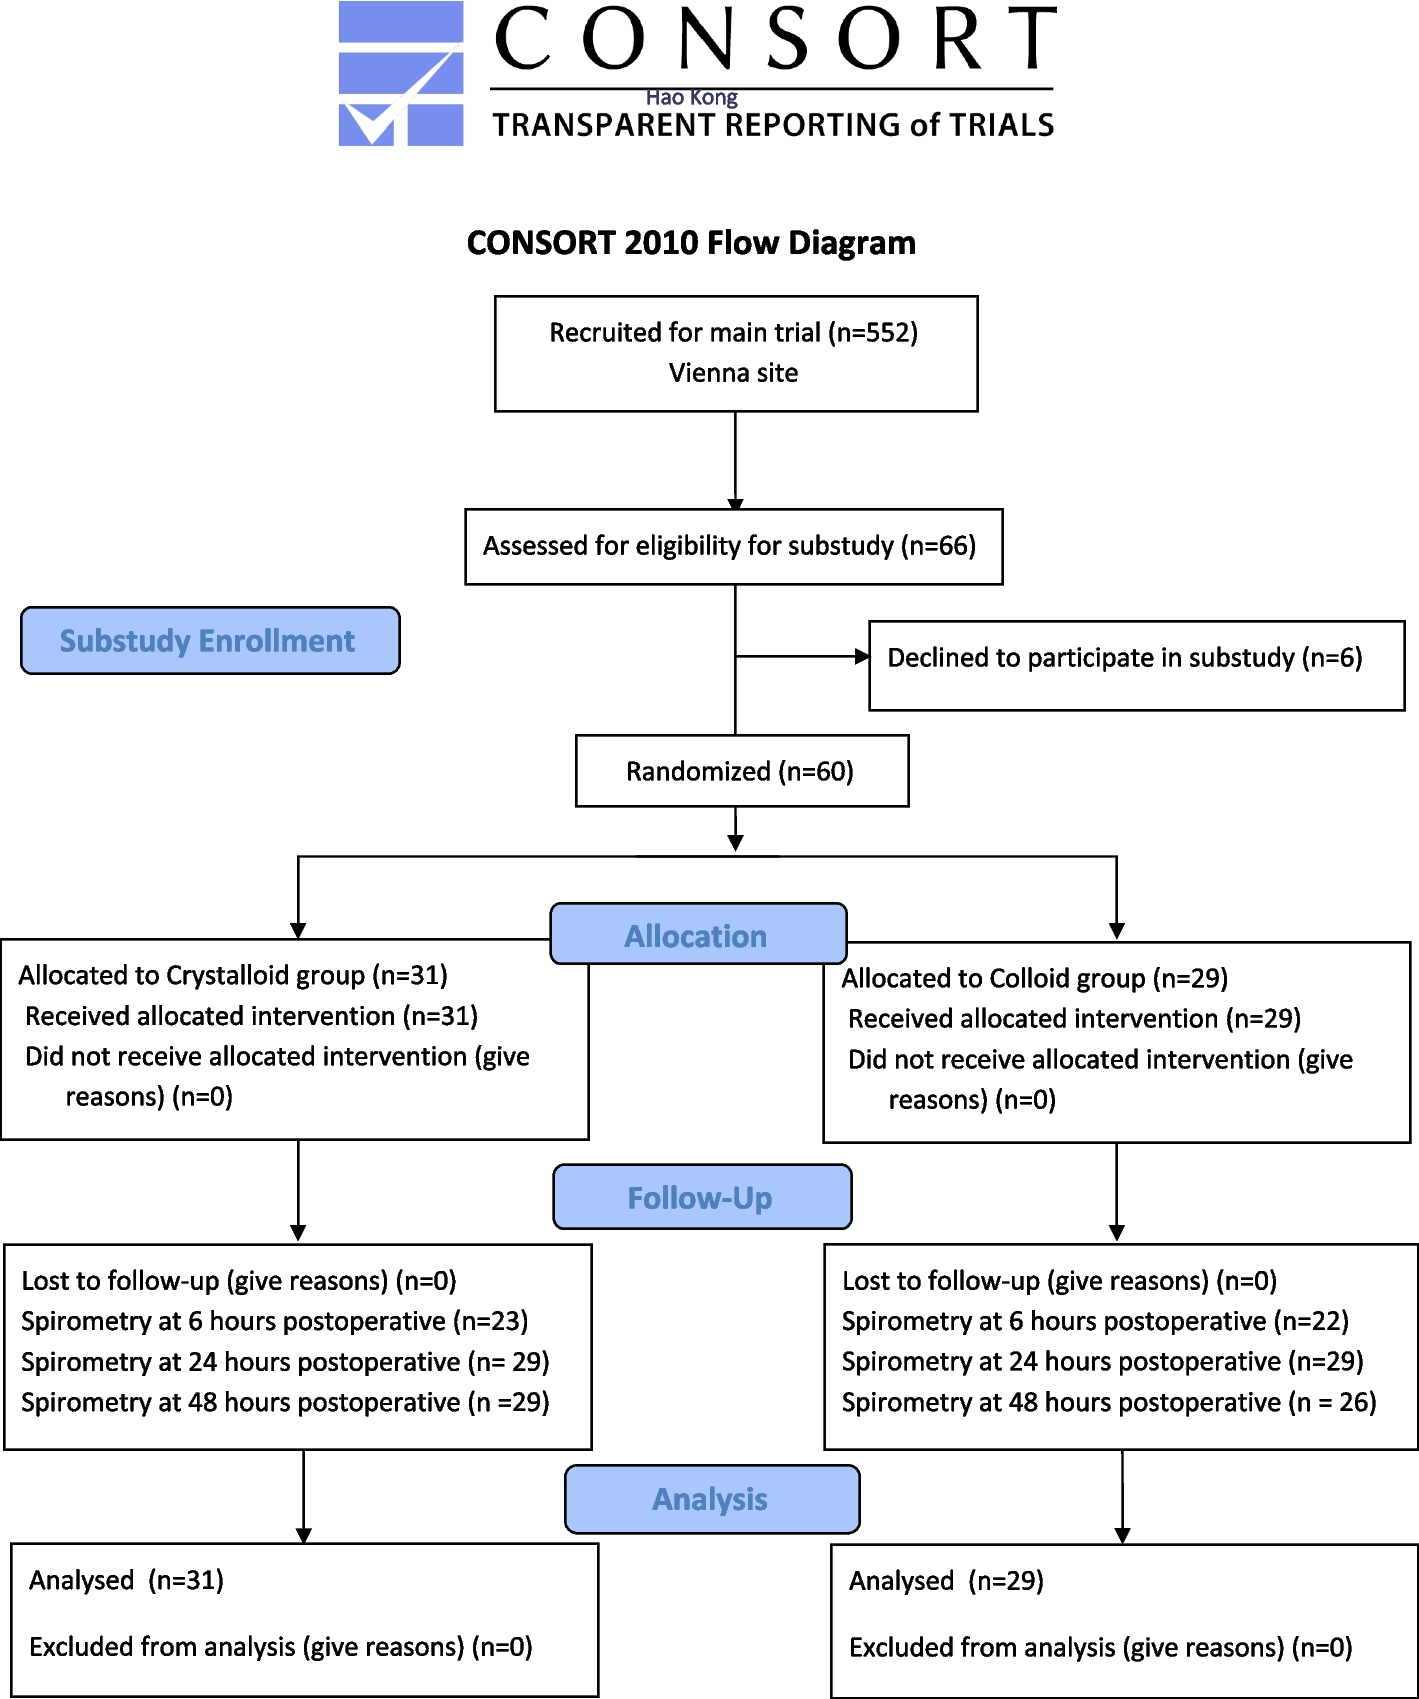
This prospective, parallel group, randomized, controlled, double-blinded trial was performed at the Department of Anaesthesia, Intensive Care Medicine and Pain Medicine of the Medical University of Vienna. The study was approved as a part of a large multicenter outcome trial evaluating the effect of goal-directed administration of crystalloids or colloids on a composite of postoperative complications and morbidity (Kabon et al. 2019). The trial was approved by the local ethics committee (EK 431/2005), registered at ClinicalTrials.gov (NCT00517127) and EudraCT (2005-004602-86), and conducted in accordance with the Declaration of Helsinki and good clinical practice. Written informed consent was obtained from all participants. This manuscript adheres to the applicable CONSORT guidelines.
We included patients scheduled for elective moderate- to high-risk open abdominal surgery with an expected duration of at least 2 h who were aged between 18 and 80 years, were American Society of Anesthesiologists physical status I-III, and had a body mass index (BMI) of less than 35 kg.m−2. We excluded patients who had compromised kidney function (estimated creatinine clearance less than 30 ml.min−1), estimated cardiac ejection fraction less than 35%, severe chronic obstructive pulmonary disease, coagulopathies, or known esophageal or aortic abnormalities.
Anesthetic management
General anesthesia was induced with 1–3 μg.kg−1 fentanyl, 2–3 mg.kg−1 propofol, and 0.6 mg.kg−1 rocuronium. Following intubation, anesthesia was maintained with sevoflurane (up to 1.5 mean alveolar concentration) in a carrier gas of 80% inspired oxygen. According to patients’ requirements, additional fentanyl and non-depolarizing neuromuscular blocking agents were administered throughout surgery. Standard monitoring included electrocardiography, noninvasive arterial blood pressure measurement, pulse oximetry, and esophageal core temperature monitoring. After induction of anesthesia, all patients received an arterial line; central venous catheters were placed as deemed clinically necessary. We performed pressure-controlled mechanical ventilation with tidal volumes between 6 and 8 ml.kg−1 ideal body weight and a positive end-expiratory pressure (PEEP) of 5 mmHg. Ventilatory rate was adjusted to keep end-tidal carbon dioxide levels of 35–40 mmHg, and inspiratory to expiratory time ratio was set at 1:1.7. Maintained a hematocrit level > 30% in patients with known cardiovascular disease and age > 65 years, 28% in patients with one or the other, and 26% in the others. We actively warmed all patients with convective warming to maintain perioperative normothermia. At the end of surgery and after complete reversal of the neuromuscular blockade, patients were extubated following manual hyperinflation with a maximal pressure of 30 mmHg, while no further recruitment maneuvers were performed during surgery. Patients were transferred to postoperative care unit (PACU) or intensive care unit (ICU) at the discretion of the attending anesthesiologist.
Randomization and fluid management
Shortly before induction of anesthesia, patients were randomized 1:1 to either additional goal-directed bolus administration of crystalloids (lactated Ringer’s solution, Fresenius Kabi, Germany) or goal-directed bolus administration of colloids (hydroxyethyl starch 6% 130/0.4, Voluven, Fresenius-Kabi, Germany). The randomization sequence was generated by the study statistician using the PLAN procedure in SAS statistical software (SAS Institute, USA) using randomly sized blocks. A trained study coordinator evaluated eligibility, obtained informed consent, and then on the day of surgery before induction of anesthesia enrolled the participants by opening the concealed envelope. Intraoperative investigators and clinicians were not blinded to treatment. However, an observer strictly blinded to group assignment performed postoperative spirometry.
All patients were given 5–7 ml.kg-1 of lactated Ringer’s solution during induction of anesthesia followed by 3–5 ml.kg−1.h−1 for maintenance, normalized to ideal body weight, throughout surgery. We calculated the ideal body weight according to the Robinson formula (Robinson et al. 1983). Thereafter, the randomized fluid, crystalloid, or colloid was administered esophageal Doppler (Cardiac Q, Deltex Medical Group PLC, Chichester, UK) guided according to a previously published algorithm (Gan et al. 2002). A 250-ml aliquot of lactated Ringer’s solution or 6% hydroxyethyl starch was administered when corrected flow time (FTc) was less than 0.35 s. If stroke volume (SV) increased ≥ 10% and FTc still remained below 0.35 s, the bolus was repeated until no further increase in stroke volume was observed. If FTc increased above 0.35 s, no further fluid challenge was administered, and measurements were repeated after 10 min. If FTc remained low after bolus administration and SV did not increase by ≥ 10%, no further bolus was administered, and measurements were repeated after 10 min. When we observed a further decrease in SV by at least 10% of the last measured value, the fluid challenge was repeated. In case of a mean arterial blood pressure (MAP) below 65 mmHg and no Doppler-detected signs of hypovolemia, intravenous vasopressors were administered at the discretion of the attending anesthesiologist.
Postoperative care and spirometry
All patients received postoperative care according to clinical standard. Patients received 2 ml. kg−1.h−1 crystalloids with additional fluid as deemed clinically necessary for 2 h. Subsequently, fluid management was performed at the discretion of the attending physicians. We administered supplemental oxygen via a Venturi mask to maintain oxygen saturation above 96%. All study participants received intravenous patient-controlled analgesia (PCA). Patients were able to administer a bolus of 2.5-mg morphine when needed. No basal rate was set, and the lock out time was 10 min with a maximal dosage of four boluses per hour. Postoperative pain evaluation was performed with visual analogue scale, ranging from 0 (no pain) to 10 (worst pain imaginable). Scores were evaluated at rest and at effort, while patients were performing pulmonary function tests.
Pulmonary function was evaluated with a bedside spirometer (Spirobank-G™ Medical International Research, Rome, Italy) by a blinded investigator. Preoperatively, the requested tasks were demonstrated for patients in order to comprehend the correct technique. Then a clean, disposable mouthpiece was attached to the spirometer and a nose clip to the patients’ nose. Under detailed instructions, patients performed the tests to obtain values of forced vital capacity (FVC), forced expiratory volume in 1 second (FEV1), and peak expiratory flow (PEF). During performance of spirometry tests, patients were encouraged to inhale completely and exhale maximally until no more air could be breathed out. All tests were performed in a sitting position. Measurements were performed the day before surgery as baseline (T0) as well as after 6, 24, and 48 postoperative hours (T1–T3).
Measurements and outcomes
Patients’ demographic and morphometric data were recorded. We recorded all routine anesthetic, respiratory, and hemodynamic variables at 10-min intervals. Detailed records of intraoperative fluid balances including urinary output and estimated blood loss were kept. Arterial blood gases were obtained at least hourly during surgery, at arrival at the PACU or ICU, and during the first six postoperative hours according to clinical requirements. Postoperative fluid balances were recorded from time of arrival at the PACU or ICU until the second postoperative day.
Primary outcomes were FVC, FEV1, and PEF evaluated with means of bedside spirometry 6 h after extubation (T1). Secondary outcomes were summary measures of FVC, FEV1, and PEF until 48 postoperative hours (T1–T3). We also recorded supplemental oxygen requirements, postoperative pain scores, and morphine requirements at T1–T3.
Sample size calculation and statistical analysis
When the trial was initiated, no specific data about the fluid-sparing effect of goal-directed administered colloids versus crystalloids were available. Sample size calculation was thus based on results of a trial by Holte et al., which compared the effect of a restrictive and a liberal fluid regimen on postoperative pulmonary function and which showed a difference in FVC of approximately 0.5 l with standard deviations near 0.5 l 6 h postoperatively (Holte et al. 2007a). In this study, the ratio between the amounts of administered fluid in the two groups was approximately 1:3. This corresponded with our expected difference between crystalloids and colloids based on traditional doctrine. Assuming similar effects for goal-directed colloid administration, a sample size of 22 patients in each group was calculated, allowing a type I error of 5% and a type II error of 10%. To compensate for potential dropouts, we thus included 60 patients.
Groups were compared for balance in patients’ demographic data, intraoperative characteristics, and postoperative variables. Absolute standardized differences (ASD) were calculated for baseline characteristics and baseline spirometry data. Any variable with an absolute standardized difference > 0.20 (defined as small effect size) was considered imbalanced and thus included as a covariate in post hoc multivariable linear regression models with the primary outcome parameters as the dependent variable. Serial measurements of intraoperative parameters were averaged for each patient separately and then averaged among the patients in each treatment groups. Normal distribution was assessed with q-q plot and Kolmogorov-Smirnov test. Continuous data were compared using unpaired two-tailed t-tests, when values were normally distributed. Wilcoxon rank-sum test was used for continuous data, which were not normally distributed. Nominal data were analyzed with either chi-square or Fisher’s exact test. Paired comparisons between baseline data and primary outcome data were performed with Wilcoxon signed-rank test. Data were presented as means ± SD, medians (IQR), or as numbers (proportions) as appropriate.
We compared spirometry parameters 6 h after surgery and evaluated the differences in time courses of FEV1, FVC, and PEF between the two randomized groups using nonparametric analysis for longitudinal data in factorial designs as proposed by Brunner et al. Regarding our three different primary endpoints (FVC, FEV1, and PEF), a Bonferroni-corrected p-value < 0.016 was considered to be statistically significant. For all other variables, a p-value < 0.05 was considered to be statistically significant.
Analyses were conducted with SPSS software (IBM SPSS Statistics for Macintosh, Version 24.0. Armonk, NY, USA); R for Macintosh, Version 3.2.1 (https://www.R-project.org/) was used to calculate ASD.
For evaluating the time × group interaction as well as the within-group trend, the R-package nparLD, release 4.2.2 was used.


留言 (0)