
記住我


We analyzed the clinicopathological features of 41 patients with gastric cancer (Table 1). The mean age of the patients was 72 years (range, 43-89 years). The group included 31 men (75.6%) and 10 women (24.4%). The mean observation time was 18.2 months (range, 3-36 months).
Table 1 Clinicopathological characteristics (n=41)We then examined the relative expression of CX3CR1 using Opening and Closure samples by quantitative RT-PCR. Based on the determined cut-off value, patients were divided into two groups (CX3CR1high or CX3CR1low). We also analyzed the association between CX3CR1 expression and various clinicopathological findings and operative outcomes (Table 2). In Opening samples, we did not find any association between these findings and CX3CR1 levels. In contrast, Closure samples exhibited significant differences between CX3CR1high and CX3CR1low patients. Although clinical Stage and patients’ comorbidities did not differ statistically in CX3CR1 levels, analysis of perioperative laboratory data indicated that CX3CR1high patients showed higher NLR, PLR, and C-reactive protein (CRP) levels than CX3CR1low patients. Moreover, there was a trend toward higher pathological T and N stage in the CX3CR1high group than the CX3CR1low group, though the difference was not statistically significant. In terms of operative outcomes, CX3CR1 expression was not affected by operative procedure or postoperative complications. Following clinical and pathological staging, CX3CR1high patients underwent more extensive lymphadenectomy and received more adjuvant chemotherapy than CX3CR1low patients without statistical differences. Also, the duration of hospitalization and recurrences after surgery differed significantly between the CX3CR1high and CX3CR1low groups.
Table 2 Association of CX3CR1 expression in intraperitoneal lavage fluid with clinicopathological data and operative outcomesWe analyzed the change of CX3CR1 expression in ILF before and after surgical maneuvers designating the cut-off sample as a baseline (Fig .1a). As a result, we found that CX3CR1 expression in a lot of ILF elevated through surgery (p<0.0001). Based on CX3CR1high or CX3CR1low at ‘Opening’ and ‘Closure’, we designated CX3CR1 changing groups as high-high, low-high, high-low, and low-low (Opening-Closure). We then analyzed their association with clinicopathological features and operative outcomes (Table 3). The low-high group showed relatively high preoperative inflammatory markers, whereas the high-low group had as low levels of those as the low-low group. The low-high group also had a trend toward higher pT stages and more recurrences, and underwent more extensive lymphadenectomy than CX3CR1low groups at ‘Closure’.We also examined LOX-1 (OLR1 gene) and CD163 (CD163 gene) expression in Closure ILF using quantitative real-time PCR. In addition, to identify immunosuppressive status and immune cell exhaustion, PD-1 (PDCD1 gene) expression was investigated. In Closure samples, sufficient levels of LOX-1, CD163, and PD-1 were obtained from 41, 37, and 38 patients, respectively. We evaluated whether the levels of LOX-1, CD163, and PD-1 had any effect on clinicopathological features and operative outcomes (Table 4). Patients were divided into two groups based on the aforementioned cut-off values (Supplementary Fig. 1). Neither CD163 nor PD-1 expression was significantly associated with clinicopathological findings or blood test parameters. However, the LOX-1high group had higher perioperative NLR and PLR, more extensive lymph node metastasis, and more extensive vascular invasion than the LOX-1low group. No significant differences were observed between perioperative outcomes and LOX-1, CD163, and PD-1 expression. LOX-1 expression was associated with postoperative recurrences significantly.
Fig. 1
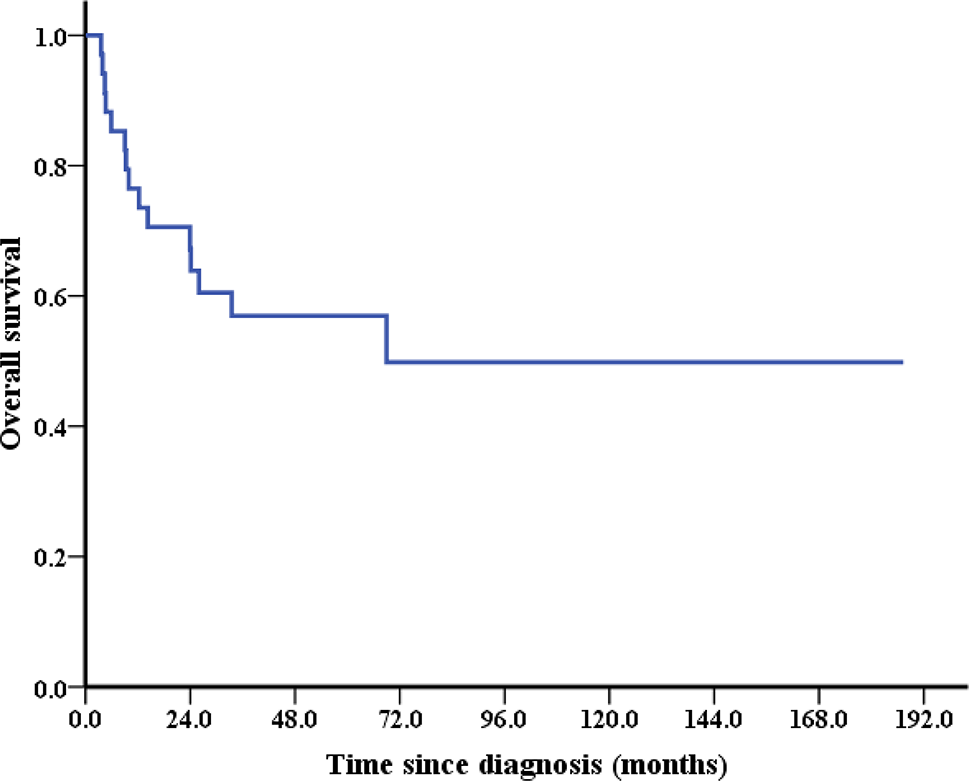
a The change of CX3CR1 expression through surgical maneuvers. b, c Comparison of relapse-free survival and overall survival based on levels of various molecules. P<0.05, statistically significant. b Relapse-free survival. c Overall survival. d Comparison of OLR1, CD163, and PDCD1 gene expression between CX3CR1high and CX3CR1low patients. *P<0.05, statistically significant. e Correlogram. Circle size indicates the degree of correlation. Figures in circles indicate correlation coefficients. Darker colors of circles indicate more-significant correlations. *P<0.05, statistically significant
Table 3 Association of CX3CR1 dynamic change in intraperitoneal lavage fluid with clinicopathological data and operative outcomesTable 4 Relevance to clinicopathological characteristics and operative outcomes with LOX-1, CD163, and PD-1 expressionAssociation between CX3CR1, LOX-1, CD163, and PD-1 expression and survival benefitsPrognostic impacts were examined based on the expression of CX3CR1, LOX-1, CD163, and PD-1 in ‘Closure’ ILF. (Fig. 1b, c). Although not statistically significant, all high-level CX3CR1, LOX-1, CD163, and PD-1 patients tended to have poorer RFS. With regard to OS, there were no significant differences between the high and low CX3CR1, LOX-1, CD163, and PD-1 expression groups.
Relationship between CX3CR1+ cell phenotype and LOX-1 and CD163We compared the expression of LOX-1, CD163, and PD-1 between the CX3CR1high and CX3CR1low groups in ‘Closure’ ILF. (Fig. 1d). The CX3CR1high group had higher levels of all three molecules than the CX3CR1low group. A correlogram for all three molecules is shown in Fig. 1e. CX3CR1 level was significantly correlated with PD-1 and LOX-1 expression. In particular, LOX-1 expression exhibited significant correlations with the expression of CX3CR1, CD163, and PD-1.
Considering the tumor-promoting trend and high inflammation parameters in Closure CX3CR1high patients, we used flow cytometry to classify the phenotypes of CX3CR1+ cells. With regard to tumor-promoting or immunosuppressive cells, CX3CR1 is reportedly expressed by Tregs, MDSCs, and TAMs [3]; therefore, we analyzed CD3 expression in Tregs, CD14 and CD163 expression in M-MDSCs and TAMs, and LOX-1 expression in PMN-MDSCs. Representative contour plots are shown in Fig. 2a, b. Representative histograms of these molecules are shown in Fig. 2c and revealed that the presence of these molecules was associated with CX3CR1 expression. We then analyzed the proportion of CX3CR1+ cells in ILF (Fig. 2d). This analysis showed that CX3CR1+ cells rarely express CD3 (6%), whereas a large number of LOX-1+ PMN-MDSCs (44%) and CD163+ TAMs (38%) were present. We confirmed the Treg population using a FoxP3 antibody as shown in Fig. 2e and observed a similar trend to Fig. 2d (Fig. 2f; Tregs, 2.6%). With regard to the fraction of CD14+ cells among CX3CR1+ cells, CD163+ TAMs constituted approximately 70% of CD14+CX3CR1+ cells (Fig. 2g).
Fig. 2
Flow cytometry analysis (n=8). a Representative contour plots of CD3 and LOX-1 positivity among CX3CR1+ cells. b Representative contour plots of CD14 and CD163 positivity among CX3CR1+ cells. c Representative histograms of CX3CR1+ cells classified by CD3, LOX-1, CD14, and CD163 positivity. d, e Bar graphs showing the mean and standard error. (d) Comparison of CD3, LOX-1, and CD163 positivity among CX3CR1+ cells. *P<0.05, statistically significant. NS, not significant. e Representative contour plots of FoxP3, LOX-1, and CD163 positivity among CX3CR1+ cells. f Comparison of FoxP3, LOX-1, and CD163 positivity among CX3CR1+ cells. *P<0.05, statistically significant. g Comparison of CD163 expression among CD14+CX3CR1+ cells. *P<0.05, statistically significant.
Cytokine levels within ILFWe used some Closure samples to analyze cytokine profiles and characterize local immune environment parameters such as promotion of inflammation and macrophage polarization. A total of 25 Closure samples contained sufficient protein for analysis, consisting of 17 CX3CR1high and 8 CX3CR1low samples. A heatmap showing the expression of 10 cytokines in these 25 samples is shown in Fig. 3a. The data indicated that compared with CX3CR1low samples, MDSCs and TAMs in CX3CR1high samples tended to secrete higher levels of various cytokines, including IL-4, IL-10, GM-CSF, and IFN-γ. We then compared the cytokine concentrations in detail between CX3CR1high and CX3CR1low samples (Fig. 3b). Both groups exhibited elevated levels of inflammatory proteins such as IL-6, MCP-1, MIP-1α, and VEGF, but the differences were not statistically significant. In addition, some CX3CR1high samples contained IL-4 and IL-10, whereas these proteins were rarely detected in CX3CR1low samples. Levels of GM-CSF, IFN-γ, IL-12p70, and TNF were also significantly higher in the CX3CR1high group than in the CX3CR1low group.
Fig. 3
Cytokine profiles of Closure samples. a Heatmap. CX3CR1 group is divided into two subgroups: the high group is shown in dark blue, and the low group is shown in light blue. b Comparison of levels of various cytokines between the CX3CR1high and CX3CR1low groups. P<0.05, statistically significant.
留言 (0)