
記住我
Our study is a subsample of the Dongfeng-Tongji cohort, which is a large and dynamic prospective cohort for long-term study of genetic and lifestyle determinants of chronic diseases of Chinese adults. Details on the rationale and design of the study have been presented previously [24]. Briefly, the Dongfeng-Tongji cohort initially enrolled 27,009 (14,957 women and 12,052 men) retired employees of the Dongfeng Motor Corporation, Shiyan City, China between 2008 and 2010, and additionally enrolled 14,120 retired workers in 2013. Socio-demographic information, anthropometric parameters, lifestyle factors (smoking status, alcohol intake, diet, physical activity, sleep), medical history, and medication history were elicited by trained interviewers. In addition, participants also provided overnight fasting blood samples.
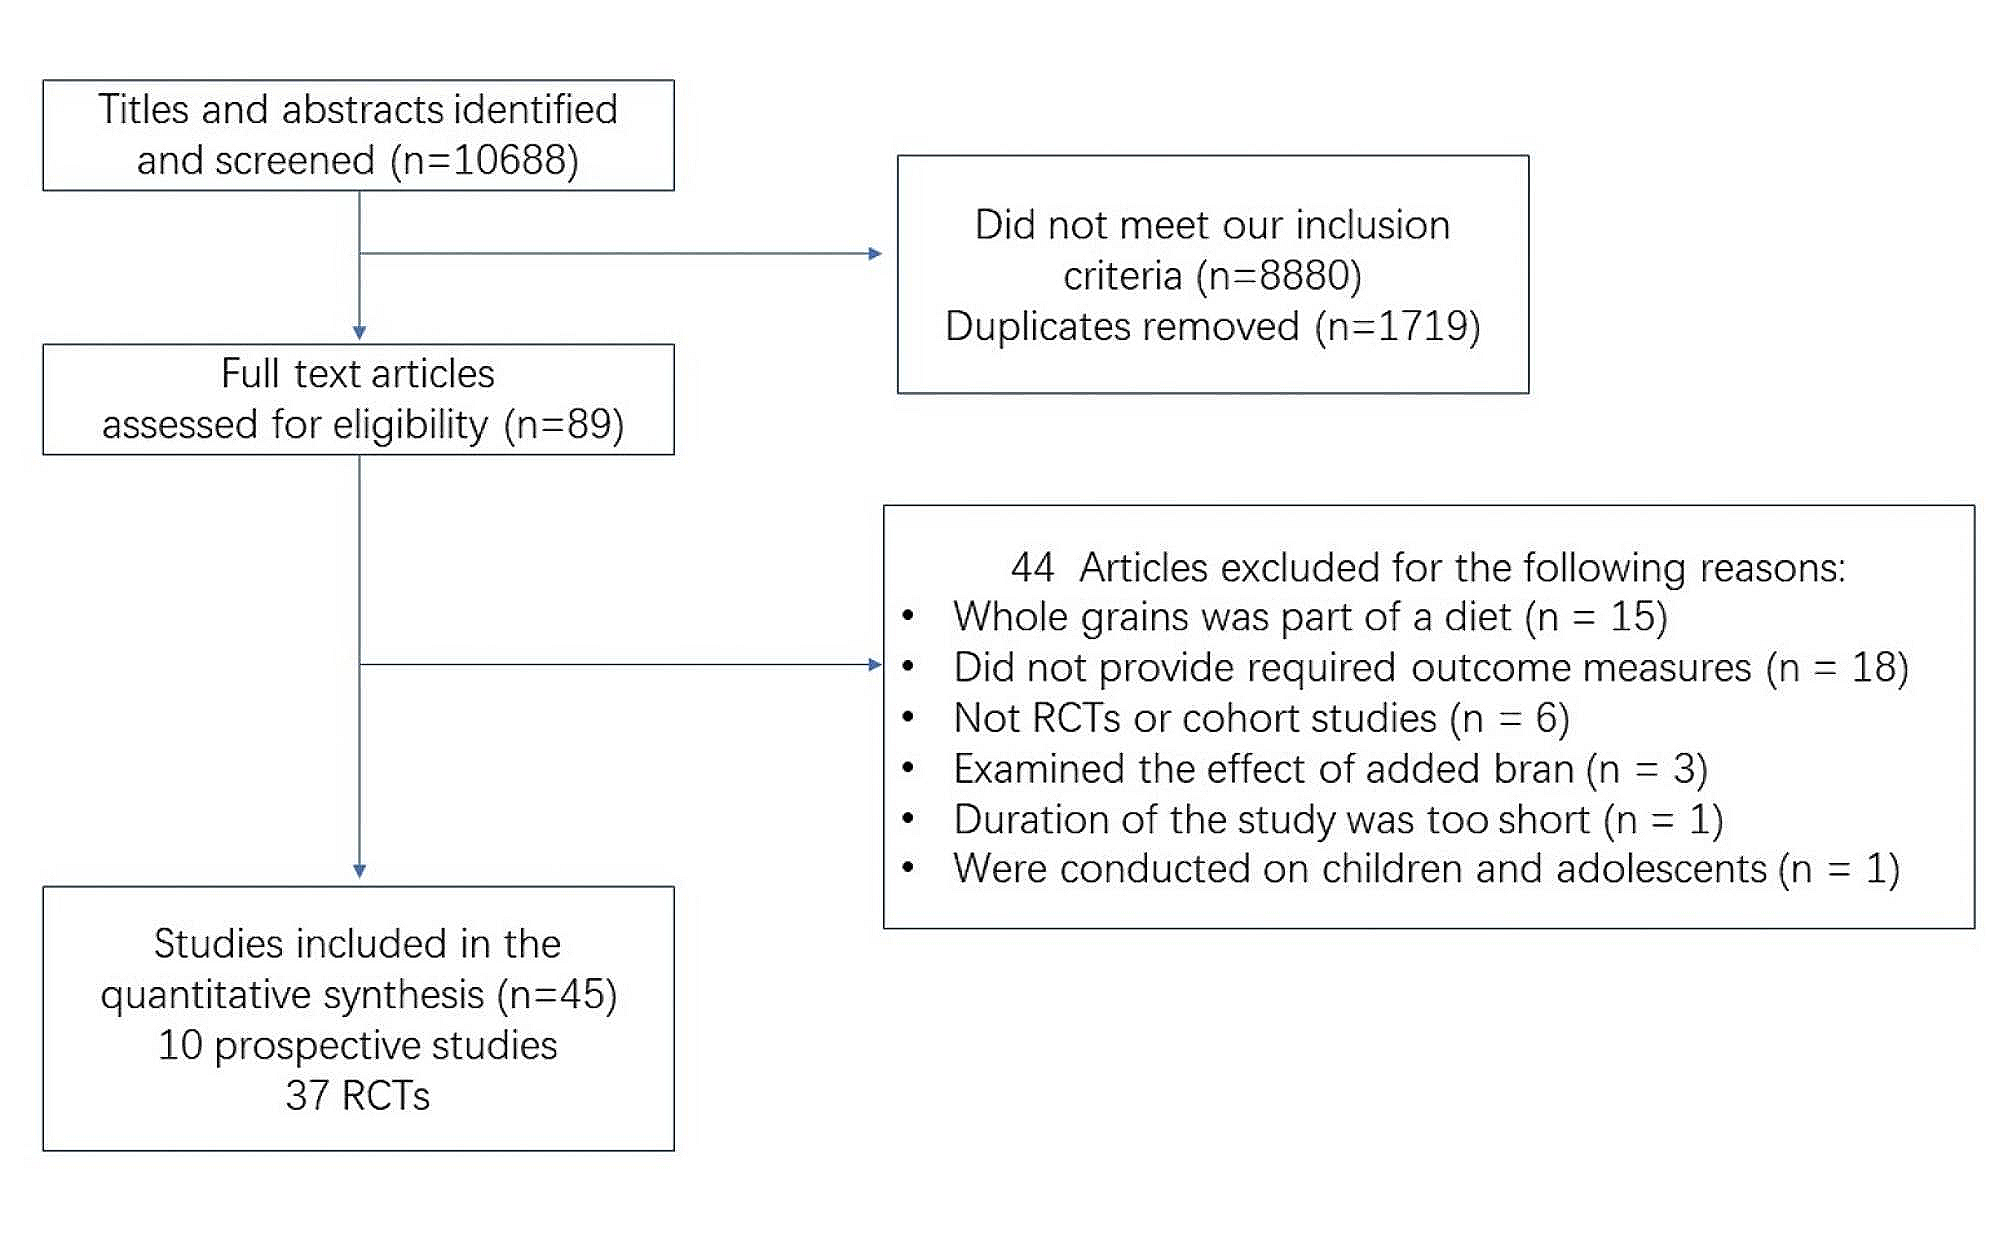
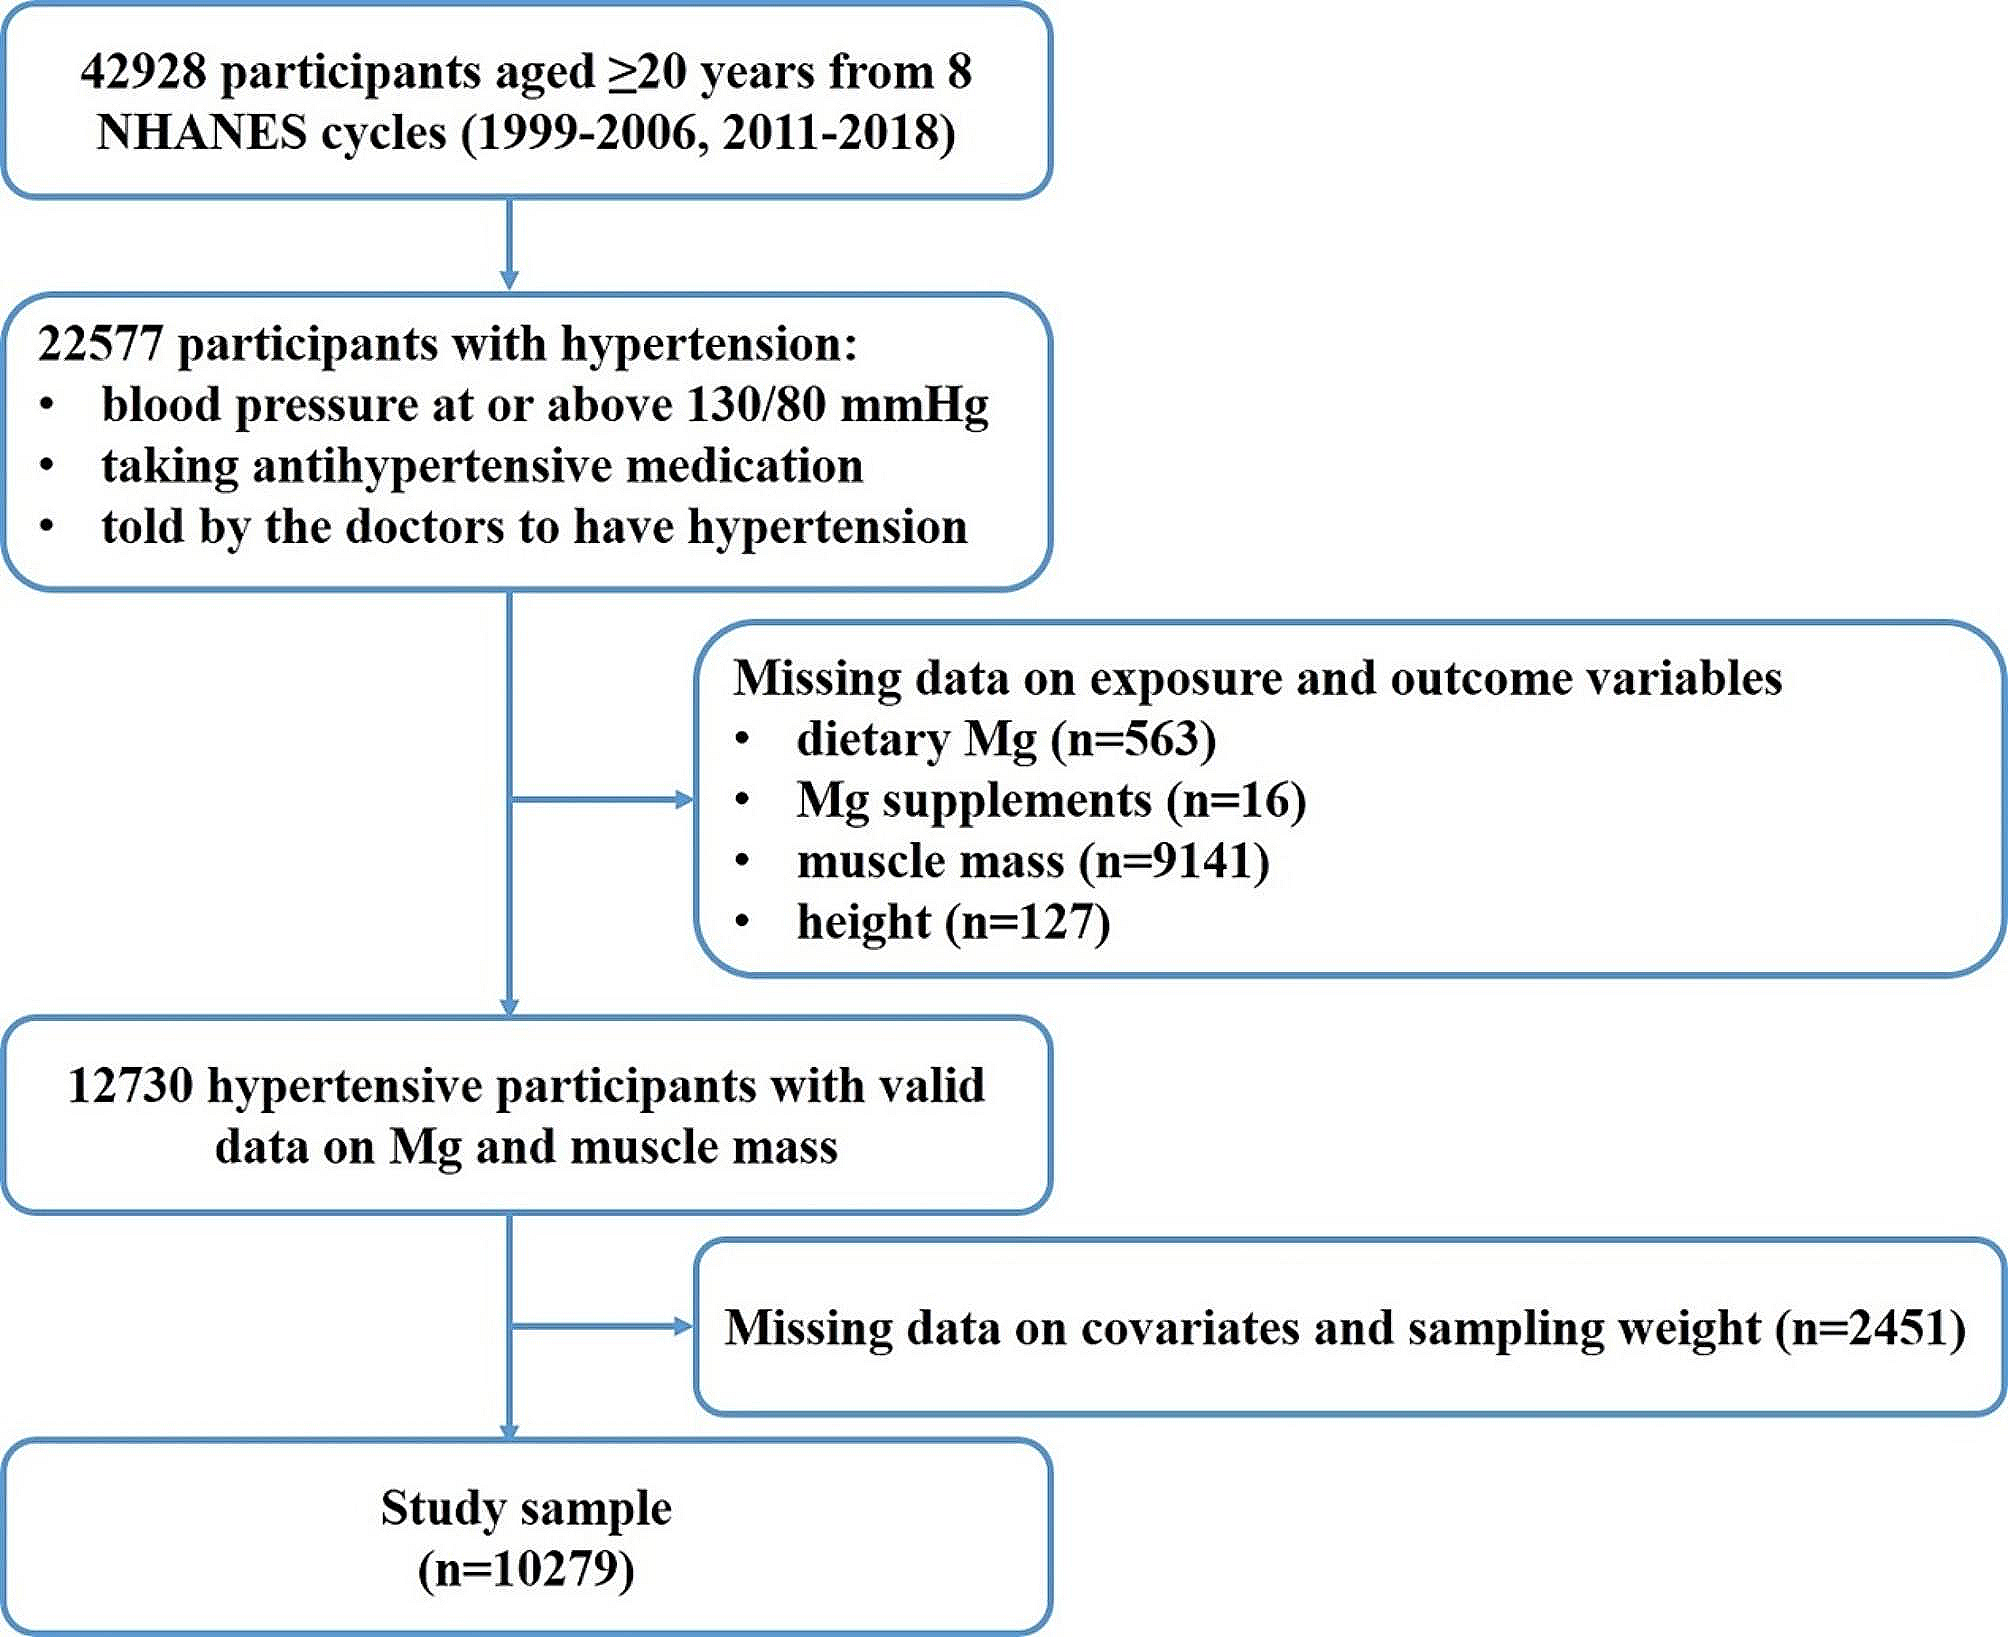
A total of 2212 participants were newly diagnosed as T2D in 2013. New-onset T2D were defined as fasting plasma glucose (FPG) ≥ 7.0 mmol/L or haemoglobin A1c (HbA1c) ≥ 6.5%, but not on any antidiabetic medications nor being diagnosed as diabetes before the physical examination in 2013. After further exclusion of participants with coronary heart disease (N = 420), stroke (N = 87), severe abnormal electrocardiogram (N = 9), or cancer (N = 108), who were lost to follow-up (N = 153), and those without sufficient blood samples for BAs measurement (N = 201), 1234 participants were eligible for final analysis [25]. The flow chart of the study population is shown in Fig. 1.
Fig. 1
The study was approved by the Ethics and Human Subject Committees of the Tongji Medical College, and all participants signed written informed consents.
Measurement of subtypes of BAsFasting blood samples were collected from consenting participants at recruitment, separated by components, and stored at -80 °C until measurement. After solvent extraction, plasma samples were detected for BAs in the multiple reaction monitoring mode on a ultraperformance liquid chromatography, coupled to tandem mass spectrometry (UPLC-MS/MS, Agilent Technologies, USA), according to the previously optimized method with minor modifications [26]. The target BAs included unconjugated primary BAs (cholate [CA] and chenodeoxycholate [CDCA]) and their amino acid conjugates (glycocholate [GCA], taurocholate [TCA], glycochenodeoxycholate [GCDCA], taurochenodeoxycholate [TCDCA]), as well as unconjugated secondary BAs (deoxycholate [DCA], lithocholate [LCA], hyocholic acid [HCA], and ursodeoxycholate [UDCA]) and conjugated secondary BAs (glycodeoxycholate [GDCA], taurodeoxycholate [TDCA], glycolithocholate [GLCA], taurolithocholic acid [TLCA], glycohyocholic acid [GHCA], taurohyocholic acid [THCA], glycoursodeoxycholate [GUDCA] and tauroursodeoxycholic acid [TUDCA]). BAs were quantified by calibration curves constructed from standards and corresponding isotopically labelled internal standards using MassHunter Workstation software (Agilent, Version B.08.00). BAs with detection rates below 80% (except for LCA) were omitted from subsequent analyses. The values below the limits of detection were imputed with the half minimum across all subjects. The intra-assay CVs ranged from 3.6 to 18.6% for all included BAs.
Assessment of the covariatesAt recruitment, the well-trained interviewers conducted face-to-face interviews with participants using a structured questionnaire and collected information on various covariates. These included age, sex, education, tobacco use, alcohol intake, physical activity and medical history. For cigarette smoking and alcohol drinking, participants were categorized as never, former and current smokers/drinkers. Participants were defined as current smokers/drinkers if they had smoked at least one cigarette a day for more than six month/had consumed alcohol at least once per week for six months or longer. Body mass index (BMI, kg/m2) was calculated via body weight in kilograms divided by square of height in meters. Regular physical activity was defined as exercise for at least 20 min per week for over half a year. Pre-existing hypertension was defined as meeting any of the following criteria: (1) self-reported physician-diagnosed cases; (2) undertaking the anti-hypertensive medications; (3) blood pressure measurements of 140/90 mm Hg or higher. In addition, plasma levels of FPG, HbA1c, triglycerides (TG), total cholesterol (TC), low-density lipoprotein cholesterol (LDL-C), and high-density lipoprotein cholesterol (HDL-C) were determined at the central laboratory of the Dongfeng Hospital following standard laboratory procedures.
Assessment of the outcomesWe evaluated two outcomes: the prevalent CKD and baseline estimated glomerular filtration rate (eGFR). Serum creatinine was determined using the sarcosine oxidase assay method by the ArchitectCi8200 automatic analyzer (ABBOTT Laboratories. Abbott Park, Illinois, USA), and the baseline eGFR was calculated using the Chronic Kidney Disease Epidemiology Collaboration equation [27]. The equation expressed as a single equation is eGFR = 141 × min(Scr/ κ, 1)α × max(Scr/ κ, 1)−1.209 × 0.993Age×1.018[if female], where Scr is serum creatinine, κ is 0.7 for females and 0.9 for males, α is -0.329 for females and − 0.411 for males, min indicates the minimum of Scr/κ or 1, and max indicates the maximum of Scr/κ or 1. In the current study, CKD was defined as eGFR < 60 ml/min per 1.73 m2.
Statistical analysisBaseline characteristics were presented as mean (standard deviation [SD]) or median (interquartile range [IQR]) for continuous variables, and n (%) for categorical variables. Differences between participants with and without CKD status were examined using Student’s t test, Mann-Whitney U test, and chi-squared test where appropriate. Data on individual subtypes of BAs were log-transformed and z-scored before analysis.
Logistic regression models were used to compute the odds ratios (ORs) and 95% confidence intervals (95% CIs) for the associations of individual BAs with odds of having CKD. In the multivariable-adjusted model, we adjusted for age (continuous, years), sex (men, women), education level (less than high school, high school, or college and above), BMI (continuous, kg/m2), smoking status (never, former, or current), alcohol intake (never, former, or current), physically active (yes or no), history of hypertension (yes or no), lipid-lowering medications (yes or no), fasting glucose (continuous, mmol/L), and plasma concentrations of triglycerides (continuous, mmol/L), LDL-C (continuous, mmol/L) and HDL-C (continuous, mmol/L). The association between BAs and eGFR was examined using the generalized linear regression model with the adjustment for potential confounders abovementioned.
We stratified the analyses by age (< 65, ≥ 65 years), sex (men, women), BMI (< 24, ≥ 24 kg/m2), smoking status (never, ever smoking), LDL-C (< 3.3, ≥ 3.3 mmol/L), HDL-C (≤ 1.5, > 1.5 mmol/L), and TG (< 1.7, ≥ 1.7 mmol/L). The interactions of circulating BAs and the stratified factors on the odds of having CKD were tested using the likelihood ratio test by including the multiplicative terms in the multivariable-adjusted models. The relationships between concentrations of BAs and the odds of CKD were also evaluated on a continuous scale using restricted cubic spline analysis. We performed several sensitivity analyses to test the robustness of our findings. First, as liver function may affect the observed associations, we further adjusted for the liver function biomarkers including alanine aminotransferase [ALT] and aspartate aminotransferase [AST]. Second, we additionally adjusted for a diet score based on intakes of vegetables, fruits, and meats [28]. Finally, we also repeated the analyses where cases of CKD were redefined as having an eGFR of less than 60 ml/min per 1.73 m², or proteinuria levels of 1 + or higher.
All analyses were performed in Stata statistical software, release 15.1 (StataCorp LP, College Station, Texas). The false discovery rate (FDR) was calculated using the B-H method to account for multiple testing, and P value < 0.05 after B-H FDR adjustment was considered as statistically significant.
留言 (0)