
記住我


This pilot study was a secondary analysis of a prospective observational cohort designed to assess microvascular reactivity in patients undergoing cardiac surgery using CPB. This analysis was planned in the protocol of the original prospective observational cohort study MONS (microcirculation in cardiac surgery). The latter was approved by the institutional review board of Ile de France 1 (CPP IDF1, Paris, France) on October 10, 2018 (Ethics Committee No. 2018-A2341-54) and registered at ClinicalTrials.gov (NCT03631797). A signed informed consent was obtained from each patient. This paper adheres to the applicable STROBE guidelines.
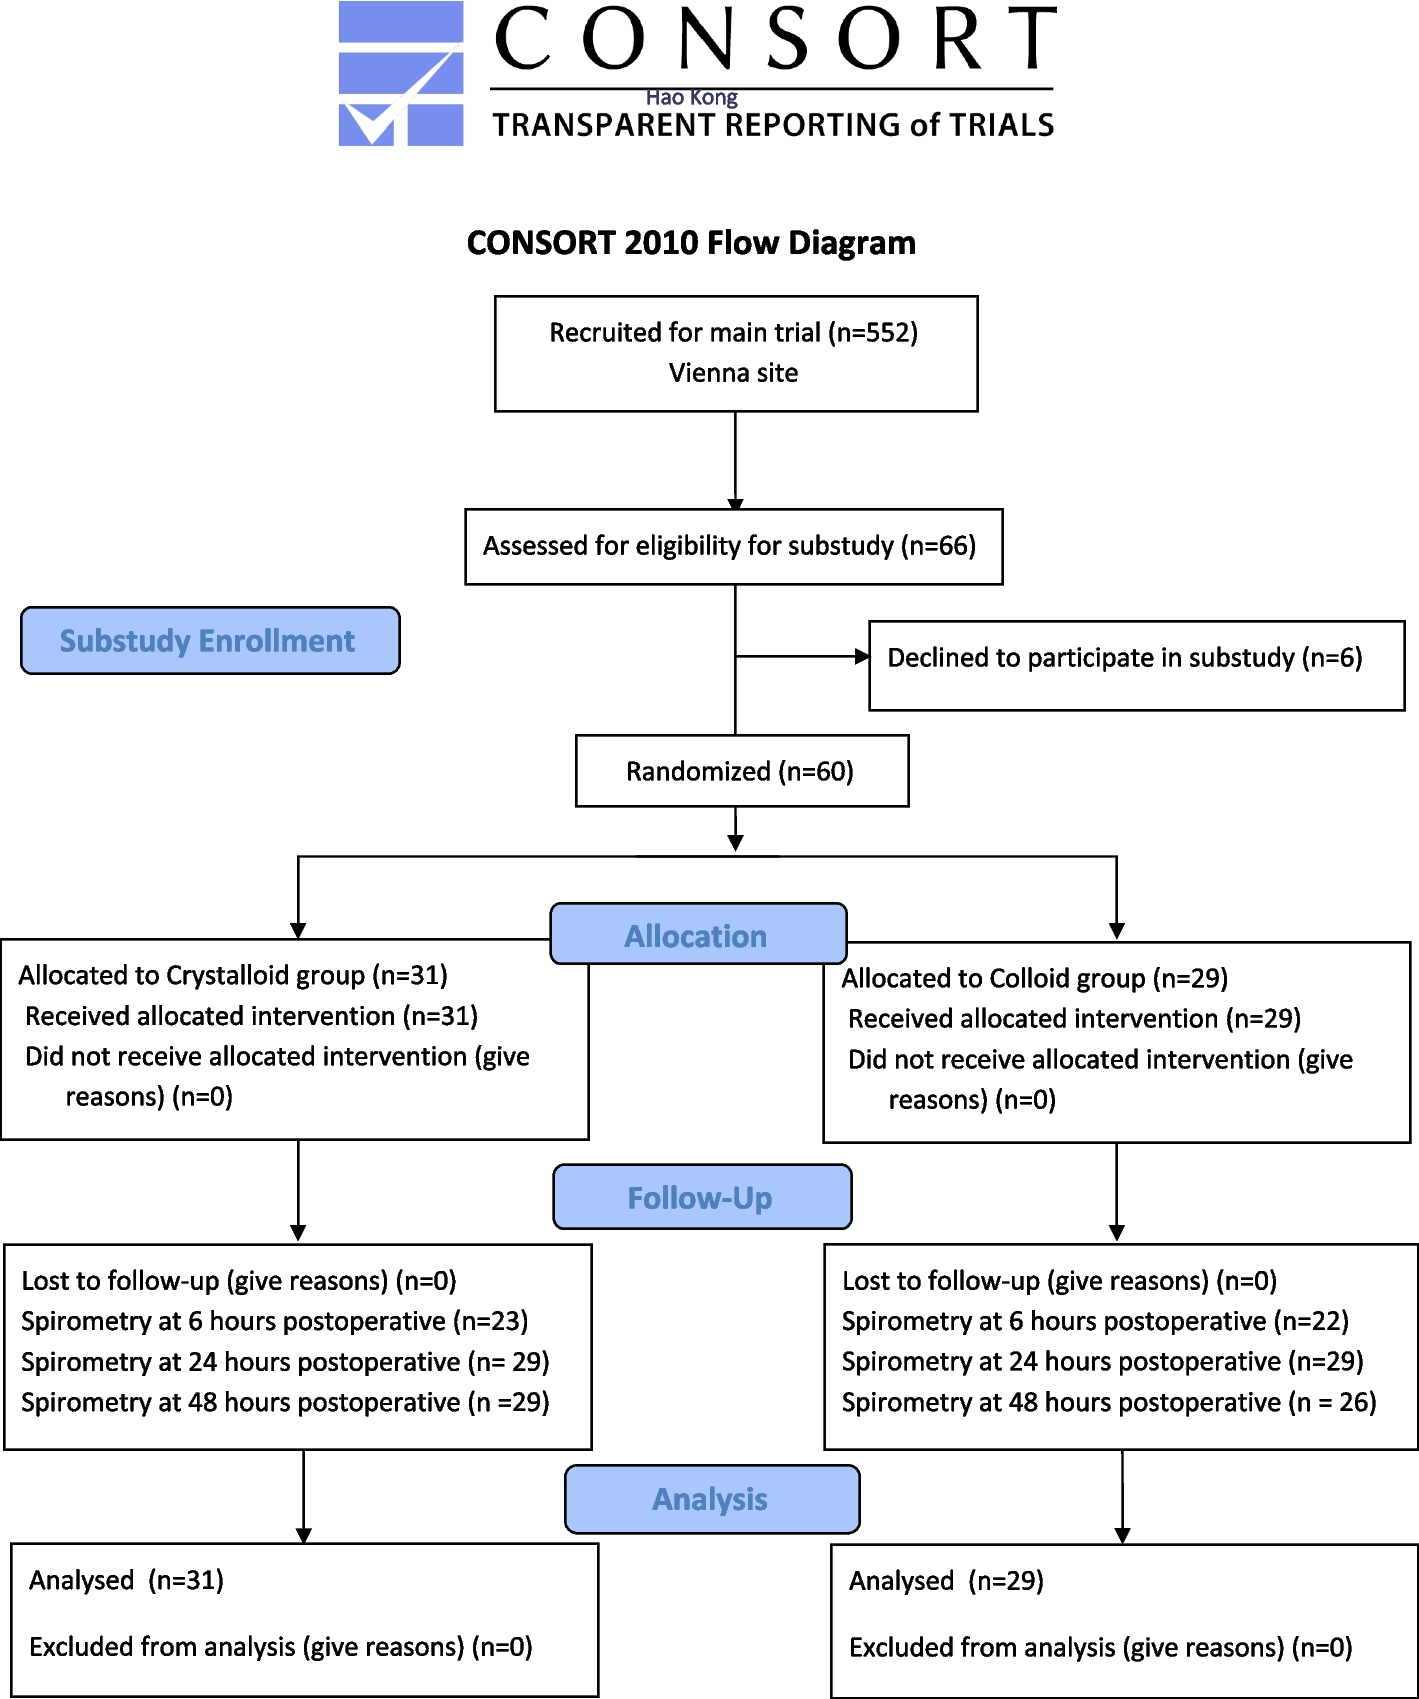
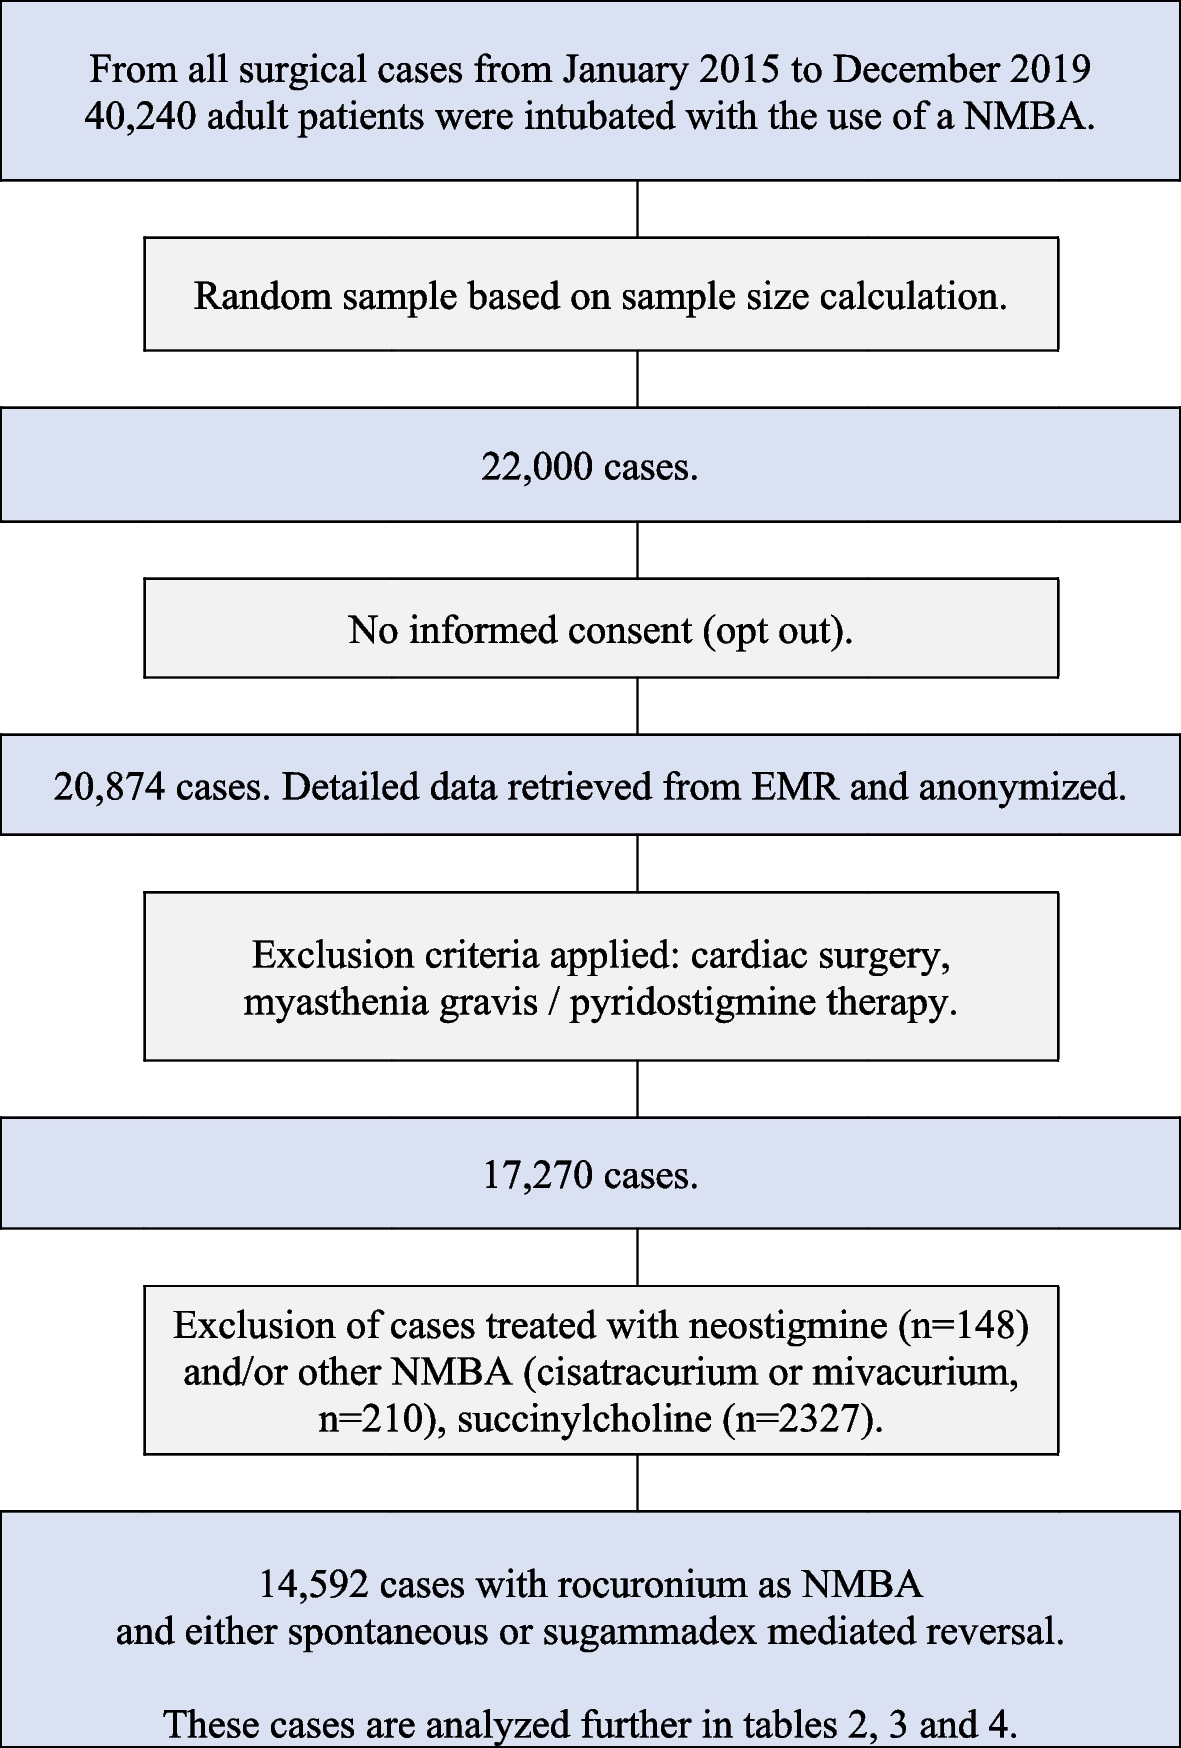
Participants and settingThe MONS cohort enrolled 60 patients scheduled for elective valvular or coronary cardiac surgery using CPB at a French university hospital from January 2019 to April 2019. Patients with emergency surgery, combined surgery (valve surgery and coronary artery bypass grafting), dark skin (laser speckle is not yet validated in this population), delirium, or cognitive dysfunction before surgery were not included in the MONS cohort (Fig. 1).
Fig. 1
Study flow chart. AKI, acute kidney injury; LTH, local thermal hyperemia
VariablesPerioperative data were obtained from the database: preoperative characteristics, EuroSCORE II to assess risk in cardiac surgery (Nashef et al. 2012), Cleveland Clinic Score for AKI to assess risk of dialysis during the postoperative period in cardiac surgery (Thakar et al. 2005), medical and surgical history, intraoperative use of vasoactive drugs, operative time, CPB, and aortic clamping times. Preoperative creatinine clearance was calculated at hospital admission prior to the surgery. Postoperative data included postoperative organ functions, duration of vasopressor use, ICU, and hospital length of stay.
To date, there is no consensus definition for cardiac surgery–associated AKI, but the KDIGO criteria for AKI are widely used in clinical practice (Wang and Bellomo 2017). The primary endpoint was the occurrence of AKI according to the KDIGO classification during the postoperative hospital stay (AKI definition 2012). Postoperative serum creatinine course and urine output, measured prospectively in all patients, were used to correctly classify patient status. Secondary endpoints were the duration of vasopressor use and the length of ICU and hospital stay.
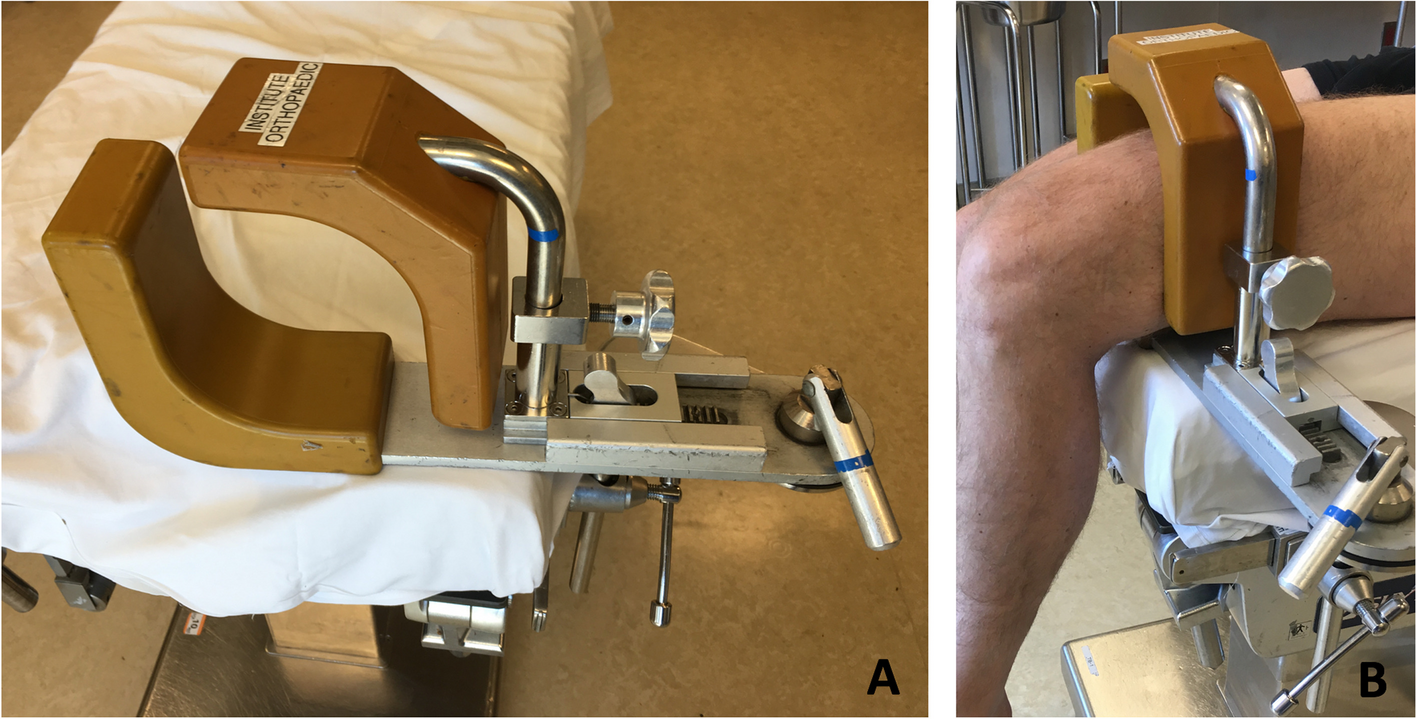
Data sources and measurementFunctional microcirculatory reserve was evaluated for each patient, during the preoperative consultation, before anesthesia and surgery, as previously described (Abrard et al. 2021, Abrard et al. 2019). All patients were hemodynamically stable, in their basal state, without catecholamine support, and on their usual medications. Briefly, a laser speckle contrast imaging (LSCI; PeriCam PSI NR, Perimed, Järfälla, Sweden) was placed over the forearm of patients to noninvasively measure the relative changes in skin microvascular perfusion (laser speckle perfusion units, LSPU = 10 mV) during iontophoresis of ACh and sulfate nitroprusside (SNP) to assess endothelial-dependent and endothelial-independent vasoreactivities (Fig. 2A) (Roustit and Cracowski 2013, Roustit and Cracowski 2012). To that end, 200 µl of ACh 2% and 200 µl of SNP 1% (Sigma-Aldrich, St. Louis, MO, USA) were delivered through two small imbibed electrodes placed on the skin (electrodes LI 611; 3 M, Maplewood, USA), to which the application of monopolar direct current by a PeriIont generator (Perimed, Järfälla, Sweden) was programmed to deliver a 2 mC current (0.10 mA for 20 s). The microvascular response flow curves were recorded during 5 min at a frequency of 16 Hz and a resolution of 100 µm/pixel using an acquisition system (PIM Soft; Perimed, Järfälla, Sweden). Recorded variables were the peak amplitude (peak–baseline amplitude), the area under the curve (AUC) within 3 min of the microvascular flux, and the time to reach the peak (Fig. 2B). A Comfeel®/aluminum bilayer patch was used as control. The final filtered signal was obtained by subtracting movement artifacts recorded on the region of interest (Omarjee et al. 2015).
Fig. 2
Measurement of cutaneous microcirculation. A Cutaneous blood perfusion imager. Incident lights from the laser (thick red arrows) are scattered back (dotted arrows) from red blood cells flowing in the microvessels. B Typical dose–response vasodilatation to iontophoresis after definition of a region of interest. Recorded variables are figured by dotted arrows (peak–baseline amplitude and time-to-peak)
Local heating of the skin induces a microvascular response known as local thermal hyperemia (LTH), which is useful in the evaluation of systemic microvascular endothelial function (Roustit and Cracowski 2012). This method is currently used to evaluate microvascular reactivity in several clinical settings such as diabetes, advanced age, and chronic kidney disease. After measuring the resting microvascular flow for 3 min using a heating laser probe (PF 5001; Perimed, Järfälla, Sweden) placed on the forearm’s skin, the endothelium-dependent vasodilation of skin microcirculation was recorded using LSCI during prolonged (20 min) local heating of the probe to 44.0 °C. The microvascular response to local heating is biphasic. Recorded variables were the first peak amplitude (peak–baseline amplitude) related to axon reflex-dependent vasodilation, the time to reach the first peak, and the plateau amplitude (plateau–baseline amplitude) related to NO-dependent vasodilation.
BiasTo reduce interpatient variability, the patient course was standardized as previously described (Abrard et al. 2021). Briefly, anesthesia was induced with intravenous propofol, sufentanil, and atracurium. Maintenance was performed using sufentanil and inhaled sevoflurane during the non-bypass period and sufentanil and propofol during CPB. Infusion of an antifibrinolytic agent was systematically performed to reduce the bleeding in the intraoperative period (tranexamic acid administered intravenously for 60 to 120 min after the surgical incision, 50 mg/kg or 100 mg/kg for patients with dual antiplatelet therapy). The mean arterial blood pressure during the CPB and non-CPB periods was controlled by norepinephrine infusion with objectives between 65 and 75 mmHg. Heparin-coated CPB circuits (Carmeda; Medtronic, Minneapolis, MN, USA) or phosphorylcholine-coated CPB circuits (Phisio; LivaNova, Mirandola, Italy) were used with a membrane oxygenator and a cardiotomy reservoir. CPB was performed under normothermia (> 36 °C) using a roller pump (Cobe, Lakewood, CO, USA) maintaining a flow rate of 2.4 l/min/m2. The volume CPB priming (a mixture of Ringer’s solution and gelatin at 2:1 ratio) was reduced to a minimum using the retrograde autologous priming technique. Myocardial protection was maintained by cold blood antegrade/retrograde cardioplegia (4:1 blood cardioplegia with Plegisol solution (Hospira, Paris, France)). Anticoagulation was carefully monitored using heparin titration curves (Hepcon Heparin Management System, HMS Plus; Medtronic, Minneapolis, MN, USA) with a target-activated clotting time of 250 s for coronary arterial bypass grafting (CABG) and 350 s for valvular surgery. The protamine reversal dose was determined after titration by the Hepcon Heparin Management System (Baufreton et al. 2002).
Routine postoperative anticoagulation management was performed as previously described (Abrard et al. 2021). All patients were equipped with an invasive blood pressure sensor, which was removed the day after catecholamine weaning. Patients undergoing valve surgery or bypass surgery with altered left ventricular ejection fraction were equipped with a Swan-Ganz catheter, which was maintained for 48 h. Other patients were equipped of a central jugular venous catheter. Echocardiography was performed daily, and more frequently in cases of clinical instability. Intravenous fluid therapy using 750 ml of dextrose 5% solution per day was administered until the oral route was resumed. Isotonic fluid expansion and/or diuretics were administered after evaluation of volemia according to standard clinical, laboratory, or ultrasonographic criteria. All patients had diuresis monitoring by urinary catheter for at least the first postoperative 48 h. The results from the microcirculation evaluation were kept secret from the surgical and intensive care teams and did not change patient management.
StatisticsQuantitative data are expressed as median and interquartile range (IQR) and compared using the Mann–Whitney U test and the Kruskal–Wallis test as indicated. Qualitative data are described using numbers and percentages and compared using Fisher’s exact test. No data were available to predict the difference in preoperative microvascular reactivity according to postoperative outcome. Sixty patients were included in the MONS study because this was the estimated capacity of inclusion within the planned study duration.
For the primary endpoint, patients were divided into two groups according to the occurrence of in-hospital postoperative AKI (≥ KDIGO 1) or not. Their microcirculatory flows measured during iontophoresis were compared according to three variables (peak amplitude, time to reach the peak, and AUC at 3 min) using the Mann–Whitney U test. To predict postoperative AKI, receiver operating characteristics (ROC) curves were built to explain the occurrence of postoperative AKI with microcirculation as the explanatory variable. A cut-off value was selected from the point in the ROC curve that was the closest to the top left corner of the graph (i.e., the best compromise between specificity and sensitivity).
A multivariable model was constructed to investigate the utility of microcirculatory measurements in predicting the occurrence of the primary outcome. The multivariable model assessed the occurrence of postoperative AKI by significant variables of iontophoresis and potential preoperative confounding variables that differed significantly between patients with and without an event (unadjusted p < 0.15). The absence of collinearity between variables was checked using the correlation matrix (r < 0.400) and variance inflation factor < 5. Each selected variable was then entered into a logistic regression model. A backward conditional elimination method was used (cut-off for variable suppression p > 0.10). Variables were retained in the model if their suppression resulted in a significant change in the model (p < 0.05). The AUC of the ROC curve (AUROC) explaining the occurrence of postoperative AKI by the Cleveland Clinic Score to predict the primary endpoint was calculated as reference. The accuracy of our model was compared with the Cleveland Clinic Score.
A p value < 0.05 was considered statistically significant. Statistical analyses were performed using SPSS (IBM, Chicago, IL, USA). We did not use an imputation method for missing data. The value of 28 days was assigned for length of stay for patients who died in hospital. The same 28-day value was applied for vasopressor use duration if the patient died before vasopressor weaning.
留言 (0)