
記住我


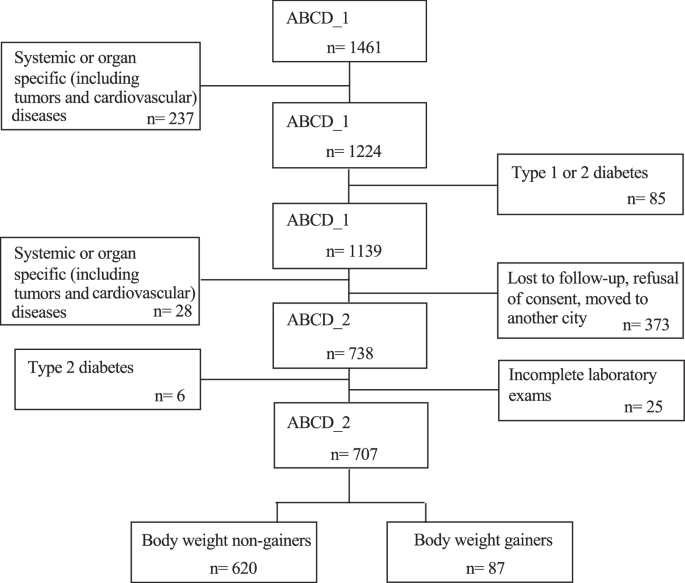


In the preliminary search, 853 studies were identified. We identified 10 articles reporting on 8 RCTs that involved a total of 300 participants (154 in the intervention group and 146 in the control group) as eligible for meta-analysis [31,32,33,34,35,36,37,38,39,40]. Further details regarding the selection process are provided in the PRISMA flow diagram in Fig. 1.
Fig. 1
Literature screening process.
Table 1 presents the general characteristics of the included studies, which were published between 2003 and 2021. These studies were parallel-design, single-centre trials conducted in the United States [32, 37], Australia [33, 34], Brazil [31], Iran [35, 36, 38], and China [38, 39]. All studies included women with overweight and obesity (BMI ≥ 24 kg/m2), except one [31] recruited patients without BMI limitations. The participants of the Toscani study [31] were aged between 14–35, whereas those in other studies were between 18–45 years old. All participants received a diagnosis of PCOS based on the criteria of the National Institutes of Health (NIH) [32,33,34,35, 37], Rotterdam consensus [36,37,38], or Androgen Excess and Polycystic Ovary Syndrome (AE-PCOS) [31], with one participant not receiving a diagnosis [40]. The intervention duration ranged from 4–16 weeks. All studies focused on HPDs as an exposure factor and compared the effects of HPDs and isocaloric BDs. Three studies used protein powder as a protein administration method for the HPD intervention group [36, 38, 39], whereas the other studies used a high-protein dietary pattern as an intervention measure.
Table 1 Summary of the studies included in our analysis.Meta-analysis resultsAnthropometrics WeightAccording to data pooled from seven of the eligible studies [31,32,33, 35, 37,38,39], HPDs did not significantly reduce body weight when compared with BDs (−0.78 kg, 95% CI [−1.69, 0.13], P = 0.06; Fig. 2A). The degree of heterogeneity was high (I2 = 82%). Removing any of the seven studies did not cause the I2 to decrease to below 50%.
Fig. 2: Effects of HPDs on anthropometrics in women with PCOS.
A Weight/Forest plots of the effect of HPDs on weight. B Body mass index/Forest plots of the effect of HPDs on BMI. C Waist-to-hip ration/Forest plots of the effect of HPDs on WHR. D Waist circumference/Forest plots of the effect of HPDs on WC.
When conducting subgroup analysis by country, after a Chinese study was excluded [39], no significant changes were observed in the results (−0.83 kg, 95% CI [−1.75, 0.09], P = 0.08, I2 = 86%). According to the subgroup analysis results for intervention duration, HPDs were not superior to BDs in terms of leading to weight loss when they were implemented as short-term (<12 weeks) [31, 32, 37, 39] or long-term (≥12 weeks) [33, 35, 38] interventions (P = 0.42 and 0.09, respectively), with high heterogeneity noted in the subgroups (82% and 77%). In addition, according to the subgroup analysis results for ethnicity, HPDs and BDs had similar effects (P = 0.07 and 0.65, respectively; Supplementary Table 3).
BMIAccording to data pooled from five eligible studies [33, 37,38,39,40], when compared with BDs, HPDs did not significantly reduce BMI (−0.81 kg/m2, 95% CI [−1.69, 0.07], P = 0.07; Fig. 2B). The degree of heterogeneity was high (I2 = 83%). After the study by Nadjarzadeh et al. [38] was excluded, sensitivity analysis revealed a change in the overall effect size (−1.36, 95% CI [−1.63, −1.08], P < 0.0001, I2 = 0).
After the two Chinese studies [39, 40] were excluded, no significant changes were observed in the results (−0.42 kg/m2, 95% CI [−2.06, 1.21], P = 0.61, I2 = 89%). In terms of intervention duration, HPDs did not significantly reduce BMI when implemented as long-term interventions (−0.58 kg/m2, 95% CI [−2.55, 1.38], P = 0.56, I2 = 90%) [33, 38, 40]. According to the subgroup analysis results for ethnicity, HPDs and BDs had similar effects on Asian populations (P = 0.47, Supplementary Table 3).
Abdominal obesityThree studies [32, 38, 40] reported a change in WHR (−0.02, 95% CI [−0.04, 0.01], P = 0.16, I2 = 0%; Fig. 2C). Similarly, three studies [31, 32, 38] reported a change in WC (−2.56 cm, 95% CI [−5.91, 0.79], P = 0.13, I2 = 0%; Fig. 2D). These results indicate that both interventions similarly reduced WC and WHR. However, because the number of studies reporting such data was limited, no subgroup analysis was conducted.
Glucoregulatory indicators FINSAccording to data pooled from seven eligible studies [31, 33, 35,36,37, 39, 40], when compared with BDs, HPDs significantly reduced concentrations of FINS (−2.69 mIU/mL, 95% CI [−3.81, −1.57], P < 0.00001, I2 = 46%; Fig. 3A). Removing any of these studies did not decrease the I2 to be <50%. After the two Chinese studies [39, 40] were excluded, no significant changes were observed in the results (−2.41 mIU/mL, 95% CI [−3.6, −1.21], P < 0.0001, I2 = 54%).
Fig. 3: Effects of HPDs on glucoregulatory indicators in women with PCOS.
A Fasting insulin/Forest plots of the effect of HPDs on FINS. B Fasting glucose/Forest plots of the effect of HPDs on fasting glucose. C Homoeostatic model assessment-insulin resistance/Forest plots of the effect of HPDs on HOMA-IR.
In the long-term studies (≥12 weeks) [33, 35, 36, 40], the concentrations of FINS were significantly lower in the HPD group than in the BD group (−3.04 mIU/mL, 95% CI [−4.56, −1.51], P < 0.0001, I2 = 56%). However, in the short-term studies [31, 37, 39], HPDs and BDs had similar effects (−2.58, 95% CI [−5.66, 0.51], P = 0.1, I2 = 55%). In the studies focusing on FINS levels, with the exception of the study by Toscani et al. [31], all participants were women with overweight or obesity. According to the pooled data on the women with PCOS in these studies, the concentration of FINS significantly decreased after HPD interventions (−2.86 mIU/mL, 95% CI [−4.17, −1.54], P < 0.0001, I2 = 59%). The results of the subgroup analysis were consistent between the studies involving Asian populations and studies involving European and American populations, with these groups having effect sizes of −2.88 mIU/mL (95% CI [−5.02, −0.73), P = 0.009) and −2.49 mIU/mL (95% CI [−4.73, −0.24], P = 0.003), respectively (Supplementary Table 3).
FPGSix studies [31, 34, 36, 37, 39, 40] reported changes in FPG levels before and after the intervention. Pooled analysis revealed a significantly higher concentration of FPG (2.33 mg/dL, 95% CI [0.63, 4.03], P = 0.007, I2 = 10%) in the HPD group than in the BD group (Fig. 3B). After the two Chinese studies [39, 40] were excluded, no significant changes were observed in the results [2.68 mg/dL, 95% CI [0.93, 4.43], P = 0.003, I2 = 0%]. In terms of intervention duration, subgroup analysis revealed that compared with BDs, HPDs were associated with higher concentrations of FPG (3.19 mg/dL, 95% CI [0.97, 5.42], P = 0.005, I2 = 0%) in short-term studies [31, 37, 39]. However, in long-term studies (≥12 weeks) [34, 36, 40], HPDs and BDs had similar effects on the concentrations of FPG [0.39 mg/dL, 95% CI [−5.39, 6.17], P = 0.89, I2 = 47%]. These results indicate that HPD interventions lasting 8 weeks or less may be associated with higher concentrations of FPG than those associated with BD interventions lasting 8 weeks or less. However, for interventions lasting 12 weeks or more, HPDs and BDs have similar effects (Supplementary Table 3).
According to the subgroup analysis results for ethnicity, HPDs significantly increased the concentrations of FPG among European and American populations (2.92 mg/dL, 95% CI [1.12, 4.72], P = 0.001, I2 = 0%) but not among Asian populations (−2.54 mg/dL, 95% CI [−7.72, 2.64], P = 0.34, I2 = 0%).
HOMA-IRAccording to data pooled from six eligible studies [
留言 (0)