
記住我

The salt and acidity values analyzed during the ripening period in traditional white cheese samples are visualized in Fig. 1. The percentage salt levels of the cheese samples were determined to be 2.88 ± 0.72%, 4.16 ± 0.84%, 5.13 ± 1.46%, and 5.51 ± 1.22% at days 1, 15, 30, and 90 of the ripening period, respectively. Similar to the salt levels of the cheese samples, there was an increase in the acidity of samples during the ripening period. Similar to the findings of this study, Uğur and Öner (2018) reported the average salt content of white cheese samples to be 4.29% and 5.59% at days 1 and 90 of the ripening period, respectively. Total titratable acidity (g lactic acid per 100 g cheese) of the samples was found to be 0.38 ± 0.18%, 0.43 ± 0.09%, 0.34 ± 0.14%, and 0.66 ± 0.14% at days 1, 15, 30, and 90 of the ripening period, respectively. However, the findings of the present study were similar to the previous findings reported for the white cheese samples collected from different regions. Hayaloglu et al. (2002) reported the titratable acidity of pickled white cheese samples to be between 0.37 and 3.80%. Çakmakçı and Kurt (1993) determined the titration acidity of fresh white cheese samples to be 0.37% and that of ripened ones to be 0.76% in their study. While the titration acidity of the cheese samples was lower on the first day, the acidity increased by the end of the ripening period. Fluctuations in titratable acidity in the later stages of ripening were caused by the formation of alkaline substances in the medium due to proteolysis during ripening and the change in dry matter (Öner and Sarıdağ 2019). It is thought that the lipolysis process, that is, the resulting fatty acid composition, also has an effect on the increase in acidity that occurs after the 90th day. Dağdemir et al. (2003) and Hayaloglu et al. (2005) also obtained similar phenomenon to our study.
Fig. 1
The salt and acidity levels of white cheese samples expressed as a percentage at day 90 of the ripening period
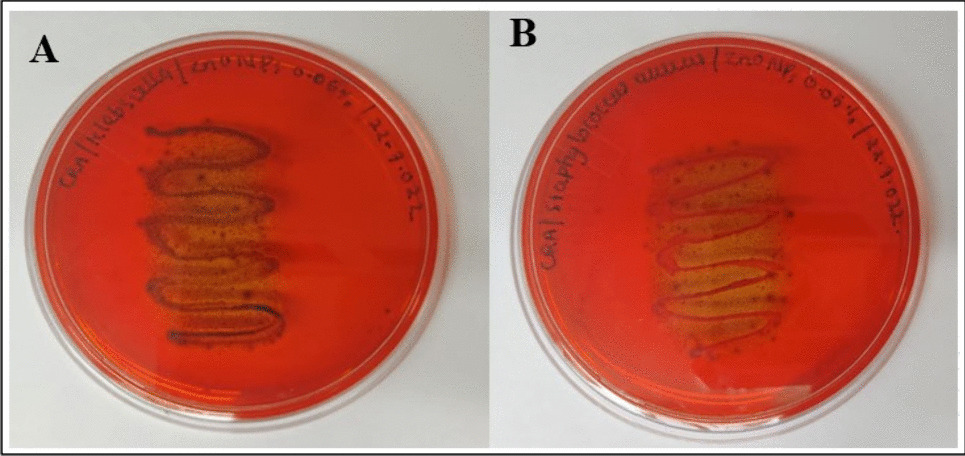
Microbiological characteristics of cheese samplesThe total contamination level given in CFU per gram cheese of E. coli, Enterobacteriaceae, Staphylococcus spp., S. aureus, and mold-yeast was determined four times during the 90-day ripening period. All results are displayed in Table 1. At the beginning of the ripening period, a total of 6 of 14 cheese samples demonstrated E. coli numbers of 2–4.6 log CFU/g, while only 1 cheese sample was positive at the end of the ripening period (day 90). The initial high level of E. coli in cheese samples at the beginning of ripening might be a result of fecal contamination and an insufficient heating process (Beuchat and Ryu 1997). According to the Turkish Food Codex (Codex 2011), the maximum E. coli numbers in white cheese should be 102 CFU/g. One cheese sample in this study was therefore unsuitable in terms of E. coli numbers. The cheese samples were also tested for the presence of Enterobacteriaceae, and counts of Enterobacteriaceae were observed between 3.5 and 6.4 log CFU/g at the first day of the ripening period (day 1). At the end of the ripening period, the lowest and highest Enterobacteriaceae numbers were 1.2 and 5.1 log CFU/g, respectively. As an indicator of the Enterobacteriaceae microbial group, high numbers might reveal poor hygiene and sanitation conditions as well as fecal contamination (Yücel and Ulusoy 2006).
Table 1 Numbers of Escherichia (E.) coli, Enterobacteriaceae, Staphylococcus, Staphylococcus (S.) aureus, and mold/yeast in traditional Kırklareli white brined cheese samples from 14 different cheese manufacturing facilities during the 90-day ripening periodThe testing of Staphylococcus spp. and S. aureus numbers during the first day of the ripening period showed counts between 4.2 and 7.2 log CFU/g, and an approximate decrease of 1.5 log level CFU/g was observed in staphylococcus numbers at day 90. For S. aureus, eight samples tested negative, and in six cheese samples, S. aureus was observed with a contamination level of 3.3–5.1 log CFU/g. At the end of the ripening period, in three cheese samples, S. aureus was still observed (2.0–3.4 log CFU/g). The cell count in these was higher than the allowed detection limits of S. aureus according to the Turkish Food Codex (Codex 2011). Previously, higher numbers of coagulase positive S. aureus were reported from different regions in traditional cheese samples (Rola et al. 2016; Saka and Terzi Gulel 2018). Therefore, more attention should be paid to the milk quality by practicing more hygiene to avoid the occurrence of possible problems associated with these traditional cheese samples. Producers can select longer ripening periods recognized in the industry, such as 6 months and 1 year, as previously discussed (Öner et al. 2006).
The yeast and mold numbers in cheese samples were observed to be between 2.1–5.9 log CFU/g and 1.2–6.2 log CFU/g at days 1 and 90, respectively. These numbers were similar to previous observations (Macedo et al. 1995; Öner et al. 2006), and in general, no decrease in the yeast and mold counts during the ripening period was observed, which was in agreement with previous findings (Öner et al. 2006). The non-inhibition of the yeasts and molds in white cheese samples was associated with their potential to metabolize lactic acid, and they might also contribute to the ripening of cheese (Macedo et al. 1995). Nonetheless, in terms of white cheese, these high numbers of cells are not acceptable according to the Turkish Food Codex (Codex 2011).
Identification of LAB and nsLABDuring the time of ripening, a slightly increase in the count of the LAB was observed. At the first sampling time, a mean count of 7 log CFU/g for Lactobacillus spp. and 9 log CFU/g for Lactococcus spp. was obtained. Further into the ripening phase, the numbers increased slightly and the highest counts of all microbial groups (> 10 log CFU/g) were reached at 90 days of ripening (Fig. 2). Our result was also in accordance with previous studies (Öner et al. 2006; Dertli et al. 2012). The numbers on the two different media (M17 and MRS agar) at the same sampling time were generally similar. After selecting the colonies according to phenotypic characteristics on both agars M17 and MRS, a total of 375 isolates (three to five isolates for each phenotype) were obtained from the different cheese samples during different ripening periods. We selected one isolate for each typical phenotype for further cultural characterization. Additionally, we selected a total of 51 isolates (one isolate for each typical phenotype) for further phenotypic identification (Table 2). The genotypic identification of the selected isolates (n = 32) by sequence analysis of the 16S rRNA gene revealed the presence of eight Lactococcus (Lc.) lactis, two Latilactobacillus (Lt.) curvatus and each one isolate of Lactobacillus (Lb.) casei and Lb. plantarum, eight Enterococcus (E.) durans, four E. faecalis, one E. faecium, five Streptococcus (St.) macedonicus, and one Weissella (W.) paramesenteroides, collected from traditional white cheese samples. Figure 3 demonstrates the MEGA X alignments of the 16S rRNA partial gene sequences of selected distinct LAB isolates (n = 32). This reveals their phylogenetic relationship, which resulted in the formation of different subgroups according to their species identification.
Fig. 2
Number of lactococci and lactobacilli in white cheese samples during the ripening period
Table 2 Acidification capacities and proteolytic activity of selected isolates (n = 51) obtained from different ripening time of white cheese samplesFig. 3
Dendrogram showing clustering of white cheese nsLAB/LAB isolates (n = 32) based on sequences of their 16S rRNA gene tested by neighbor-joining method
So far, several LAB species, especially enterococci, were reported to be present in the natural microflora of white cheese samples (Hayaloglu et al. 2002; İspirli et al. 2017; Uymaz et al. 2019). Importantly, all isolates of enterococci obtained in this study were still present in white cheese samples at day 90 of the ripening period. These observations indicate that enterococci may play a role as nsLAB in Kırklareli white cheese. Similar to our findings, it has been previously reported that E. durans and E. faecalis were dominant species in Turkish white cheese (İspirli et al. 2017). Another species isolated in the present study was St. macedonicus, and previous studies reported the presence of this species in different cheeses including Turkish white cheese (Lombardi et al. 2004; Ozteber and Başbülbül 2017; Uymaz et al. 2019). St. macedonicus was suggested to play a role in the formation of the characteristic flavor of some cheese types (Gobbetti et al. 2015) as a potential nsLAB. It should be noted that unlike previous findings, a lower level of St. macedonicus was present in Turkish white cheese, indicating that this bacteria may also be present in moderate amounts in Turkish white cheese (Uymaz et al. 2019). Compared to the enterococci isolates, St. macedonicus was present in the white cheese samples up until day 15 of ripening, which was also the case for the isolate W. paramesenteroides #11–15-A. Previous reports also confirmed the presence of Weissella species in several cheeses, including Ezine cheese (Gerasi et al. 2003; Uymaz et al. 2019).
Furthermore, within important LAB species for cheese manufacturing as starter cultures, eight isolates of Lc. lactis, two isolates of Lt. curvatus, and each one isolate of Lb. plantarum and Lb. casei were obtained from the different samples in the present study. Similar to our findings, it has been previously reported that these species were dominant starter cultures in Turkish white cheese (Ertürkmen and Öner 2015; İspirli et al. 2017). Two distinct isolates of Lt. curvatus (#12–30-B and #8–30-D) were isolated. Previously, Lt. curvatus as nsLAB and supplementary culture (Gobbetti et al. 2015) have been shown to be present in the microflora of different cheese types as well as other dairy products (Antonsson et al. 2003; Ozteber and Başbülbül 2017). The main LAB species isolated in this study were also Lc. lactis, confirming previous observations (Ertürkmen and Öner 2015; İspirli et al. 2017). Overall, the results of this study showed the presence of different LAB isolates, all of which could be associated with ripening of different cheese samples.
Technological characteristics of LABA rich microbial diversity in LAB was observed in Kırklareli white brined cheese samples, which can originate from low pasteurization standards, as temperatures above 65 °C were not reached during the cheese production. These LAB constitute the natural starter microflora of white cheese, as no starter cultures are used in the production of Kırklareli white cheese. To understand the starter potential of LAB from white cheese, several properties of selected isolates were tested, as their moderate acid-forming ability and proteolytic activity are crucial for their use as starter cultures during white cheese production (Settanni and Moschetti 2010).
In terms of acid production, a rapid pH decline is essential to achieve adequate coagulation, curd firmness, and control of bacterial pathogen growth. The ΔpH value of the isolates, where a value of < 1 is considered low, between 1 and 1.5 is considered medium, and greater than 1.5 is considered to have a high acid-forming level (Bradley et al. 1992), was assessed. All isolates showed a low acidogenic activity in skimmed milk, with a pH decrease (ΔpH6) after 6-h incubation at 30 °C ranging from 0.00 to 0.96 pH units. Generally, acid production levels were at an intermediate level for the entire 24-h incubation period ranging from 0.00 to 2.12 pH units, and the highest acidification activity was observed in Lc. lactis isolate #7–30-D, suggesting their potential as starter lactic acid bacteria (LAB) (Marshall 1992; Settanni and Moschetti 2010). In this context, the acidification activity of Lc. and Lb. isolates was determined by isolate-specific characteristics, indicating their potential use as starter and/or adjunct cultures to prevent defective fermentations. The results are presented in Table 2.
Another important characteristic of the cheese isolates was the proteolytic activity, which ranged from 34.05 to 76.45%, the expression of which was determined by isolate-specific characteristics. None of the isolates was positive for the production of H2S. Ammar et al. (2018) categorized the proteolytic activity values of the isolates as strong, moderate, and low, with proteolytic activity values of 100–200, 50–100, and less than 50 μg tyrosine in milliliters, respectively. The results of the present study showed that all found isolates had moderate proteolytic activity except isolates E. faecalis #P13 12–90-B and St. macedonicus #P18 2–15-C, which had low levels of proteolytic activity. In general, isolates with moderate proteolytic activity should be favored for white cheese production in order to avoid the development of bitterness during ripening.
As shown in Table 3, all isolates were sensitive to most antibiotics tested in this study, and 25 different antibiotic profiles (AP1 to AP25) were observed in terms of the degree of inhibition depending on isolate-specific conditions and the antibiotics tested. For example, all isolates were strongly inhibited by ampicillin, whereas the zones of inhibition were generally lower for kanamycin and streptomycin. These two antibiotics have also been shown to be among the antibiotics to which LAB can exhibit high levels of resistance (Pesavento et al. 2014; İspirli et al. 2015). Importantly, the presence of vancomycin-resistant was noteworthy in a few isolates within the antibiotic profiles AP1, AP2, and AP3 in this study. It is worth mentioning that previous reports have documented certain isolates of enterococci derived from human feces and cheese as vancomycin-resistant (İspirli et al. 2015, 2017). Moreover, no antibiotic resistance was detected in various St. macedonicus isolates isolated in this study. The results presented here are consistent with previous observations demonstrating the susceptibility of St. macedonicus isolates (Lombardi et al. 2004). Similar to previous reports of low antibiotic resistance in W. paramesenteroides (Jeong and Lee 2015), the cheese isolate W. paramesenteroides #P19 11–15-A was not found to be resistant to the antibiotics tested. Despite the promising technological properties observed, the isolates of Enterococcus spp., St. macedonicus, and W. paramesenteroides found in the current study cannot be considered for incorporation into cheese production. This is because this species does not have qualified presumption of safety status due to being among the leading causes of community- and nosocomial infections (EFSA 2007). Furthermore, in contrast to previous studies showing resistance of the Lt. curvatus isolate to kanamycin and streptomycin (Shazali et al. 2014), the two Lt. curvatus isolates from white cheese samples were sensitive to all tested antibiotics, including kanamycin and streptomycin. Overall, the results of this study showed that the selected Lc. lactis and Lb. plantarum and Lb. casei isolates within both antibiotic susceptibility profiles AP24 and AP25 (Table 3) were not found to be resistant to antibiotics, which may be a positive feature for their use in industrial production of these cheeses.
Table 3 Antibiotic susceptibility profiles of the selected lactic acid bacteria isolates (n = 51) obtained from different ripening time of white cheese samples against nine different antibioticsAnother important characteristic of LAB cultures from fermented food products is their antibacterial activity. The antibacterial activities of different LAB isolates were tested against important food pathogens B. cereus FMC 19, E. coli ATCC 25922, L. monocytogenes RSKK 472, S. typhimurium NRRLE 4463, and S. aureus ATCC 28213 (Table 4). In general, the antibacterial activity of the isolates was low, as only three of 18 isolates showed antibacterial activity (Table 4). The highest antibacterial activity was observed for the isolate E. durans #P3 5–1-C, as this isolate strongly inhibited B. cereus FMC 19, E. coli ATCC 25922, and L. monocytogenes RSKK 472. The isolate E. durans #P4 9–90-B similarly inhibits E. coli ATCC 25922 and L. monocytogenes RSKK 472, although this isolate was not effective against B. cereus FMC 19. The last isolate to show antibacterial activity in this study was Lt. curvatus #12–30-B, which was only effective against L. monocytogenes RSKK 472. Apart from these three isolates, no other 33 isolates including Lc. lactis and Lb. casei and Lb. plantarum showed antibacterial activity, suggesting that isolate-specific characteristics determine antibacterial activity, which may be due to the production of antibacterial substances such as bacteriocins (İspirli et al. 2017). Studies testing the genotypic and phenotypic characteristics of the bacteriocin production abilities of these isolates are still ongoing.
Table 4 Antibacterial activity of the selected isolates (n = 51) obtained from different ripening time of white cheese samples against five foodborne pathogenic bacteria
留言 (0)