
記住我


The training cohort included 86 CC patients (Table 2), including 64 (74.4%) and 22 (25.6%) without and with LNM, respectively. No significant differences in age, BMI, cancer type, or serum cancer biomarker levels were observed when comparing LNM(−) and LNM(+) patients. However, significant differences between these groups were observed with respect to tumor differentiation, tumor invasion depth, and FIGO staging. Specifically, significantly higher proportions of LNM(+) patients were exhibiting poor tumor differentiation (40.1% vs. 6.2%, P < 0.001), cervical stromal invasion depth ≥ 1/2 (68.2% vs. 35.9%, P = 0.017), and FIGO stage 3 cancer (9.1% vs. 1.6%, P < 0.001) as compared to LNM(−) patients.
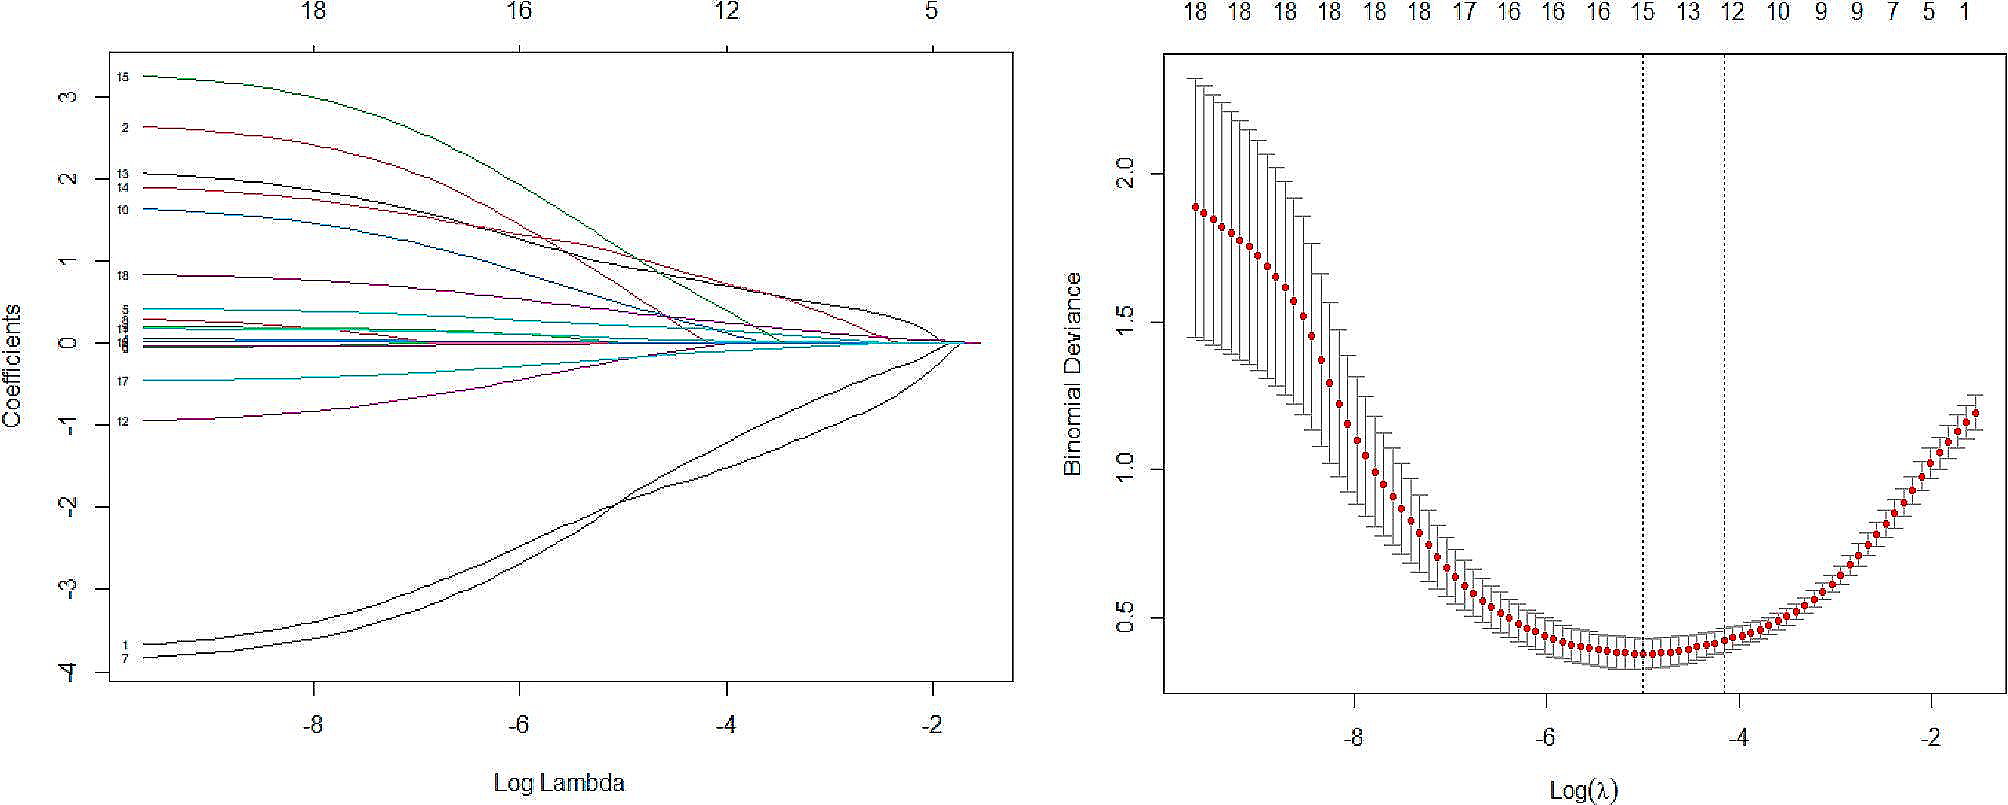
Table 2 Baseline data of the patients in the training groupFeature selection and radiomics score calculationIn total, 851 radiomics features were extracted per scan sequence (T2WI, T2WI-SPAIR, and ADC). A step-by-step process was then used to select features for these sequences and for a combination of these three scan sequences to facilitate the establishment of a radiomics signature. In total, 16 features were ultimately selected for use when calculating radiomics scores (Supplementary Table 1). Coefficient values for each feature and the mean square error for the combined sequences are presented in Supplementary Figure 1.
Predictive model establishmentUnivariate analyses revealed that worse differentiation (P < 0.001), cervical stromal invasion depth ≥ 1/2 (P = 0.01), more advanced FIGO stage (P < 0.001), and higher combined sequence-based radiomics scores (P < 0.001) were all related to CC patient LNM status. In a multivariate analysis, LNM-related risk factors included worse differentiation (P < 0.001), more advanced FIGO stage (P = 0.03), and higher combined sequence-based radiomics scores (P = 0.01, Table 3).
Table 3 Risk factors of the LNMThese results were next used to construct a predictive model, the nomogram for which is presented in Fig. 2. The formula used to compute nomogram scores for this model was as follows: score = −0.0493–2.1410 × differentiation level (0: poor; 1: moderate; 2: well) + 7.7203 × combined sequence radiomics score + 1.6752 × FIGO stage (0: I; 1: II; 2: III). To maximize sensitivity and specificity, we selected a cut-off score of 0.662 (sensitivity = 81.8%, specificity = 85.9%). If the score was greater than or equal to 0.662, the patient was considered to be LNM(+). If the score was less than 0.662, the patient was considered to be LNM(−).
Fig. 2
The nomogram of predictive model
The AUC values for the T2WI, T2WI-SPAIR, ADC, and combined sequence radiomics scores, as well as the combined predictive model, were 0.656, 0.664, 0.658, 0.835, and 0.923, respectively (Fig. 3A, Table 4). The AUC for the radiomics score based on the combination of three sequences was significantly larger than the corresponding AUC values for radiomics scores computed based upon the T2WI (P = 0.005), T2WI-SPAIR (P = 0.008), and ADC (P = 0.01) models. The predictive model exhibited a significantly higher AUC value as compared to the combined sequence-based radiomics score (P = 0.04).
Fig. 3
The ROC curves of radiomics score of T2WI, radiomics score of T2WI-SPAIR, radiomics score of ADC, radiomics score of combined sequences, and the predictive model in the a training and b test groups
Table 4 Diagnostic performance of each parameterModel validationThe testing group included 38 patients (Table 2), including 23 (72.2%) and 15 (27.8%) without and with LNM, respectively. No significant differences in baseline data were observed when comparing the training and testing cohorts (Table 2). The AUC values for the T2WI, T2WI-SPAIR, ADC, and combined sequence radiomics scores, as well as the combined predictive model, were 0.643, 0.525, 0.513, 0.826, and 0.82, respectively (Fig. 3B, Table 4). The AUC for the radiomics score based on the combination of three sequences was significantly larger than the corresponding AUC values for radiomics scores computed based upon the T2WI (P = 0.04), T2WI-SPAIR (P = 0.003), and ADC (P = 0.002), respectively. The AUC value for the predictive model was similar to that for the radiomics score based on the combined sequences (P = 0.94).
Potential clinical benefits of the predictive modelCalibration curves revealed a high degree of consistency between predicted and actual LNM status when using the predictive model in both the training and testing cohorts (Fig. 4A). Decision curves generated for this nomogram additionally revealed that this predictive model was associated with net benefits in both patient cohorts, with a risk threshold greater than 0 (Fig. 4B).
Fig. 4
The a calibration curves and b decision curve analysis of nomograms of predictive model
留言 (0)