Determining the Cellular Landscape of Murine Mammary OrganoidsCell Identities of Murine Organoid Clusters
Previous studies have demonstrated the capacity of human MEC-derived organoids in retaining in vivo lineages [35, 97]. Further studies have demonstrated the feasibility of murine organoid systems to recapitulate parity-associated phenotype, such as expressing milk associated proteins and parity-associated epigenomic signatures [21, 120]. However, the heterogeneity of mammary organoids cultures, and how it recapitulates the heterogeneity of intact tissue remains to be elucidated. In order to assess the cellular and molecular heterogeneity of mammary organoids, we performed single cell RNA sequencing (scRNAseq) in organoid cells that were derived from partially digested mammary epithelium fragments of nulliparous female mice, using the 10X Chromium platform.
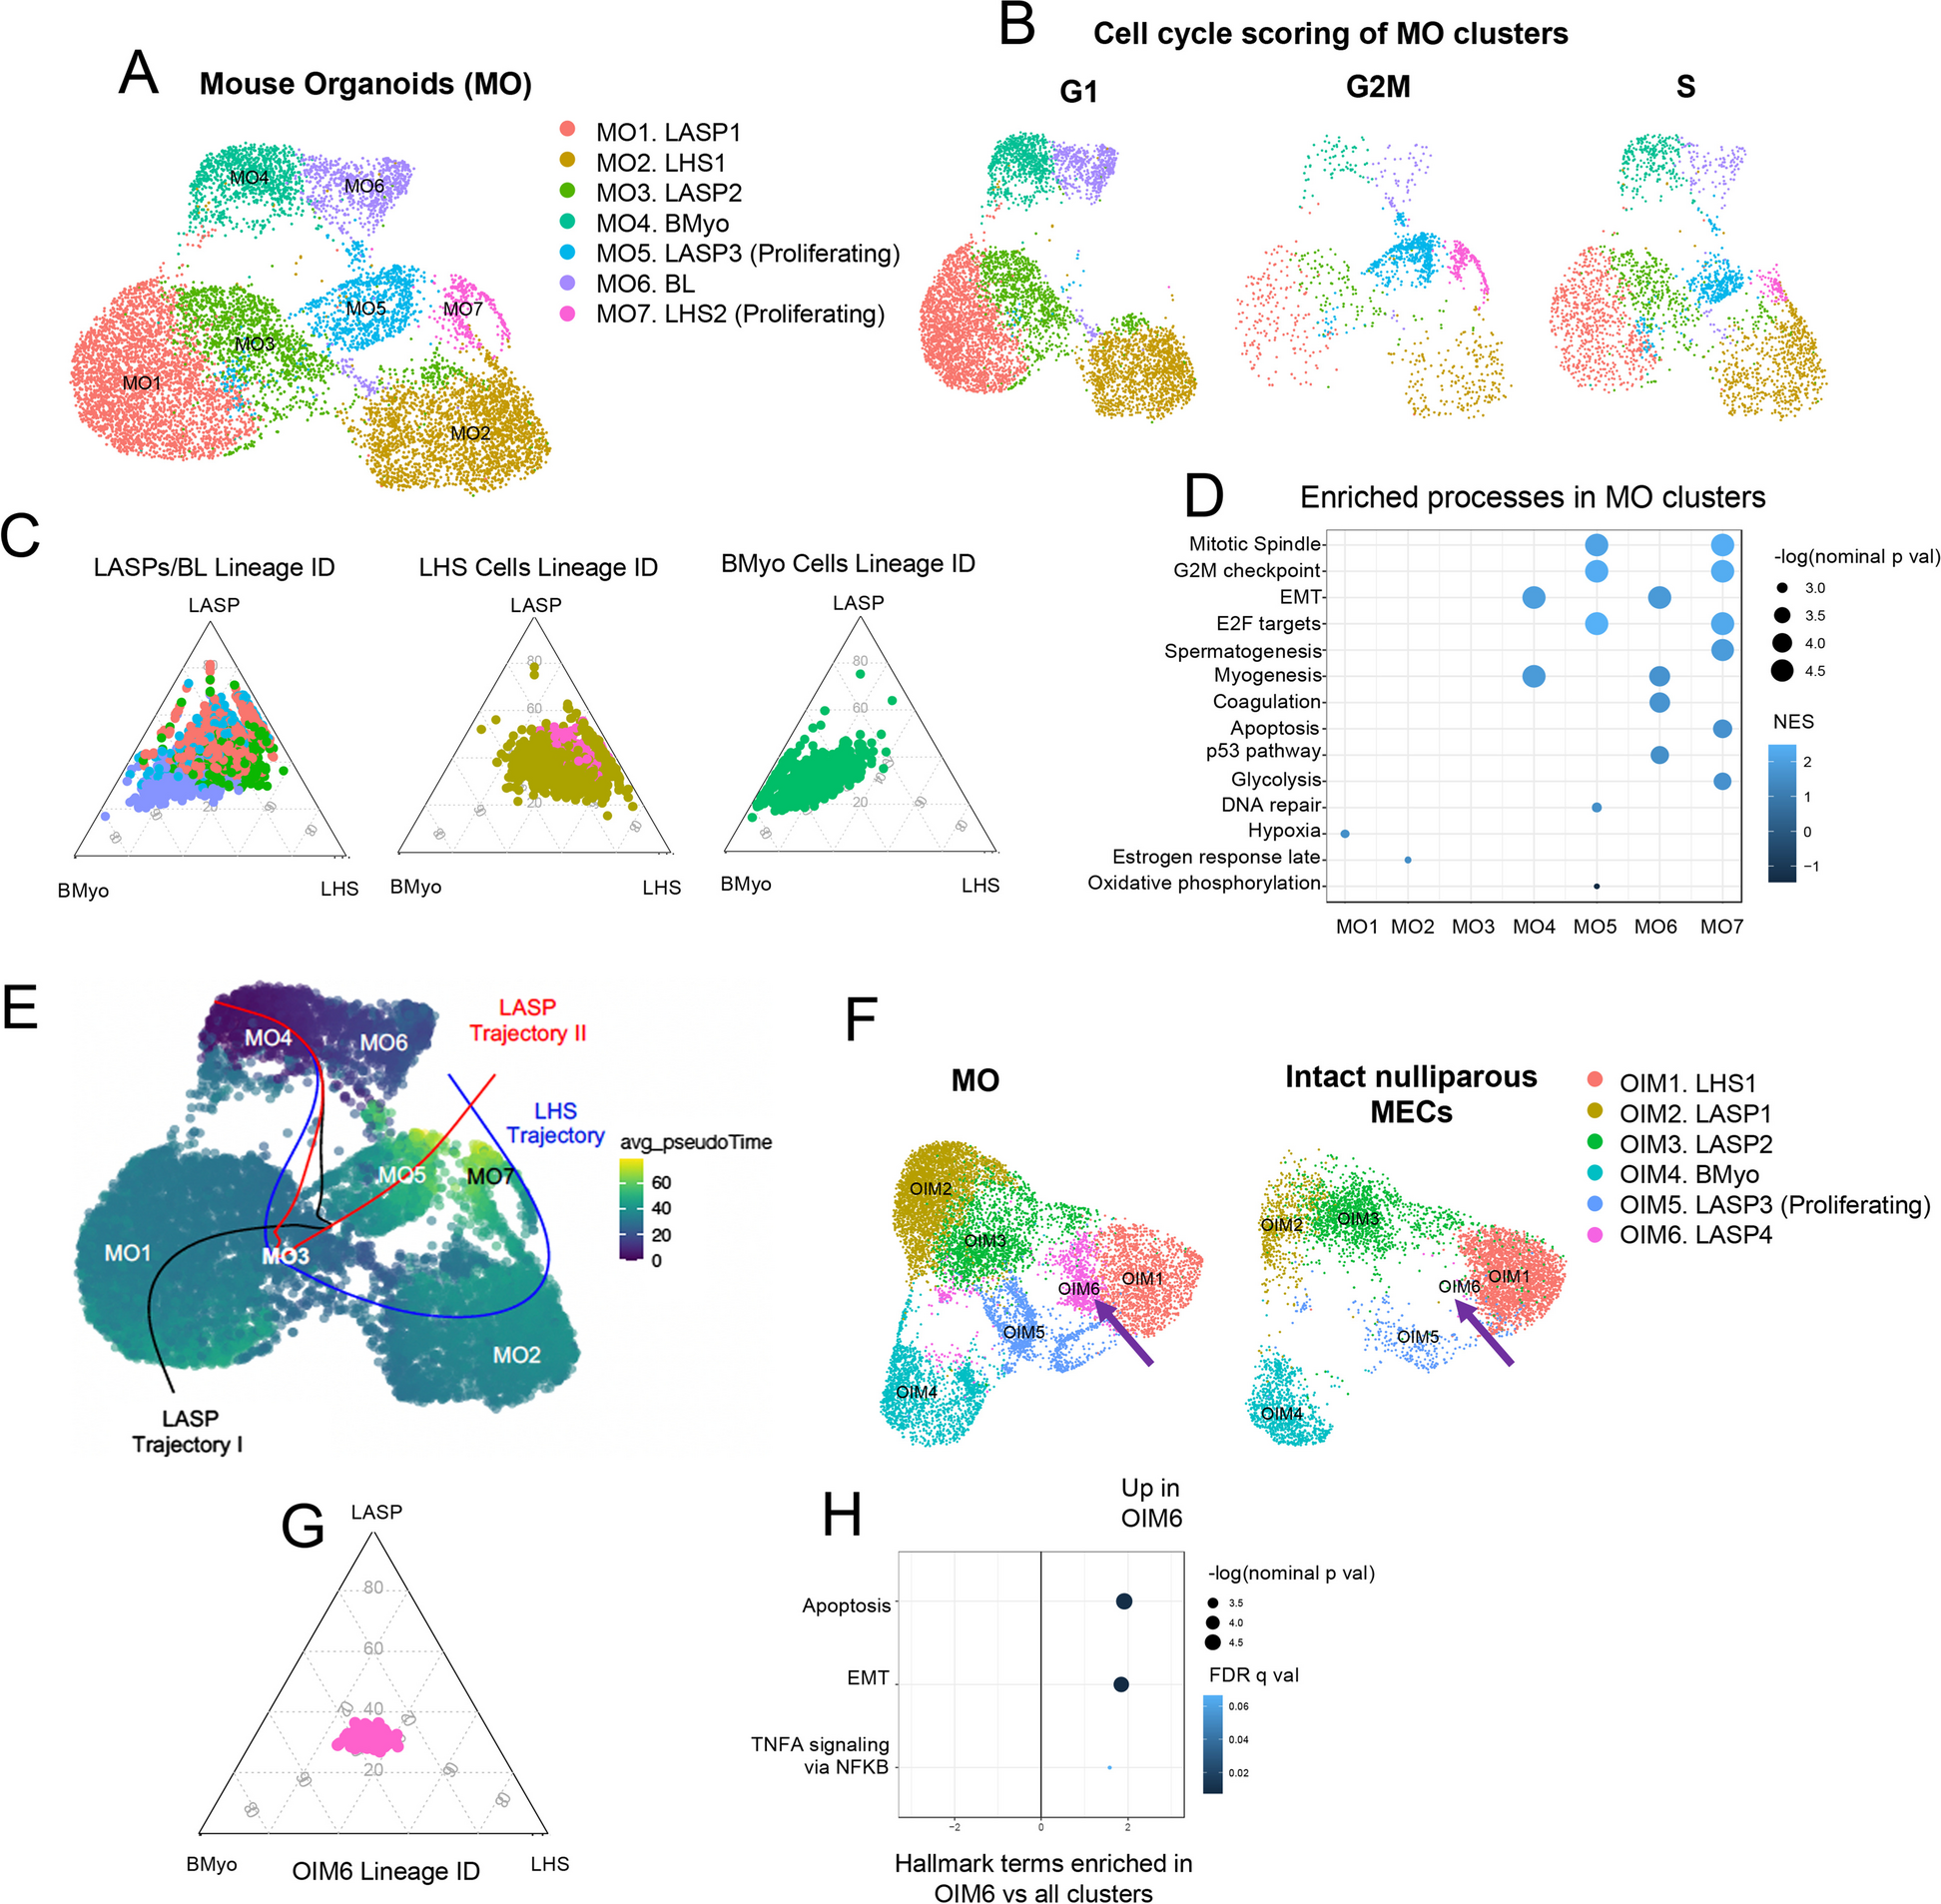
Utilization of previously defined markers for lineage identities in intact mammary tissue [42] allowed for robust classification of Mouse Organoid cell types (referred thereafter at MO clusters). Such analysis identified 5 populations of luminal epithelial cells, marked by the expression of both cytokeratin 8 and 18 (Krt8/Krt18) markers, (MO1, MO2, MO3, MO5 and MO7), one population of basal myoepithelial (BMyo) cells defined by the expression of cytokeratin 5 and 14 (Krt5/Krt14) (MO4), and a cluster of cells expressing both luminal and myoepithelial markers (basal-luminal cells, BL, MO6) (Fig. 1A, Fig. S1A, Table S1).
Further gene expression analysis shed light into the lineage subtypes of each cellular cluster. Expression of hormone receptors such as progesterone receptor (Pgr), prolactin receptor (Prlr) and estrogen receptor a (Esr1) defined luminal populations of hormone sensing (LHS) cells MO2 and MO7 (Fig. 1A and S1A). Cluster MO1, MO3 and MO5 were defined to have a luminal adaptive secretory precursor fate (LASPs), given higher expression levels of genes linked to milk synthesis, such as casein 3 (Csn3), and lactalbumin alpha (Lalba) [4, 103] (Fig. 1A and S1A). Luminal cluster MO5 (LASP3) and MO7 (LHS2) were also characterized by the expression of genes associated with highly proliferative gene signature such as marker of proliferation ki-67 (Mki67), ubiquitin conjugating enzyme E2 C (Ube2c), DNA topoisomerase II alpha (Top2a), thus defined as proliferative cellular states (Fig. S1A). Further cell cycle scoring analysis confirmed that epithelial cells from both MO5 and MO7 clusters were predominantly at G2M and S-phase stages of cell cycle, thus supporting that several luminal subtypes assume a proliferative state in organoid cultures (Fig. 1B).
Our analysis also defined molecular states of less differentiated cell types. We found that cells from clusters MO1, MO3 and MO5 were characterized by expression of luminal progenitor genes FXYD domain-containing ion transport regulator 3 (Fxyd3), cluster of differentiation 14 (Cd14) and claudin-3 (Cldn3) [3, 23, 109, 129] (Fig. S1A). Cluster MO3 cells also expressed genes associated with milk synthesis WAP four-disulfide core domain protein 18 (Wfdc18) and mucin-15 (Muc15), thus supporting a secretory progenitor state [87, 107] (Fig. S1A). Moreover, the suggested lineage identities of all organoid epithelial cell types were supported by the utilization of ternary plot analysis, which suggested an intermediate/LASP lineage signature clusters MO1, MO3, MO5), a BMyo-biased identity to BL cells (MO6), while luminal LHS (MO2 and MO7) and BMyo (MO4) clusters aligned alongside their predicted lineage identities (Fig. 1C, Table S2).
To estimate whether the LASP/intermediate signature is defining less differentiated cells, we investigated the lineage trajectory of mammary organoid cells according to their general transcription similarities, using Slingshot [116]. Our analysis predicted that cluster MO3 cells (LASP2) have a transcriptional profile that branches across multiple trajectories, including those with segments towards BL and LASP1 clusters (MO1 and MO4), and those spanning cluster MO5 (LASP3 proliferating) and BL cells (MO4) (Fig. 1E, black and red lines). Our analysis also identified cluster MO3 cells to share transcriptional programs across clusters MO2 and MO7, thus suggesting trajectories of hormone sensing state commitment (Fig. 1E, blue line). Interestingly, and independently of the shared transcriptional programs with LASP cells, BL cluster MO4 bear a pseudo-time trajectory signal closely related to BMyo cells, thus supporting its dual basal-luminal cellular state (Fig. 1E, dark blue/purple signal).
Signaling Pathways Enriched in Murine Organoids
We next investigated which molecular signatures were enriched in each cluster. While clusters MO5 and MO7 were enriched with pathways associated with cell division, cells from cluster MO2 were marked by processes associated with hormone sensing cells, thus supporting their above assigned cellular states (Fig. 1A, C and D, S1A). Accordingly, the BMyo state of cells from cluster MO4 were supported by the enrichment of genes associated with myogenesis and EMT-like processes [47]. Cells from LASP cluster MO1 were significantly enriched for terms involved in hypoxia. However, when considering hypoxic genes detected in our dataset, we found that most of these were involved in milk-synthesis, such as Lalba and Aldoc, supporting a LASP classification [4, 100, 103] (Table S3). BL cells (MO6) were enriched for terms similar to BMyo (MO4), as well as expressing genes involved in p53 signaling and coagulation. Notably, the genes involved in coagulation in MO6 have also implicated in EMT processes, such as fibronectin 1 (Fbn1) and kallikrein-related peptidase 8 (Klk8), supporting an potential undifferentiated state for MO6 cells [5, 46] (Table S3). Interestingly, cells from cluster MO3, classified as LASPs, did not show enrichment for specific terms in relation to all other cell types, thus suggesting an organoid cellular state that shares transcriptional signatures with all other cellular clusters. We compared MO3 to MO1, in order to explore how early LASPs (MO3) differ from those that are Lalba + (MO1) (Fig. S1B). The aforementioned analysis revealed that cells in MO3 are enriched for genes associated with apoptosis and EMT, both which have been associated with undifferentiated processes in mammary epithelial cells and thus suggest an increased plastic state for cells in MO3 [60].
Comparison of Murine Organoid and Intact MEC Transcriptional Profiles
In order to define any culture-induced changes to mammary MECs, we utilized two previously published scRNA-seq datasets from intact murine mammary tissue [4, 42] to map epithelial cell identities to our organoid data set. Integration of the epithelial portion of the intact MECs datasets and our organoid cells dataset (referred hereafter as OIM clusters) yielded 6 epithelial clusters, including those of luminal fate (OIM1, OIM2, OIM3, OIM5 and OIM6) or BMyo lineage (OIM4) (Fig. 1F, S1C, Table S1). Overall, the majority of clusters defined on intact mammary tissue are represented in organoids, with the exception of cluster OIM6 (BL) and OIM7 (LHS), which were exclusively found in organoid conditions (Fig. 1F). Interestingly, global expression hierarchical relationship across all clusters (dendrogram), indicated a closer relationship between cluster OIM1 (LHS cells) and OIM6, which lacks the expression signature of hormone-responsive cells (Fig. S1C). Conversely, OIM6 expressed elevated levels of genes in LASP cellular states such as Csn3, Trf, and Gm42418, suggesting an expression signature of a not fully defined luminal state (Fig. S1C). In fact, our analysis indicated that OIM6 cells are positioned in an intermediary state, right in between LHS cluster (OIM1), and LASP clusters (OIM2 and OIM3), further suggesting a transitional luminal state (Fig. 1G). GSEA for hallmark terms revealed that organoid-exclusive cluster OIM6 was significantly enriched for terms involving apoptosis and EMT, similar to what we observed in cells within MO3, thus further suggesting the presence of organoid cells with early progenitor phenotypes in culture [60] (Fig. 1H, Fig. S1B and Table S4).
Overall, our initial mapping of molecular and cellular makeup of mammary-derived organoid cultures illustrates aspects of ex vivo models that resemble intact mammary tissue, while highlighting those that are induced by several of the stimuli of a culturing system.
Characterizing the Effects of Estrogen Treatment on Mammary-Derived Organoid CulturesCell Identities of Organoids Treated with Estrogen
Puberty represents the first key signal post-birth that drives mammary tissue expansion and MEC lineage differentiation, with increased levels of estrogen regulating cell-to-cell signaling, immune modulation, and transcription regulation [101, 124, 126]. Once developed, physiological levels of estrogen sustain mammary tissue homeostasis, with cyclical cellular dynamics throughout the estrous cycle further influencing MEC differentiation and proliferation [88]. Yet, the necessity and effects of estrogen supplementation for the growth of mammary organoid cultures has not been fully characterized.
Therefore, with the purpose of determining the effects of estrogen on gene expression, growth, and cellular heterogeneity, we set out to characterize mammary organoids treated with two concentrations of 17-β-Estradiol, 66.6 ng/mL (i.e. “high estrogen”) and 33.3 ng/mL (i.e. “low estrogen”) (referred hereafter as OE clusters) (Fig. 2A and S2A). The higher estrogen concentration aimed to replicate levels found during peak estrogen production, such as during pregnancy, while the lower concentration sought to mimic physiological levels of the hormone. Our analysis identified several clusters shared by all conditions, spanning BMyo fates (OE4), LHS states (OE6 and OE9), LASP subtypes (OE1, OE2, OE3, OE8), and BL subtypes (OE7) (Fig. 2A-B). We also identified cellular clusters marked by the expression of proliferation markers, encompassing LHS (OE9), and LASP (OE5) luminal states (Fig. 2A, S2B-C).
Further analysis of cell population distribution across organoid conditions indicated a few cellular clusters biased to specific datasets. We found a subtle decrease on the abundance of LASP3 (OE3) in organoid conditions supplemented with estrogen, perhaps suggesting that luminal progenitor differentiation in response to increased levels of estrogen can also be observed in organoid cultures [7] (Fig. 2A-B). Depletion of BL cells (OE7) was also observed in organoid cultures treated with estrogen, supporting the suggestion that estrogen supplementation may be inducing the differentiation of immature cell types, as is observed in vivo [110] (Fig. 2A-B). Interestingly, none of these cell types express hormone genes, thus suggesting a possible indirect effect of estrogen on their homeostasis/differentiation [112] (Fig. S2B). We also identified alteration to cluster of LHS cells (OE6), thus validating that expression of hormone responsive genes in subtypes of organoid cells are linked with cellular expansion in response to increased estrogen levels [30] (Fig. 2A-B, and S2B).
Signaling Pathways in Organoids Activated by Estrogen
We next decided to investigate global gene expression alterations across untreated and estrogen-treated organoid clusters. We first defined gene expression alterations across untreated organoids and those treated with low levels of estrogen, given that all identified clusters are represented in both conditions (Fig. 2A). Our analysis identified that clusters defined with an LHS identity (OE6 and OE9) displayed the most gene expression alterations in response to estrogen treatment, with enrichment of pathways associated with TNF-⍺ signaling via NF-κB pathways, myogenesis, EMT thus suggesting a complex net of programs that control hormone sensing states (Fig. 2C). In addition, proliferative LHS2 cells (OE9) demonstrated selective enrichment for processes associated with estrogen response (early and late) and K-Ras signaling, a pathway previously associated with estrogen receptor signaling [27] (Fig. 2C). Conversely, the population of LHS cells expanded in response to estrogen levels (OE6) was selectively enriched for pathways associated with reactive oxygen response and genes that downregulate UV responses, both potential antioxidant pathways also described to be regulated by estrogen [14, 41].
In addition to cell types defined as LHS, estrogen treatment of organoids induced alterations to specific pathways in non-hormone sensing cells. Enrichment for TNF-⍺ signaling via NF-κB pathways was observed in LASP1 (OE1), BL cells (OE7) were exclusively enriched with genes associated with myogenesis, a process that can either be suppressed or activated by estrogen levels on cellular contact dependent fashion [71, 83, 117] (Fig. 2C). We also identified the enrichment of EMT processes in LASP3 cells (OE3), an observation that may link EMT with estrogen-induced differentiation [38, 128] (Fig. 2C). Moreover, the only statistical significantly enriched pathway downregulated by estrogen was associated with c-Myc regulated processes in LASP3 cells (OE3), a signal that is essential to keep immature properties of mammary epithelial cells [91] (Fig. 2C). Interestingly, low levels of estrogen did not result in the significant enrichment of pathways in clusters of cells with BMyo fate (OE4), or certain LASP populations (OE2 and OE8), suggesting that subtypes of MECs that lack the expression of hormone genes are less affected by female hormones (Fig. 2C). Nonetheless, high levels of estrogen did enrich the aforementioned non-hormone sensing subtypes for oxidative phosphorylation-associated genes, indicating that non-hormone sensing cells are still capable of responding to hormones, at a lesser degree (Fig. 2D).
Regulons Coordinating Transcriptional Activities in Response to Estrogen
To assess how the regulatory networks modulating processes in each cellular sub-type might be affected by estrogen, we calculated the regulons with the highest specificity scores (RSS) for each of the OE clusters and segregated them by treatment condition (i.e., untreated, low estrogen treatment and High estrogen treatment) (Fig. 2F). Our analysis identified a series of regulons that defined overall cellular states, including proliferative (Rad21, Ybx1 and Chd2) and progenitor (Nf1, Cebpb, Sox10, Sox5, Trsp1) states [24, 27, 49, 58, 65, 75, 76, 123].
Interestingly, BMyo cells (OE4) and BL cells (OE7) shared similar transcription networks, with the exception of programs regulated by Creb3, which was also enriched in clusters defined to have luminal signatures (Fig. 2F). In fact, Creb3 has been shown to have increased activity in cells undergoing luminal-basal cellular plasticity in response to high levels of Sox9, thus supporting the suggested mixed lineage state of cells from cluster OE7 [19] (Fig. 2F). These observations suggest that mixed lineage cell types have a transcriptional identity that resembled basal states closely, with discrete alterations to luminal-biases programs.
We also identified estrogen-induced changes to transcriptional programs, encompassing both alterations to several lineage restricted programs, and those spanning several cellular states.
Analysis of BMyo cells (OE4) demonstrated a bimodal change of basal transcription programs, with the enrichment of luminal-basal plasticity regulators such as Creb3, Tfe3, and Sox4, and partial loss of programs controlled by Relb and Zfp358, both reported to be downregulated by estrogen [127, 130] (Fig. 2F). Further analysis of luminal cell types indicated enrichment of lineage specific transcriptional programs in specific cellular clusters (OE2, and OE5) (Fig. 2F). Collectively, these analyses suggest that estrogen treatment impacts the lineage programs of specific luminal and basal cell types, thus indicating cell types that are the most responsive to increased levels of female hormone.
Our investigation also identified a group of transcription programs that were altered in a lineage-independent fashion in response to estrogen levels, including programs regulated by Edr, Ehf, Creb5, Tfdp2, Elf2, Sin3a, E2f4 TFs, previously linked with regulating the cell cycle, cell growth and proliferation [40, 48, 61, 67, 92, 93] (Fig. 2F). Notably, Ehf has been reported to increase when mammary stem cells begin the process of differentiation, suggesting a role for estrogen in the maturation of hormone receptor negative MECs [133]. Collectively, our analysis indicated gains and losses of these regulon activities across all identified cellular states, thus further illustrating the complex effect of estrogen on regulatory process of all subtypes of mammary epithelial cells.
Pregnancy Hormones Exposure, Cellular States, and Gene ExpressionCell Identities of Organoids Treated with Pregnancy Hormones
Mammary organoid systems have been previously optimized to mimic aspects of pregnancy-induced development of the gland, such as branching and production of milk-associated proteins, involution-like processes, and mechano-regulated actions of lactation [21, 115, 120]. Yet, it is unclear whether mimicking pregnancy-induced changes ex vivo drives cellular and transcription alterations such as those that take place in vivo. Therefore, we set out to characterize mammary organoid cultures, grown with a combination of estrogen, progesterone, and prolactin (EPP) hormones (referred hereafter as OP clusters) using scRNA-seq approaches. Our analysis identified clusters present in both untreated and EPP-supplemented conditions, encompassing cellular states of LASP fate (OP1, OP3, and OP6), BMyo lineage (OP5), in addition to lineages more abundant in untreated organoids (LHS clusters OP4, OP9, and BL cluster OP7), and those expanded in EPP-treated conditions (LHS clusters OP2, OP8, and BL cluster OP10) (Fig. 3A-B and Fig. S3A). Amongst these clusters, we identified highly proliferative cells in both conditions (OP6) (Fig. 3A-B and Fig. S3B-C).
Signaling Pathways in Organoids Activ


留言 (0)